the Creative Commons Attribution 4.0 License.
the Creative Commons Attribution 4.0 License.
 | 02 Apr 2024
Late Pleistocene to Holocene event stratigraphy of Lake Hallstatt (Salzkammergut, Austria): revealed by the Hipercorig drilling system and borehole logging
Marcel Ortler
Achim Brauer
Stefano C. Fabbri
Jean Nicolas Haas
Irka Hajdas
Kerstin Kowarik
Jochem Kueck
Hans Reschreiter
Michael Strasser
The Hipercorig Hallstatt History (H3) project aims to unravel the entire Late Glacial to Holocene sedimentary succession recording past climate, environment, natural hazard impacts, human–environment interactions, and prehistoric mining history. We successfully cored 51 m of the sedimentary succession of Lake Hallstatt, revealing a high-resolution Late Pleistocene to Holocene sediment record, overcoming the previous coring limit of 15.63 m (dated to ∼ 2.3 ka cal BP). The novel drilling platform Hipercorig allows the recovery of undisturbed long cores and the acquisition of borehole logging data of deep lakes. The sedimentary record is spliced to a composite core profile, and for the first time borehole logging data are linked to a core–log seismic correlation of an intra-mountainous lake of the Eastern Alps. The recovered sequence consists of two major lithostratigraphic units: (i) Unit 1 (Holocene, 0–41.7 m below lake floor) with 10 (up to 5.1 m thick) instantaneous deposits and (ii) Unit 2 (Late Pleistocene, > 41.7 m below lake floor). The Late Pleistocene sediments comprise the Younger Dryas and the deepest recovered sediments likely date back to the Allerød interstadial. Within the Holocene, six different periods are observed in the core and borehole logging data, showing distinct physical property fluctuations and an overall increase in sedimentation rate upcore. Lake Hallstatt provides a unique prehistoric archive, being located within the UNESCO World Heritage area Hallstatt–Dachstein/Salzkammergut, a region with a rich history of human salt mining dating back to 3400 cal BP (Middle/Late Bronze Age) and one of the oldest documented cultural landscapes worldwide.
- Article
(8501 KB) - Full-text XML
-
Supplement
(773 KB) - BibTeX
- EndNote


The aim of deep drilling in lakes is to recover a high-resolution sedimentary stratigraphy to study past climate, environment, natural hazard impacts, and human–environment interactions. Such lakes can help to improve our understanding on a local, regional, and sometimes even global scale, covering parts of the Quaternary (Litt et al., 2012; Wagner et al., 2019) and beyond (Brigham-Grette et al., 2013). Borehole logging data can help to reconstruct the lithostratigraphy, estimate the clay content, bridge sediment core gaps for improved core–log depth correlation, and help to correct for core compaction and expansion (Baumgarten et al., 2014, 2015; Jutzeler et al., 2014). The Hipercorig, a sediment coring system, was developed to overcome the financial and logistical burden of the usual long-core drilling campaigns. It simplifies the coring technique to a degree that the recovery of 100 m long sediment cores from deep lakes or shallow marine environments is much more effective (Harms et al., 2020). So far, two lakes were cored during an initial testing phase of the new system: Lake Constance (Germany–Austria–Switzerland) with a water depth of up to 204 m and 87 % core recovery (Harms et al., 2020; Schaller et al., 2022) and Mondsee (Austria) with a coring depth of 63 m, accessing sediments dating back to ∼ 18.4 ka cal BP (Harms et al., 2020).
Mountainous regions are among the most sensitive to climate change and natural hazard processes (Adler et al., 2022) of different causes (e.g., meteorological, hydrological, and/or seismic hazards) and potentially cascading effects. Such hazards can range from local-scale events (e.g., debris flows, rockfalls, or avalanches; e.g., Kiefer et al., 2021; Knapp et al., 2018) to large-scale regional events (e.g., earthquakes, droughts, or floods; e.g., Oswald et al., 2021; Swierczynski et al., 2013) threatening human lives and infrastructure. Even though flood-rich periods in central Europe coincided with relatively cold periods in the past 9000 years (e.g., Blöschl et al., 2020; Wilhelm et al., 2022), it is expected that extreme precipitation in mountainous regions will increase in the currently warming climate in all IPCC scenarios (Arias et al., 2021), with likely cascading effects of, e.g., landslides or floods. A clear commitment to assess extreme events is vital to reduce the vulnerability and exposure of human societies to such hazards. To this end, high-quality observational data over long timescales are needed, to evaluate recurrence rates, patterns, and magnitudes of potential future extreme events with statistical relevance (e.g., Moernaut, 2020; Sabatier et al., 2022). However, short historical and even shorter instrumental records limit our knowledge of natural hazard processes, leading to significant uncertainties in risk assessment (Costanza et al., 2007; Stein et al., 2012), potentially underestimating extreme events with low-probability but high-impact outcomes. Therefore, studying prehistoric events using geological records is needed (i) to reconstruct the past occurrence of meteorological, hydrological, and seismological hazards and their anthropogenic impacts, as well as their complex interactions, and (ii) to gain a better understanding of magnitude–frequency relations of natural hazards to reduce epistemic uncertainties in their assessment. The intra-mountainous UNESCO area Dachstein/Salzkammergut (Austria) is an exceptionally well-suited study area for investigating natural hazards and human–environmental interactions, due to a long history of human impact and settlement (Reschreiter and Kowarik, 2019) and documented historic and prehistoric evidence for human–environmental interactions (Barsch et al., 2023; Festi et al., 2021; Grabner et al., 2021; Knierzinger et al., 2021; Reschreiter and Kowarik, 2019). Previous short-core and conventional lake coring studies have documented the last ∼ 2.3 kyr cal BP (at 15.63 m) of Lake Hallstatt's sedimentary infill (Lauterbach et al., 2023; Strasser et al., 2020).
The Hipercorig Hallstatt History (H3) project overcomes the previous coring limitations through the novel Hipercorig platform (Harms et al., 2020) and accesses the deeper high-resolution lacustrine archive of Lake Hallstatt allowing state-of-the-art multiproxy-based research. Here, we present the first major event stratigraphy of an intra-mountainous, high-resolution lake record of the Eastern Alps, based on the combination of seismic airgun data, borehole, and core logging. The first-time use of borehole logging data on the Hipercorig system enables us to better understand and link the cored sedimentary evolution of Lake Hallstatt to the seismic data and its seismic stratigraphy.
Lake Hallstatt (47°34′25′′ N, 13°39′35′′ E; 508 m above sea level, area of 8.55 km2, ∼ 7.5 km long, up to 1.4 km wide, lake volume ∼ 558×106 m3, maximum water depth 125 m, Fig. 1) is a former glacial, fjord-like, intra-mountainous lake, classified as oligotrophic, with holomictic–dimictic mixing with infrequent meromictic phases (Beiwl and Mühlmann, 2008; Ficker et al., 2011). The lake is located in the UNESCO World Heritage region Hallstatt–Dachstein/Salzkammergut, Austria. The area is situated in the Northern Calcareous Alps, with steep limestone mountains surrounding it and the still glaciated Dachstein Massif to the south and the Totes Gebirge in the northeast within the upstream catchment area.
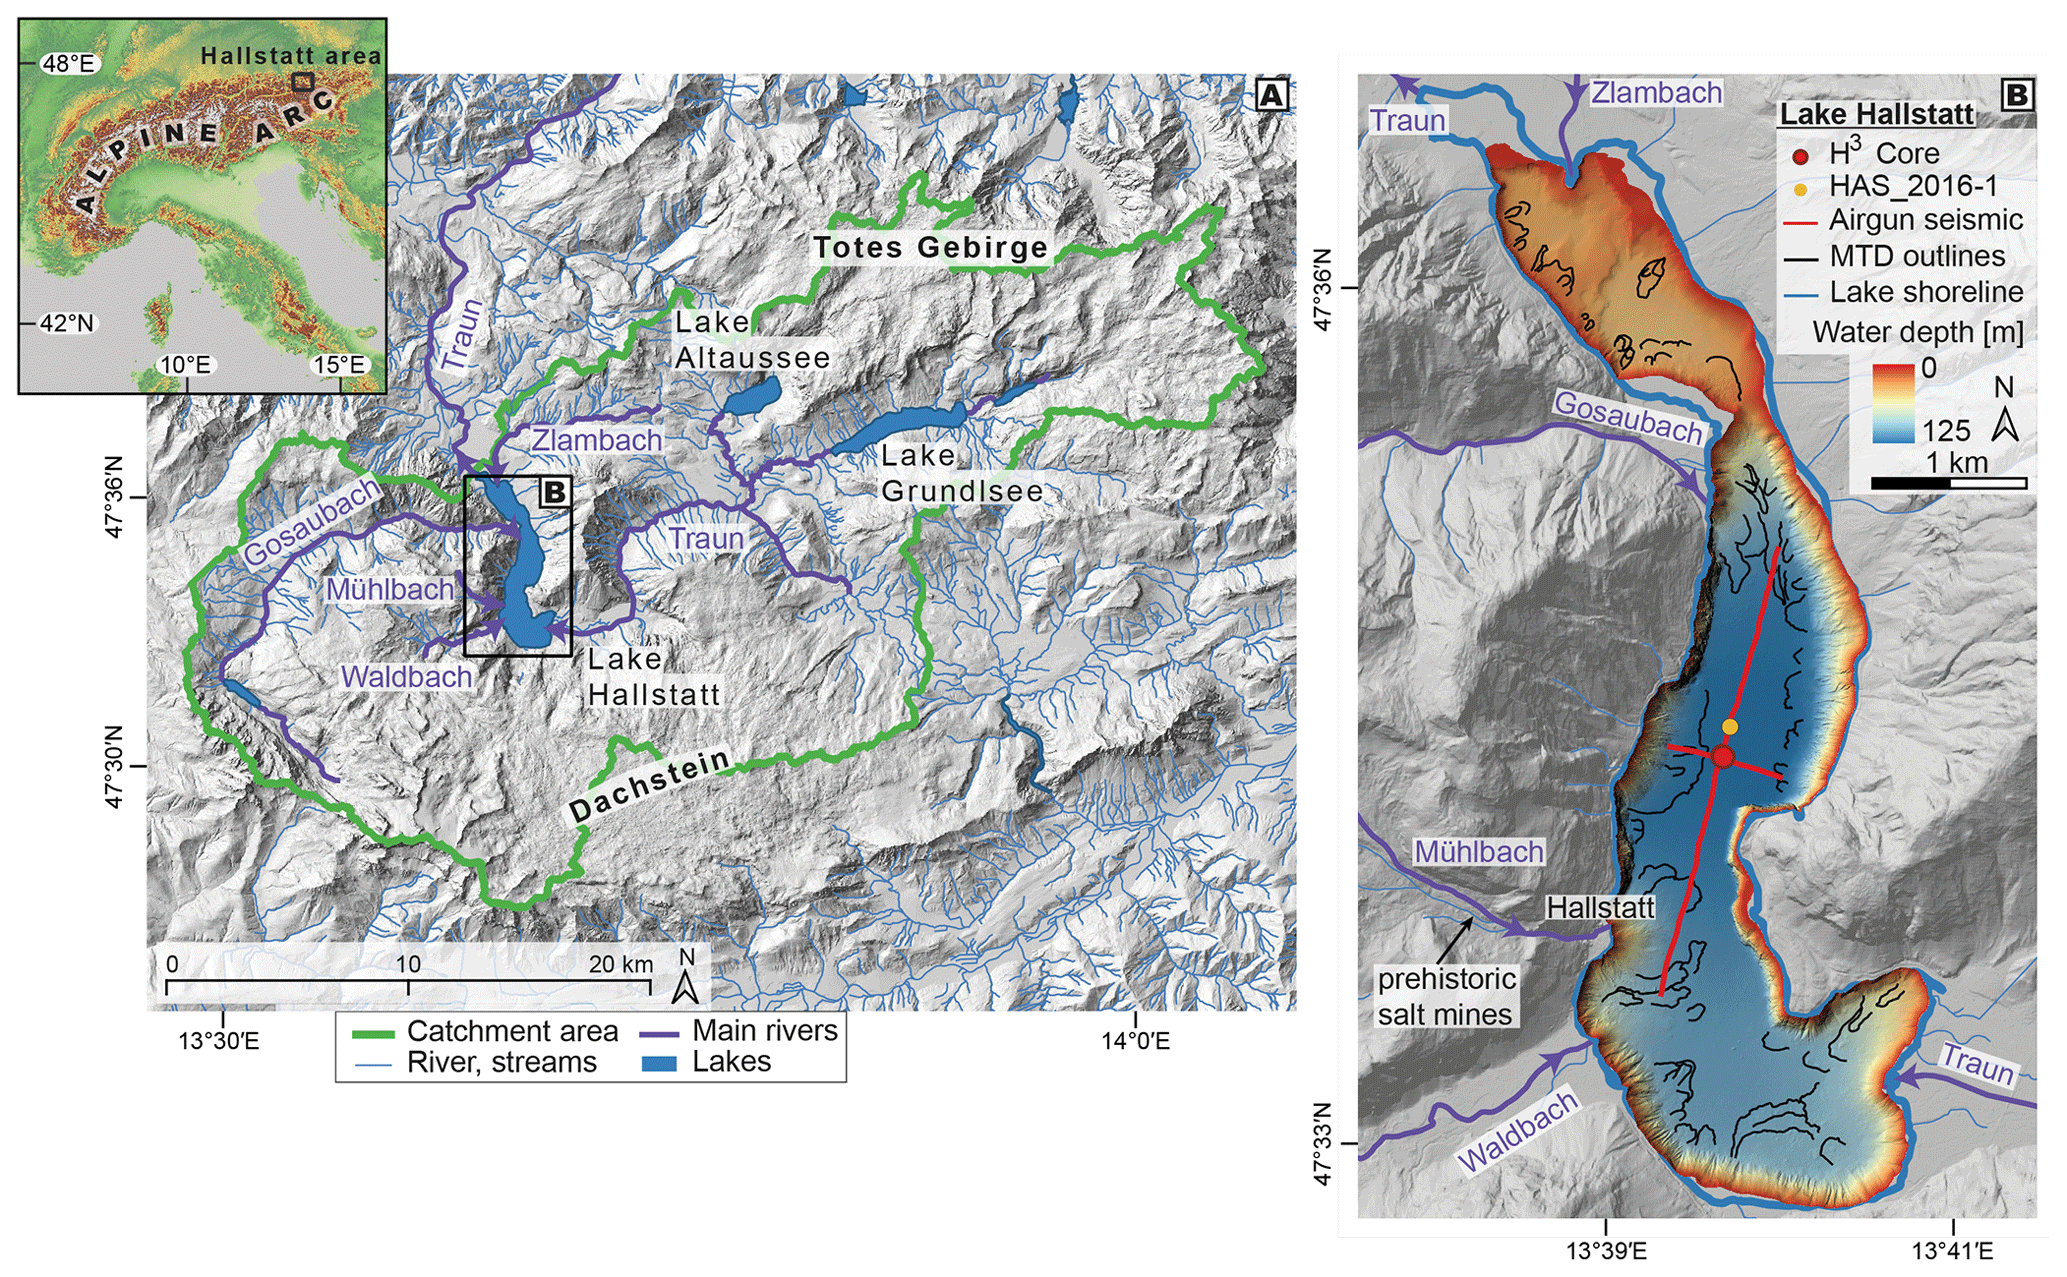
Figure 1(a) Location of Lake Hallstatt (Salzkammergut, Austria) in the Alpine Arc (inset) and overview map of the Lake Hallstatt region north of the Dachstein Massif and southwest of the Totes Gebirge, with its catchment area outlined on a shaded relief map. The digital elevation models were taken from Copernicus Land Monitoring Services (European Digital Elevation Model (EU-DEM), version 1.1) and http://data.gv.at (last access: 12 January 2021) (http://geoland.at, last access: 12 January 2021, Umweltbundesamt GmbH, Land Steiermark, Land Oberösterreich), including catchment area and water network. (b) Lake Hallstatt overview map, with the N–S and W–E seismic airgun transects and the H3 coring locations (red dot), including the previous HAS_2016-1 core site (yellow dot) of Lauterbach et al. (2023). Bathymetry data and mass-transport deposit (MTD) outlines following Strasser et al. (2020).
Today, the north–south-stretching lake can be subdivided into two sub-basins: (i) a shallower northern basin (∼ 45 m deep) and (ii) a deeper southern basin (∼ 125 m deep; Strasser et al., 2020). The formation of the overdeepened lake basin occurred through repeated glacial erosion. The last glacial cycle ended ∼ 17 ka cal BP with the retreat of the Traun Glacier (Van Husen, 1977, 1997, 2011). The primary clastic carbonate influx mostly comprises the eroded surrounding Triassic limestones of the Dachstein Formation (Mandl et al., 2012).
The catchment area of Lake Hallstatt covers 646 km2, with the Traun River in the SE as the main river inflow contributing 53 % of total inflow and ∼ 50 % of the total catchment area. The Traun inflow has a mean annual discharge (1970–2006) of 20.7 m3 s−1 (Ficker et al., 2011). Other larger tributaries are the Gosaubach in the northwest, the Waldbach in the southwest flowing into the southern basin, and smaller tributaries such as the Großer Zlambach in the north flowing into the northern basin and the Mühlbach at the town of Hallstatt, draining the high valley of the Hallstatt salt mine area. The mining area is located geologically within the upper Permian to Lower Triassic Haselgebirge Formation (e.g., Fernández et al., 2021; Schorn and Neubauer, 2014). Evidence for large-scale underground rock salt mining dates back at least to 3400 cal BP (Grabner et al., 2019). The salt-enriched Haselgebirge Formation is also present around Lake Altaussee and Grundlsee upstream of Lake Hallstatt, as well as around Bad Ischl and Ebensee.
The history of this Alpine landscape is well-documented through archeological data and written records indicating that this region was settled more or less continuously since the Bronze Age at the latest (Festi et al., 2021; Reschreiter and Kowarik, 2019). Due to the economic importance of this region a substantial record of written sources exists and provides insights into the last 400 years, including mentioning catastrophic events such as mass movements, heavy precipitation with debris flows, shoreline collapses, and earthquakes (e.g., Melzner, 2017; Reschreiter and Kowarik, 2019; Rohn et al., 2005; Urstöger, 2000).
On occasion, these sources also convey information on societal reaction to these geohazards, including information on early geoengineering in the catchments and river redirections (Pürstinger, 2017; Urstöger, 2000). Historical information from major floods of the Traun river contributed to a comprehensive European flood study also covering the last 500 years (Blöschl et al., 2020; Kiss, 2019; Rohr, 2006, 2007). Furthermore, long-term limnological monitoring data over the last century also document the effects of wastewater intrusions from salt mining, including the salt mine in Altaussee, on water column stratification in Lake Hallstatt (Ficker et al., 2011).
A previous study by Strasser et al. (2020) investigated the geomorphology and event stratigraphic record covering the last ∼ 130 years of Lake Hallstatt. They report an ultra-high-resolution sedimentary archive with (millimeter to sub-millimeter) laminated background sediment and sedimentation rates of 0.50 to 0.4 cm yr−1. High-frequency hydroacoustic subsurface imaging was limited to 4–5 m of the sedimentary infill and revealed parallel and laterally continuous low- to medium-amplitude reflections. Several gravitational mass movements were identified, and event layers comprising turbidites and mass-transport deposits are correlated to specific floods in the 19th and 20th century and moderate earthquakes, respectively (Strasser et al., 2020). Furthermore, a study of Lauterbach et al. (2023) revealed, three large-scale mass movement event deposits: E1 – 84 ± 48 cal BP; E2 – 1058 ± 60 cal BP; E3 – 2313 ± 131 cal BP (Lauterbach et al., 2023). These were interbedded within the background sedimentation. Likely, the coarse character of the large-scale event deposit of E3 restricted the previous coring expedition to 15.63 m.
3.1 Site survey and site selection
Hipercorig drilling was planned to be in the depo-center of the southern basin near the previous coring location (HAS_2016-1, Fig. 1b) (Lauterbach et al., 2023). Previous coring in 2016 was abandoned at 15.63 m depth when reaching the upper part of E3, a major mass-transport deposit (MTD; Lauterbach et al., 2023). A single-channel seismic survey was conducted in March 2021, with the objective to locate the optimal site for drilling with a potentially more complete stratigraphic succession and thinner E3. A mini-airgun (Sercel Mini GI, 220 Hz center-frequency) was used, with a volume of 0.016 L (1 cubic inch), a pressure of 80 bar, and a shooting interval of 2 s in combination with a 12-element single-channel streamer (3 m active length). The theoretical vertical resolution is ∼ 1 m. The data were pre-processed (using (1) DC (direct current) Removal, (2) TAR (True Amplitude Recovery), (3) DC Removal, (4) BPF (bandpass filter) 30-90-2000-2500, (5) trace equalization, and (6) FX (frequency spatial distance)-Deconvolution and BPF 100-150-2000-2500) and applying another bandpass filter (100-150-1000-1500) in the IHS Markit Kingdom Suite 2022, which was also used for seismic interpretation. An acoustic velocity of 1500 m s−1 was used for the conversion from two-way travel time (TWT) to depth. Due to the limitation of the single-chamber airgun system, a bubble pulse effect (typically at 25 ms, with 60 Hz) is noticeable on the seismic sections, creating artifacts below 25 ms TWT (∼ 22.5 m below lake floor, m b.l.f.) (Lankston, 2017), which hamper the interpretation (Fig. 2, green arrows). Based on the new seismic airgun data, the H3 site was selected ∼ 200 m south of the HAS_2016-1 coring site.
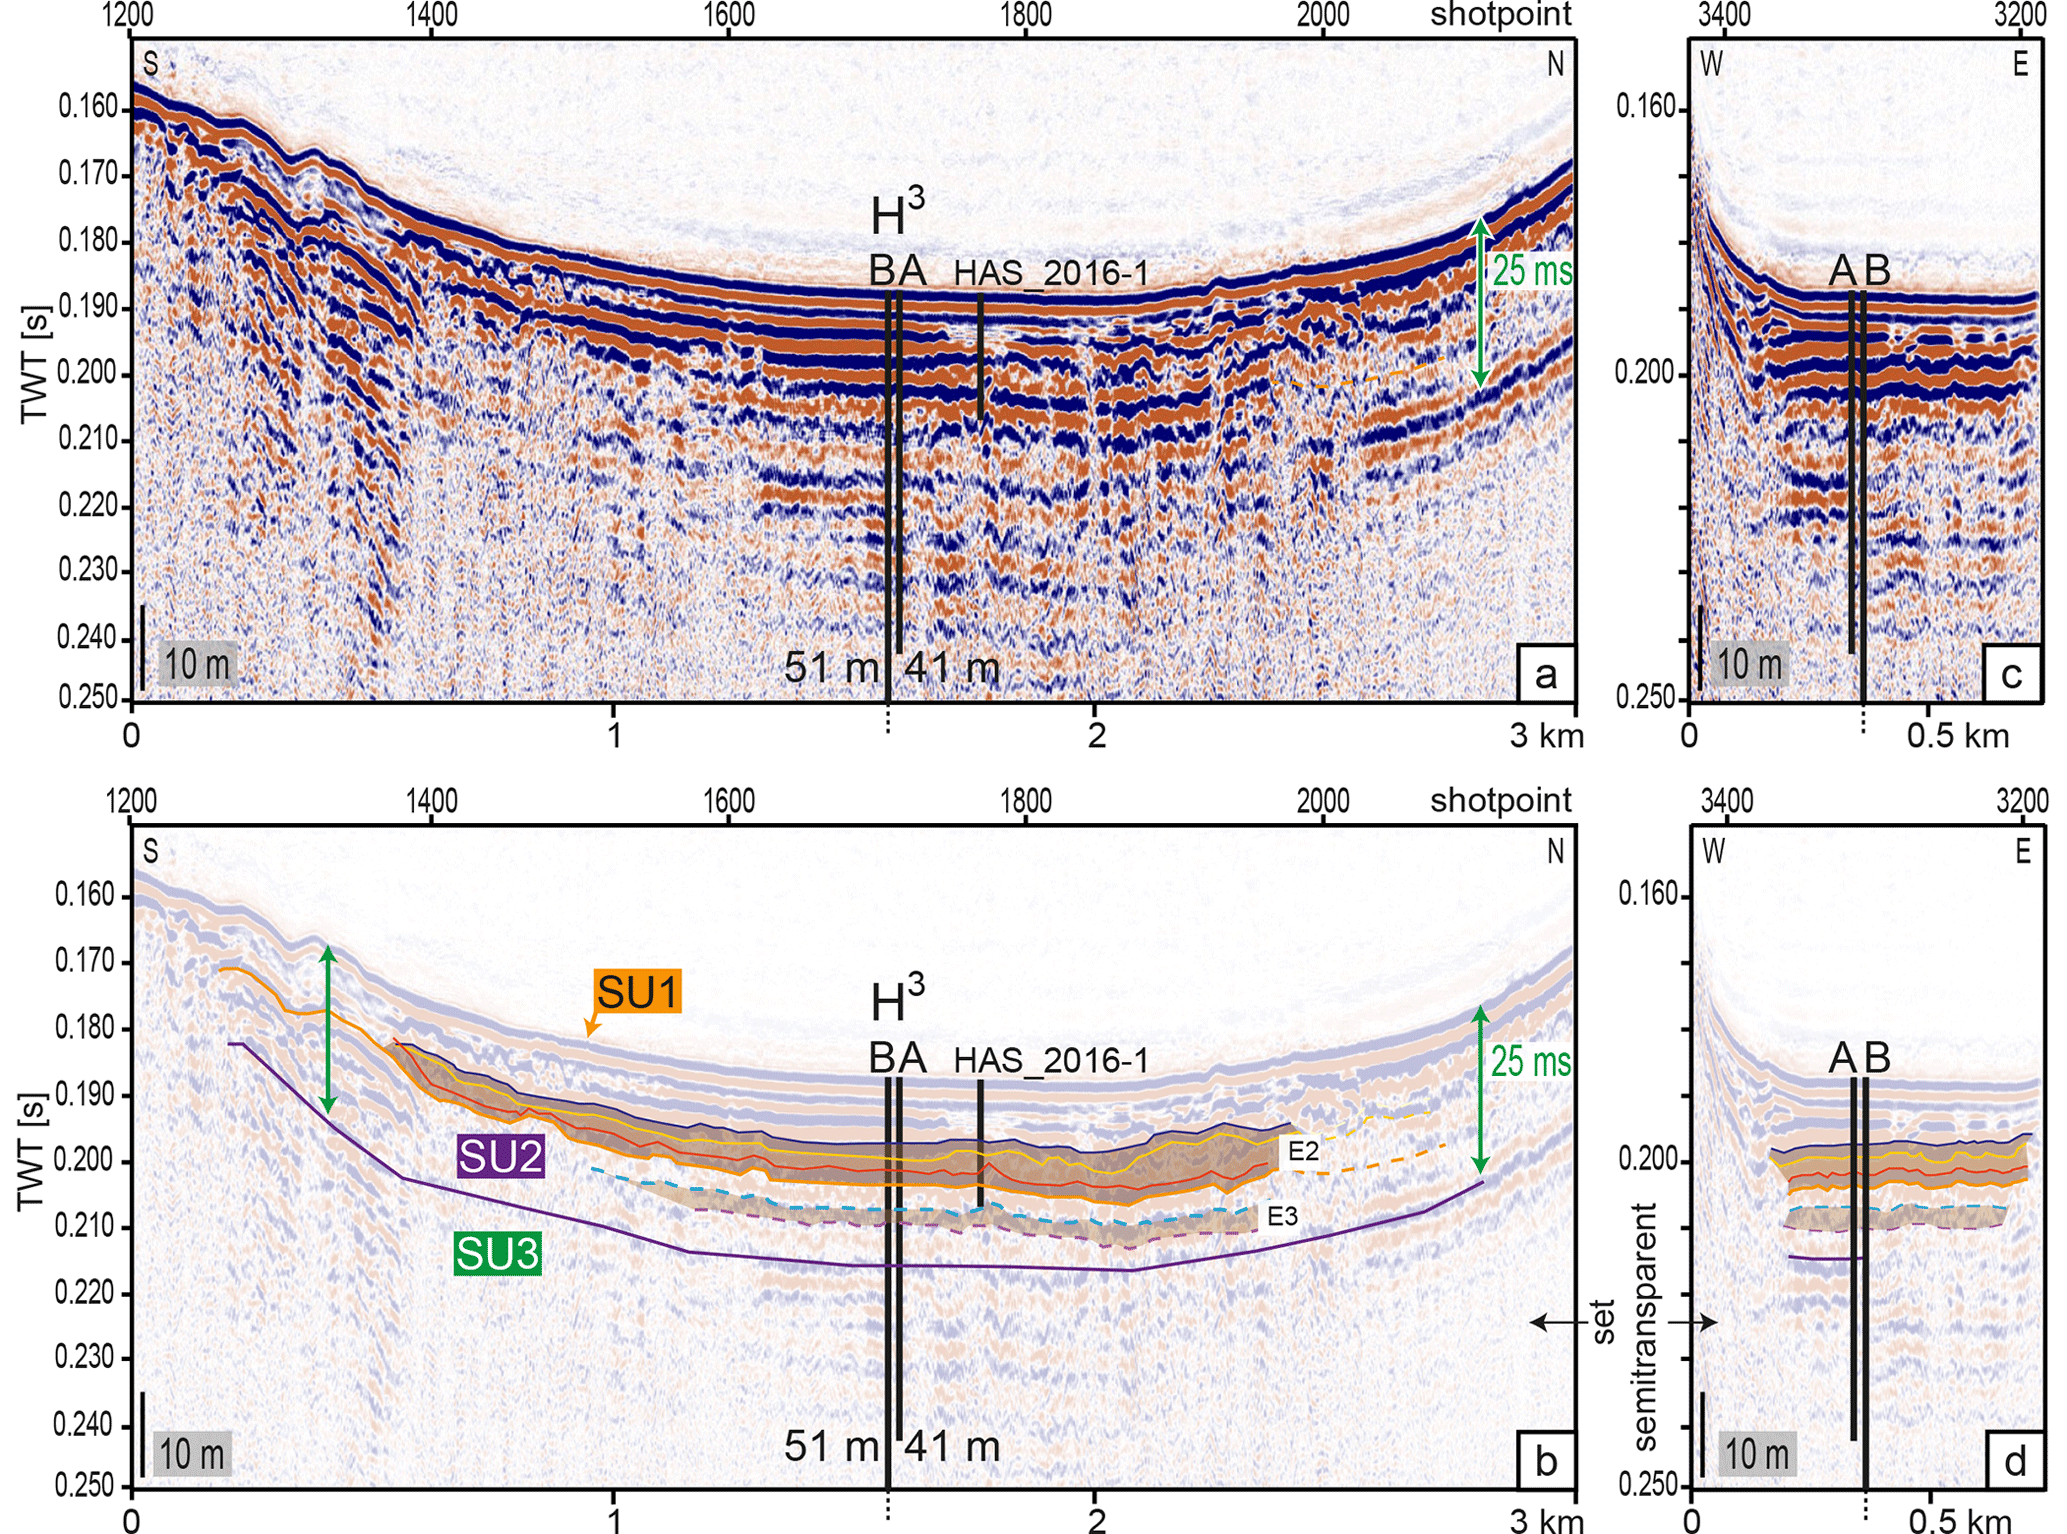
Figure 2(a) Reflection seismic airgun profiles for Lake Hallstatt (Salzkammergut, Austria) from south to north revealing the upper ∼ 15 m of the sedimentary succession at the coring location H3 (boreholes A and B) and a seismic window (SP 1270–1390) in the southern part near the alluvial fan of Hallstatt with ∼ 40 m penetration depth; the green arrow indicates bubble pulse reflection (25 ms). (b) Interpretation of profile shown in panel (a). Dark blue, yellow, red, and orange horizons mark the different intervals within E2 showing different facies of E2: the upper interval (between dark blue and yellow) representing the turbidite deposit, the interval below (between yellow and red) representing the upper part of the mass-transport deposit (MTD), and the interval below that (red to orange) representing the lower, coarser part of the MTD; the deeper MTD E3 is indicated as a semi-transparent unit below, with dashed, light blue as the top and dashed light purple as the potential bottom; the purple line ∼ 145 m b.l.l. indicates the potential double pulse. (c) Reflection seismic airgun profiles from west to east showing the upper ∼ 15 m of the sedimentary succession and bubble pulse reflection (25 ms) as indicated in panel (a). (d) Interpreted reflection seismic airgun profiles from west to east, as indicated in panel (b). Abbreviations: SU – seismic unit; TWT – two-way travel time.
3.2 Drilling campaign
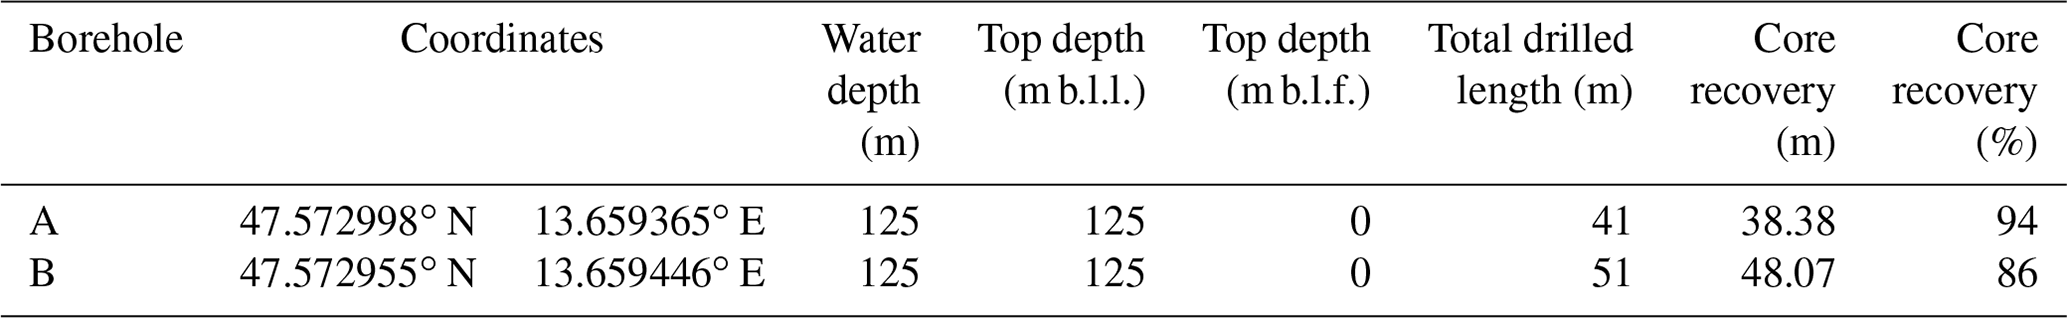
Drilling at the H3 site was carried out with the Hipercorig system at 125 m of water depth between April and June 2021 and operated by the UWITEC GmbH (Mondsee, Austria). The drilling platform is a combination of a hydraulic down-the-hole (DTH) hammer with an established UWITEC piston coring system. It is a very versatile mobile, modular barge system, with steel casings, a lake bottom ground plate, and other auxiliary equipment (Harms et al., 2020). Two holes with ∼ 8 m lateral offset (Table 1) were cored with a 1 m vertical offset, to allow a vertical overlap of both holes (core length: 2 m, core diameter: 90 mm). A total length of ∼ 91 m (hole A 40 m, hole B 51 m; Fig. 2) of sediment cores was retrieved.
Table 1Water depths and core recoveries for the Hipercorig Hallstatt History (H3) drilling project at Lake Hallstatt (Salzkammergut, Austria). Abbreviations: m b.l.l., meters below lake level (in spring 2021); m b.l.f., meters below lake floor. Drilling hole B is located around 7–8 m SE of hole A.
Sediment cores were curated on site with the mobile Drilling Information System (mDIS; Behrends et al., 2020), kept in ice-cooled Styrofoam boxes on the platform, and moved daily to a cool salt mine tunnel at ∼ 8 °C for temporary storage (1–4 d). The sediment cores were then transported to the University of Innsbruck, where they were kept at 4 °C.
3.3 Downhole logging
At the last day of on-site operations, while recovering the casing from hole B, downhole logging was conducted using the International Continental Scientific Drilling Program (ICDP) memory-logging system (iMLS), a modular “logging while tripping” (LWT) system, in online mode for wireline measurements (Kück et al., 2021). The data acquisition was performed in wireline mode; i.e., the sondes were operated on a regular logging cable and winch, with the data being read out in real time at the surface. This was possible because the otherwise autonomously measuring iMLS memory sondes can also be run with a special wireline telemetry (Kück et al., 2021; see more details in Sect. S1 in the Supplement). The memory sonde string did the following: (i) memory spectrum gamma ray (mSGR) (1.2 m long) measured profiles of both the total natural gamma ray (GR) and the concentrations of U, K, and Th from the spectrum of the natural gamma radiation, and, mounted below, (ii) memory magnetic susceptibility (mMS) (1.4 m long) measured magnetic susceptibility and temperature. Both sondes have a nominal vertical resolution of 0.2 m. The mMS position below the mSGR in the sonde string results in a magnetic susceptibility (MS) profile being 1.4 m longer than that of the mSGR data. Once inside the casing pipes the sonde was lowered towards the bottom of the piston corer until the mMS sonde stuck out of the corer and the mSGR sonde mounted above remained inside the pipes. The mSGR can measure through the metal of a casing, but the mMS can only be measured in the open hole.
For the actual logging, both the sonde string and the casing pipe were pulled up as synchronously as possible, so that the mMS sonde would stay below the pipe. The synchronization happened manually by the logging winch operator and the rig operator. Since it was the first time this was attempted, the two pulling speeds were not always perfectly matched but varied slightly, causing the mMS sonde to briefly slip into the housing three times and lose the mMS measurement there. This prevented a continuous profile of the magnetic susceptibility. Despite these gaps in the mMS profile, the profile itself is consistent in depth throughout and serves as a depth reference. The logging depth scale is in meters below lake level (m b.l.l.); i.e., the depth reference is the lake surface at the barge. The lake floor is visible in the GR profile as a steep slope over about 1 m (124–125 m b.l.l.). It does not appear as a sharp edge because the GR sensor first sees the decreasing radiation when getting closer to the water and then continues to sense gamma radiation from the underlying sediments slightly above the lake floor. Further, it can be assumed that the lake floor does not show a sharp sediment–water interface but that sediments, swirled up by the coring process, probably cover the lake floor.
3.4 Core opening, non-destructive analyses, and core description
The whole-round cores were scanned using X-ray computed tomography (CT) with a voxel size of 0.2 × 0.2 × 0.3 mm3 at the Medical University of Innsbruck (Austria) using a Siemens SOMATOM Definition AS. A Geotek Multi-Sensor Core Logger (MSCL) at the Austrian Core Facility (Department of Geology, University of Innsbruck) measured the whole-round cores with 0.5 cm resolution (bulk measurements: magnetic susceptibility, P-wave velocity, and γ density). After core splitting high optical images were obtained using a Smartcube Camera Image Scanner (SmartCIS; image scans of split core surface at 500 dpi resolution) and the COX Analytical Systems Itrax X-ray fluorescence core scanner (XRF-CS) (filtered and color-adjusted RGB images with up to ∼ 50 µm optical resolution; Croudace et al., 2006). Visual core description and sediment classification follow Schnurrenberger et al. (2003). The identification of event deposits is based on general concepts after Sabatier et al. (2022), using mainly sedimentary structures and thickness to distinguish major event deposits from background sedimentation, without further trigger interpretation. Here we indicate event deposits with a minimum thickness of 0.3 m and sequentially apply the numbering introduced by Lauterbach et al. (2023) at site HAS_2016-1.
3.5 Stratigraphic correlation
The first-order composite profile was created to establish a continuous sediment sequence. For the construction of a common depth scale (composite depth scale), visual tie points (identification of coeval, laterally continuous features) were established for both H3 drilling holes and the HAS_2016-1 composite core from Lauterbach et al. (2023). The visual tie points occur at different core depths below the lake floor (CLF-A) for each hole. The resulting core composite below the lake floor (CCLF-A) scale (meters composite depth – m c.d.) is based on the horizontal alignment of visual tie points and is equivalent to the old Ocean Drilling Program (ODP) and Integrated Ocean Drilling Program meters' composite depth scale (IODP depth scales terminology, 2023). Where coring gaps occur at correlative depths or correlation between holes is non-conclusive, the floating composite section below is appended to the overlying section above (see more details in Sect. S2 and S2.1 and Tables S1, S2, and S3 and Fig. S1 as well as Ortler, 2023, for the visualization of the MSCL data using 15-point rolling Gaussian smoothing).
3.6 Core–log correlation
The core–log correlation was established through the correlation of a smoothed MSCL MS dataset (centered mean rolling average of 40 data points to match the MS borehole logging resolution of 0.2 m) and the MS data of the borehole logging (see detailed description in Sect. S7). The borehole logging MS data (measured in hole B) represents the in situ stratigraphy and was used to anchor the MSCL MS dataset, which was adjusted visually based on specific MS peaks and intervals of both datasets (see tie point table in Table S7). This allows us to better understand intervals of potential missing sediments (core gaps) and compaction/extension within our composite core.
3.7 Radiocarbon dating and age–depth modeling
From the two H3 cores 24 accelerator mass spectrometry (AMS) radiocarbon (14C) dates were performed on determined macro-remains from terrestrial plants below 18 m c.d. extracted by wet sieving of lake sediment samples using a mesh size of > 125 µm (Table 2). Small twigs from trees and shrubs were determined to taxon/species level by Werner H. Schoch (Laboratory for Ancient Wood Research, Switzerland) prior to dating. Core catcher samples were dated for an early age estimation directly after sediment coring but without detailed documentation.
Table 2AMS radiocarbon (14C) dates were performed on macro-remains from terrestrial plants extracted from the sediments of Lake Hallstatt (Salzkammergut, Austria). All data were calibrated at ETH Zürich with OxCal 4.4.4 (Bronk Ramsey, 2009) and the atmospheric calibration curve IntCal20 (Reimer et al., 2020). CC represents core catcher material, which was pushed into mini cores up to 15 cm in length. Dates in italics are from event layers (omitted 14C dates; see Fig. 4). Abbreviations: B – bark; BS – bud scale; CC – core catcher samples; ETH – Eidgenössische Technische Hochschule (Switzerland); FL – foliage leaf; L – leaf; Misp – microsporophyl; N – needle; n.d. – not determined; n.m. – not measured; P – part; Pe – periderm; SS – short shoot; St – stem; T – twig.
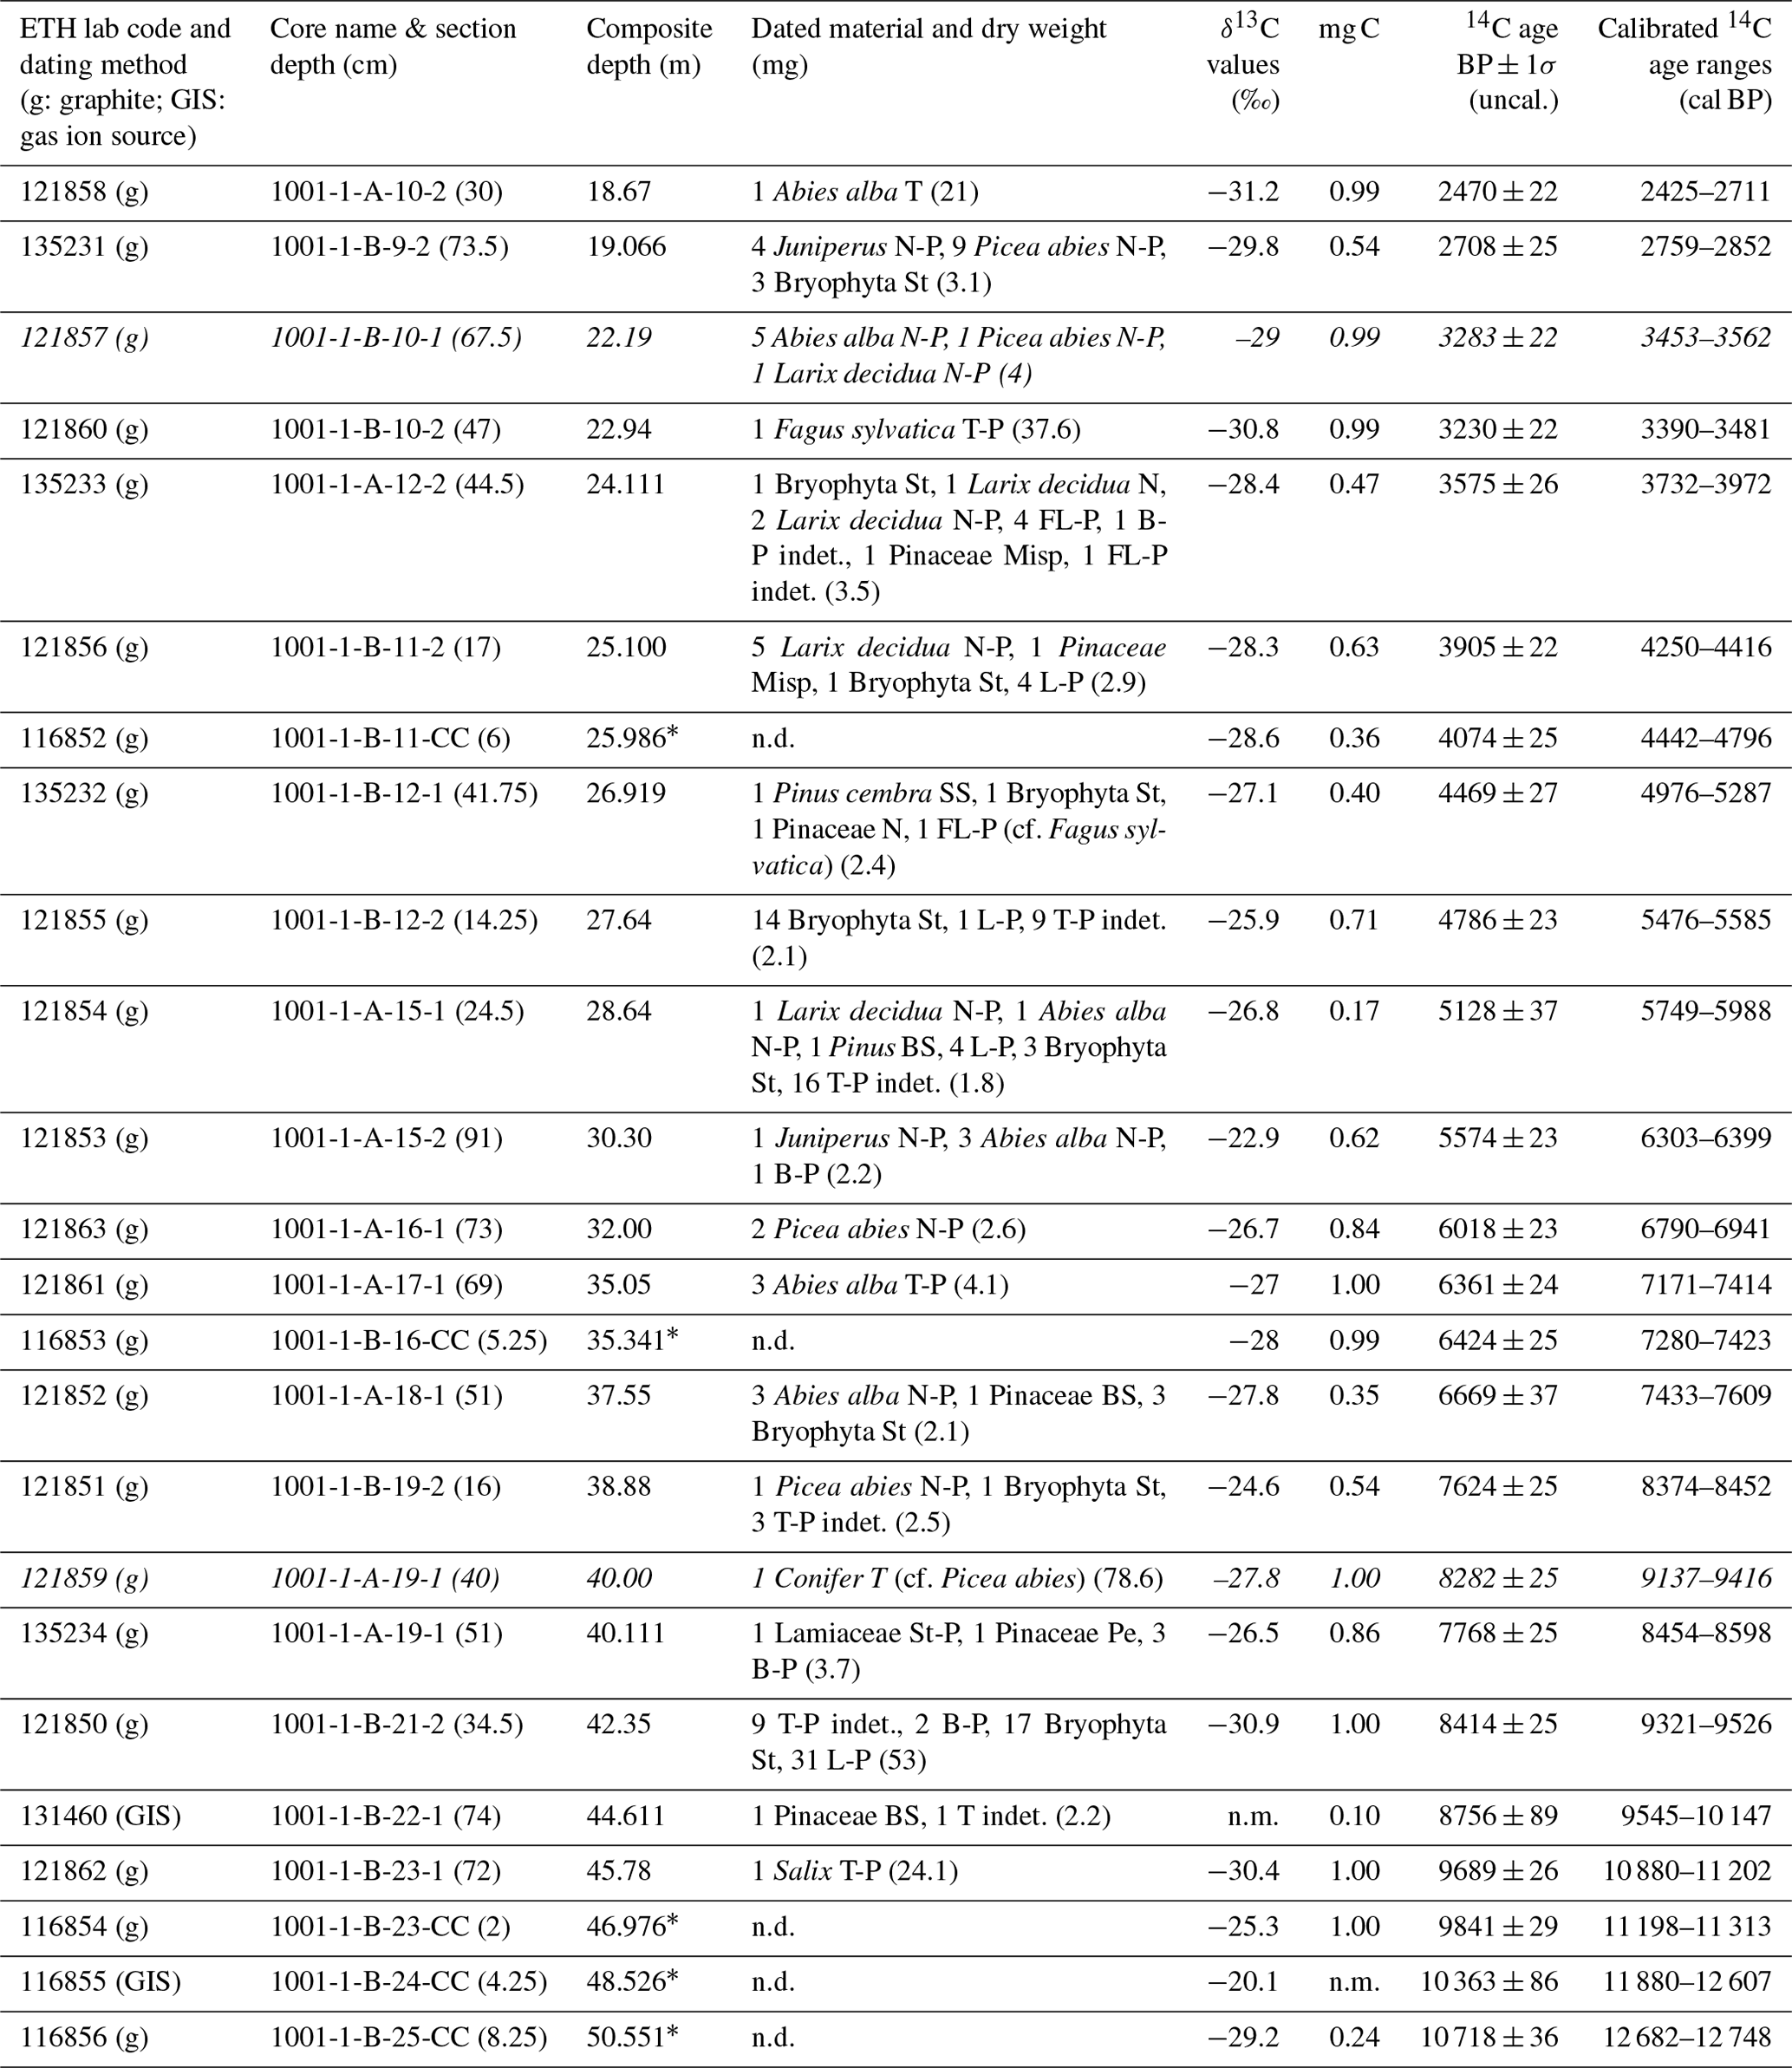
∗ Core catcher samples were projected to the corresponding depth, if possible; otherwise, they were set at the bottom of the corresponding core section.
Radiocarbon measurements were done at the Ion Beam Physics Laboratory of ETH Zürich, Switzerland, using the dedicated MICADAS system (Synal et al., 2007). Carbonates and humic acids were removed using an acid and base treatment as described by Hajdas (2008) in order to avoid potential contaminations. Single radiocarbon ages were calculated according to Stuiver and Polach (1977), were than calibrated with OxCal 4.4.4 (Bronk Ramsey, 2009), and were thereafter transformed into calibrated years BP (before present: before 1950 CE) according to the calibration curve IntCal20 (Reimer et al., 2020). The Bacon v3.0.0 software package for R (Blaauw and Christen, 2011) was used for Bayesian age–depth modeling; however, two radiocarbon dates (ETH-121857 and ETH-121859; see Table 2) were excluded from the age–depth model, as they were sampled within the base of event deposits (see Sect. S6 and respective Fig. S2 for more details). Furthermore, 17 radiocarbon dates from the HAS_2016-1 sediment core (Lauterbach et al., 2023) were included into the total age–depth model by projecting them onto the H3 composite core profile using tie points (see Table S5) to cover the upper 15 m of the stratigraphy.
4.1 Seismic airgun units
The seismic airgun data show a seismic stratigraphy with three distinct seismic units (SUs) characterized by five different seismic facies (F1–F5, Table S4) at the coring site (Fig. 2): SU1 is a ∼ 12 m thick acoustically laminated, high-amplitude reflection package (F1) with limited lateral continuity. On the whole basin scale, SU1 also comprises several zones at different stratigraphic levels with a few meter-thick, semi-transparent, and non-continuous reflections (F2) with variable amplitudes and hummocky to deformed geometries (e.g., shot points (SPs) 1260–1370, 1420–1550, and 1750–1990 in Fig. 2a and b; 3270–3290, 3235–3250, and 3190–3225 in Fig. 2c and d). At the HAS_2016-1 site, the SU1-to-SU2 boundary corresponds to the base of E2 (Fig. 2b). SU2 shows more diffuse low-amplitude reflections (F3) above the 25 ms−1 TWT level dominated by a bubble pulse (green arrows in Fig. 2), with higher amplitudes towards the top of the unit. In the south of the N–S seismic profile, SU2 shows northward-dipping reflections with moderate amplitudes (F4) and moderate lateral continuity, occasionally interlayered with chaotic facies. The seismic signal penetration to greater depth is generally limited by seismic attenuation, related to MTD bodies (as described in core HAS_2016-1 (Lauterbach et al., 2023) and the following sections) and free gas in the pore space of the sediment causing acoustic blanking. A ∼ 250 m wide “seismic window” near the Hallstatt fan (SP 1270–1390 in Fig. 2a, b) images the deeper subsurface (SU3, down to ∼ 40 m b.l.f.) with northward-inclined medium-amplitude reflections (F5) with low lateral continuity (Fig. 2a, b).
4.2 Borehole logging units
Nine logging units were defined based on the downhole logging measurements collected in hole H3 B (Fig. 3). Logging Unit 1 (LU1, 124–131 m b.l.l.) is characterized by intermediate GR values of 55.1 ± 2.9 gAPI and a downhole-decreasing trend in MS (with overall low values of 0.9 ± 0.1 × 10⁻⁴ SI – Système International – on average). The turning point with the lowest MS value, after the decreasing trend, defines the boundary to Logging Unit 2 (LU2). LU2 (131–135.6 m b.l.l.) shows on average low MS values of 0.8 ± 0.1 × 10⁻⁴ SI and very low GR values of 39.2 ± 5.6 gAPI and consist first of an interval of low MS and GR values until 135.2 m b.l.l. followed by a sharp increase, up to a peak in MS value of 1.52 × 10⁻⁴ SI, indicating the transition to Logging Unit 3 (LU3). LU3 (135.6–139.5 m b.l.l.) consists of increased MS values of 1.1 ± 0.1 × 10⁻⁴ SI and stable GR values of 60.3 ± 3.7 gAPI encircled by high GR values at the top. The transition to Logging Unit 4 (LU4) is defined as the turning point towards low GR value, with a peak in K and a low in MS values. LU4 (139.5–140.9 m b.l.l.) shows a thin layer with low GR values centered around a minimum value of 37.2 gAPI with intermediate MS values (1.1 ± 0.1 × 10⁻⁴ SI on average). The increase in GR value at the bottom of the thin layer, as well as the low MS value indicate the transition to Logging Unit 5. LU5 (140.9–145 m b.l.l.) comprises high GR values (74 ± 7.9 gAPI on average) with two prominent thin layers with GR values of up to 85.4 gAPI and an MS trough in between. Overall, LU5 includes spikey and high MS values with an average of 1.3 ± 0.2 × 10⁻⁴ SI. The transition to Logging Unit 6 is indicated with the transition towards lower GR values and a peak in MS values. LU6 (145–149.9 m b.l.l.) comprises high GR values (64 ± 5.9 gAPI on average) with one prominent thin layer of increased GR values of up to 73.6 gAPI. The MS values show intermediate values of 1.1 ± 0.1 × 10⁻⁴ SI on average. The transition to Logging Unit 7 is indicated with the transition towards increased GR values and a low in K and MS values. LU7 (149.9–157.3 m b.l.l.) also indicates enhanced MS values of 1.3 ± 0.2 × 10⁻⁴ SI (based on the 149.9–151.6 m b.l.l.) as well as a peak-shaped evolution of high GR values (on average of 68 ± 8.5 gAPI). The transition point to Logging Unit 8 (LU8) is defined after the GR trough of 49.62 gAPI, towards more stable GR values. LU8 (157.3–165.8 m b.l.l.) shows very stable and intermediate GR values of 56.46 ± 1.9 gAPI and lower and spikey MS values of 1 ± 0.1 × 10⁻⁴ SI. The transition to Logging Unit 9 (LU9) is the lowest MS value before the onset of an increasing trend of MS and GR values. LU9 (165.8–173.2 m b.l.l.) shows increased GR values of 66.3 ± 3.3 gAPI and increased MS values of 1.2 ± 0.1 × 10⁻⁴ SI.
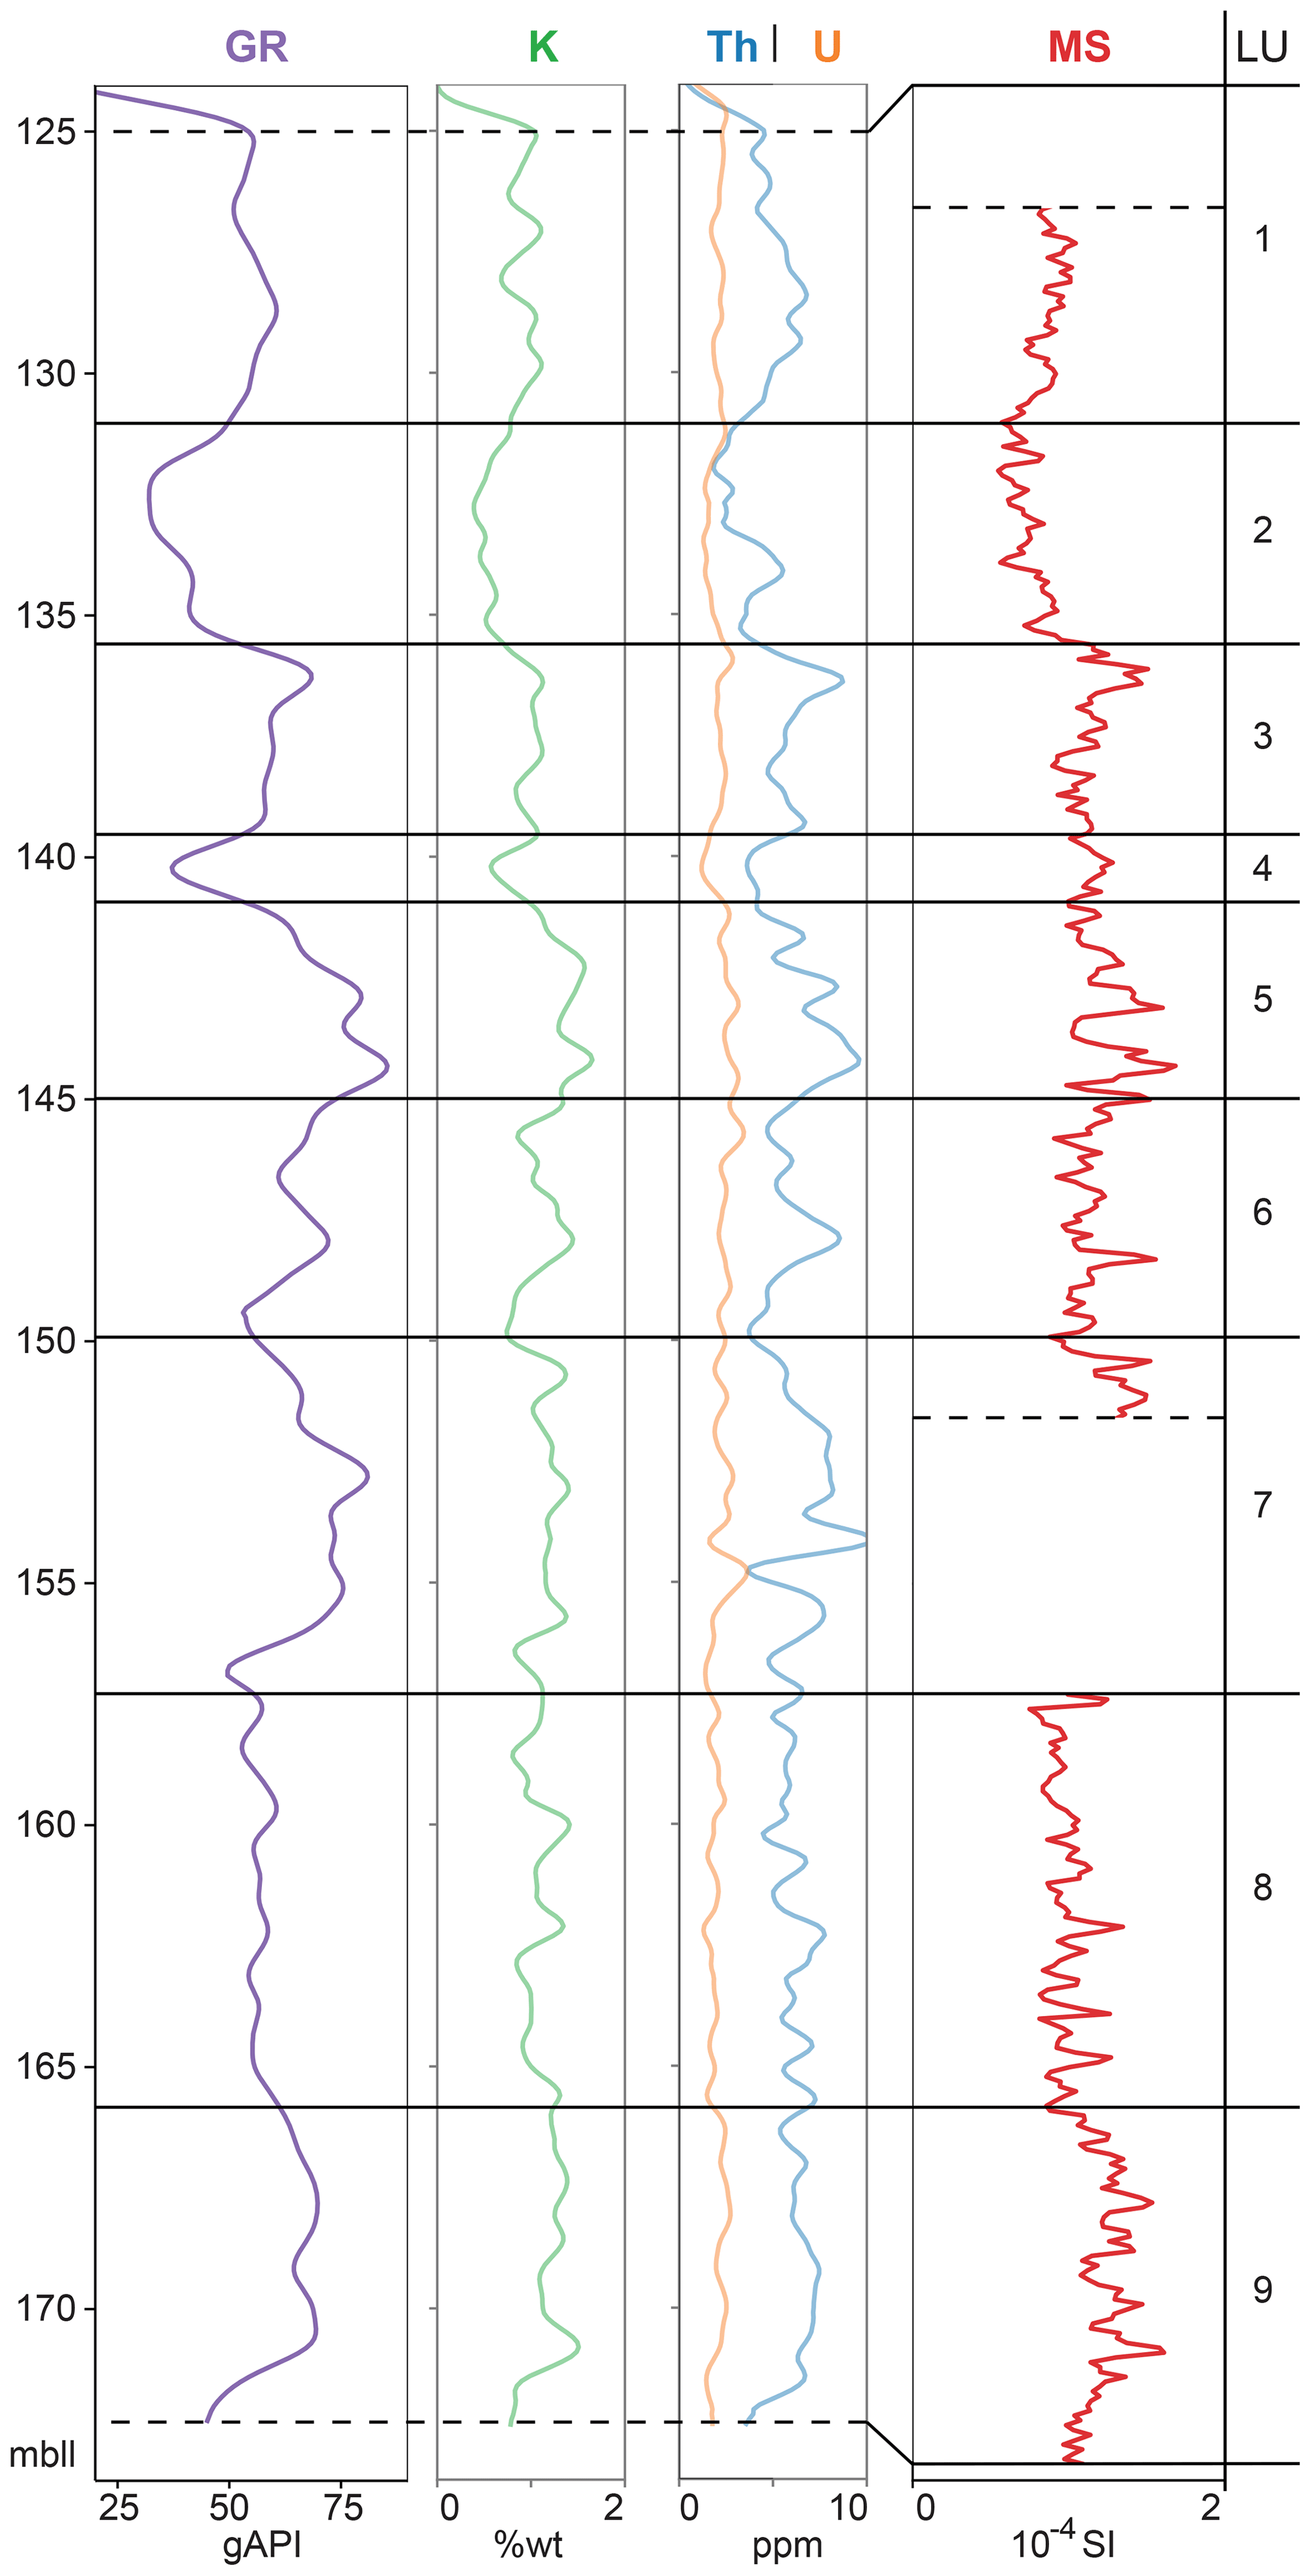
Figure 3Borehole logging for the sediments of Lake Hallstatt (Salzkammergut, Austria) with natural gamma radiation (GR); magnetic susceptibility (MS); and U, K, and Th concentrations. The numbers 1–9 represent the identified borehole logging units (LUs). The sections with no MS data in interval 1 and interval 7 were discarded (measurement inside metal casing).
4.3 Lithostratigraphic units
The sedimentary succession comprises two major lithostratigraphic units: Unit 1 (Holocene, with six subunits) and Unit 2 (Late Pleistocene). The sediments are mainly composed of carbonate mud, interbedded with multiple millimeter- to centimeter-thick light-gray clayey-silt graded deposits (further referred to as turbidites as interpreted and used by Lauterbach et al., 2023, and Strasser et al., 2020). Furthermore multiple > 0.3 m thick deposits occur with a graded, coarser-base, homogenous body and clay cap overlying cohesive mixed sedimentary layers interpreted as co-genetic turbidites (cf. Lauterbach et al., 2023) and mass-transport deposits (MTDs). The labeled events differentiated by visual changes in color, grain size, lamination thickness, structure, and MSCL data (γ density and magnetic susceptibility; see Figs. 4 and 5, Table S6, and Sect. S3). The presented ages are derived from the age–depth model, using precise radiocarbon dates performed on plant remains (see Sect. 3.7).
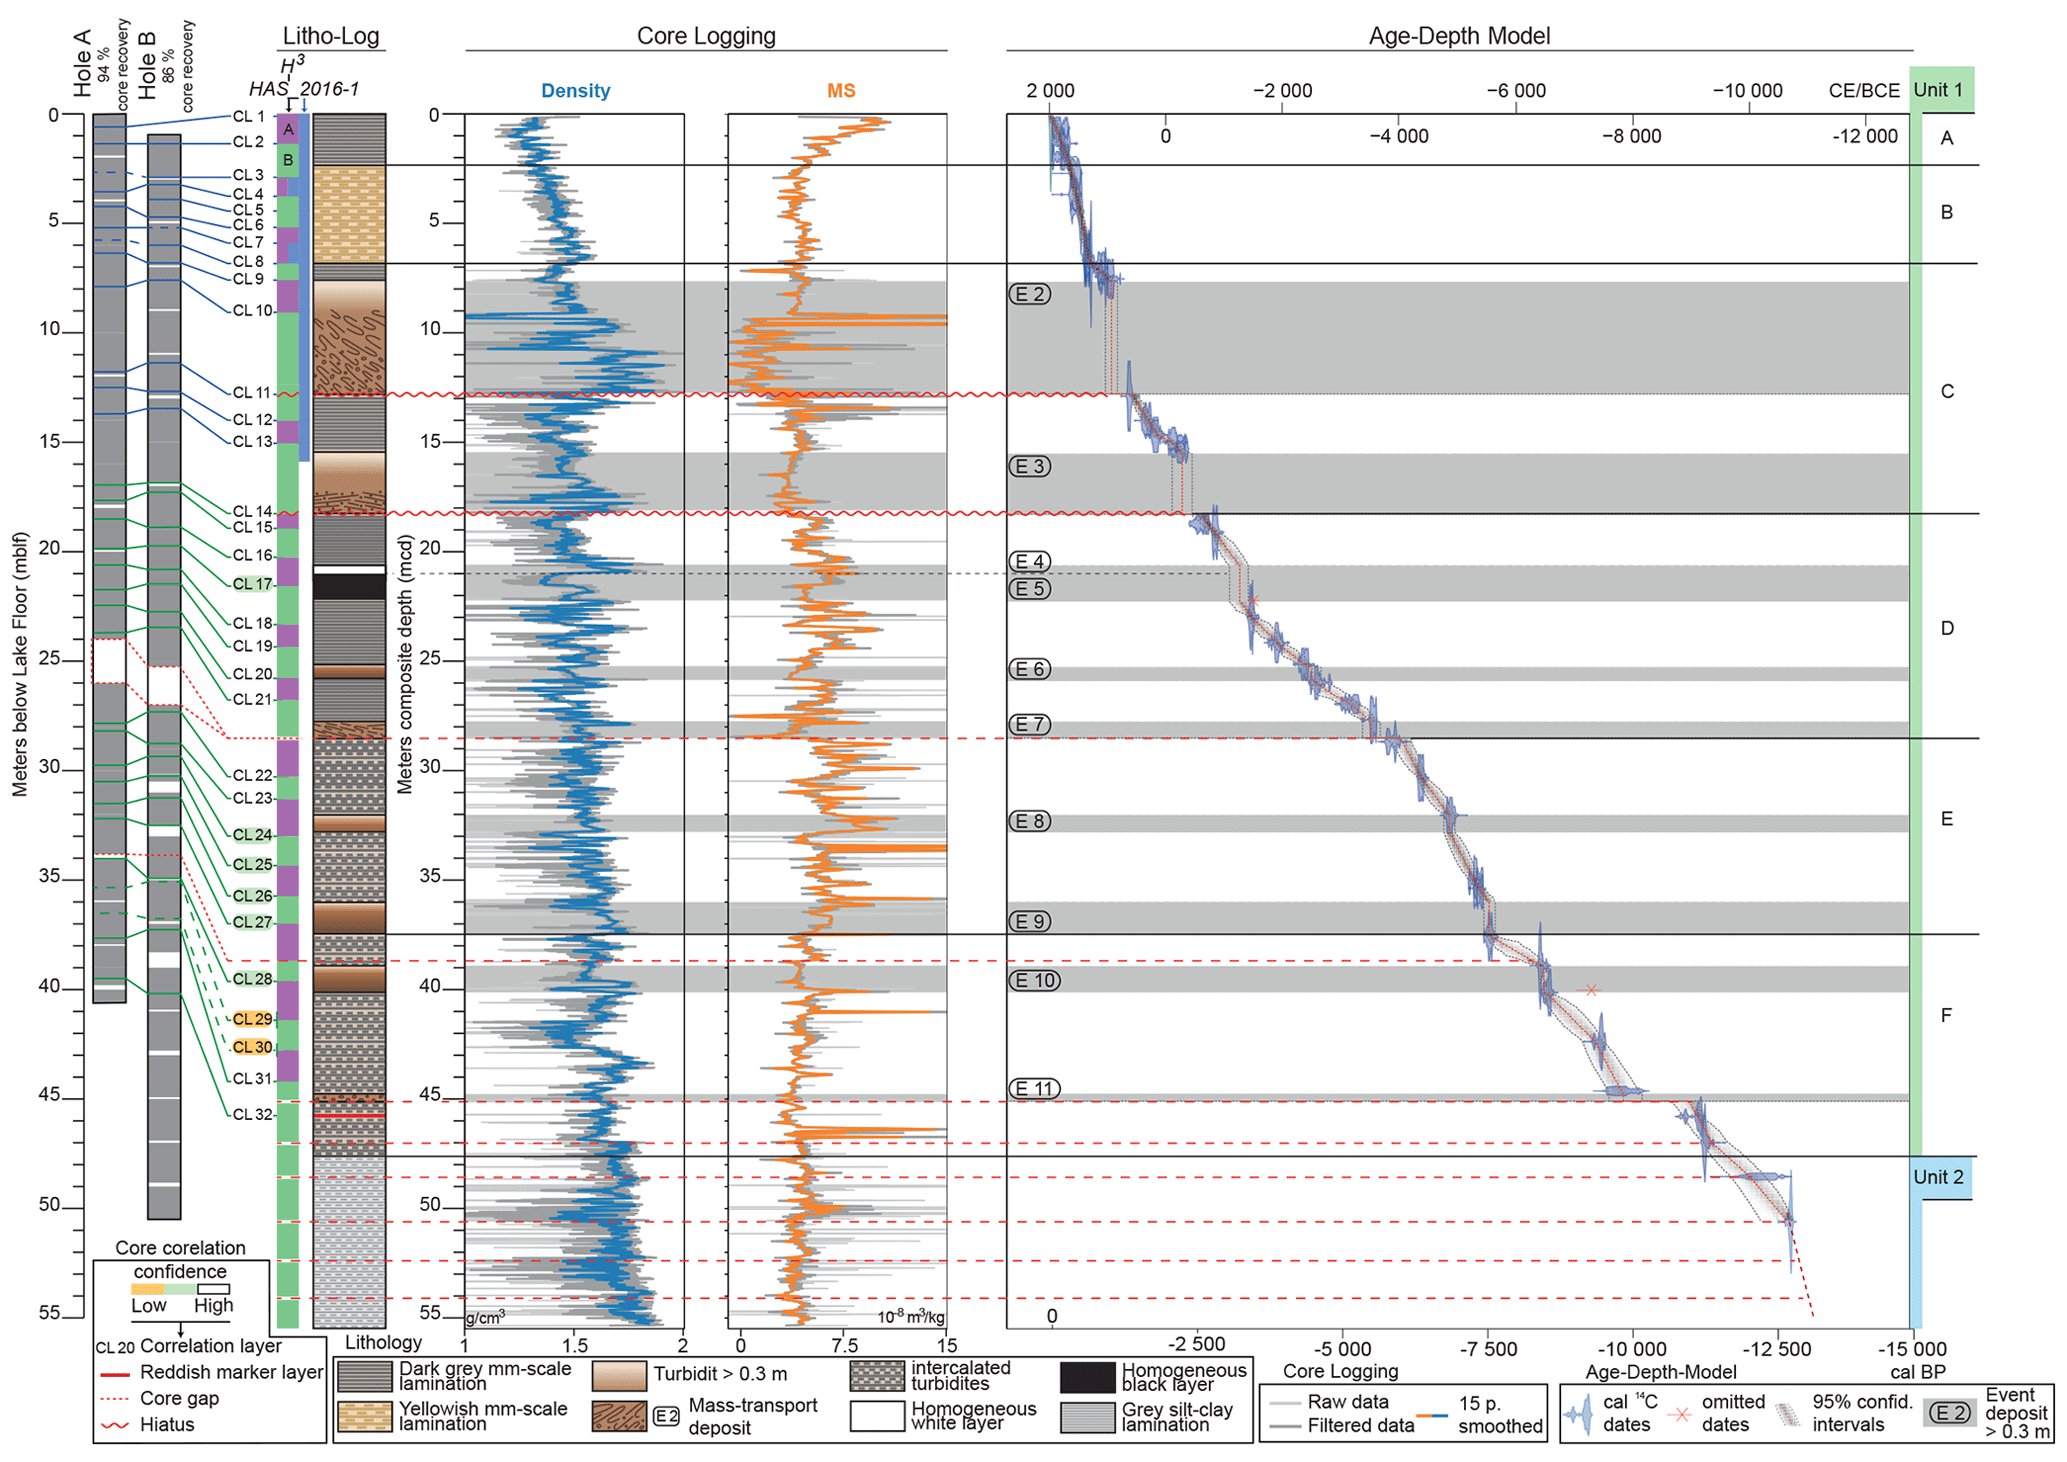
Figure 4Composite profile overview for the sediments of Lake Hallstatt (Salzkammergut, Austria). From left to right: core recovery of both boreholes and correlation lines (blue: correlation with HAS_2016-1 core possible; green: correlation possible only between the H3 cores A and B). Composite profile of the borehole used (indicated in green and purple). Simplified lithology log for the composite profile (with eight major lithology types, including event deposits). Whole-round measured density. Magnetic susceptibility. Age–depth model based on 35 radiocarbon (14C) dates, with the two 14C dates shown in red omitted. Identified lithological units for the Late Pleistocene (blue) and Holocene (green).
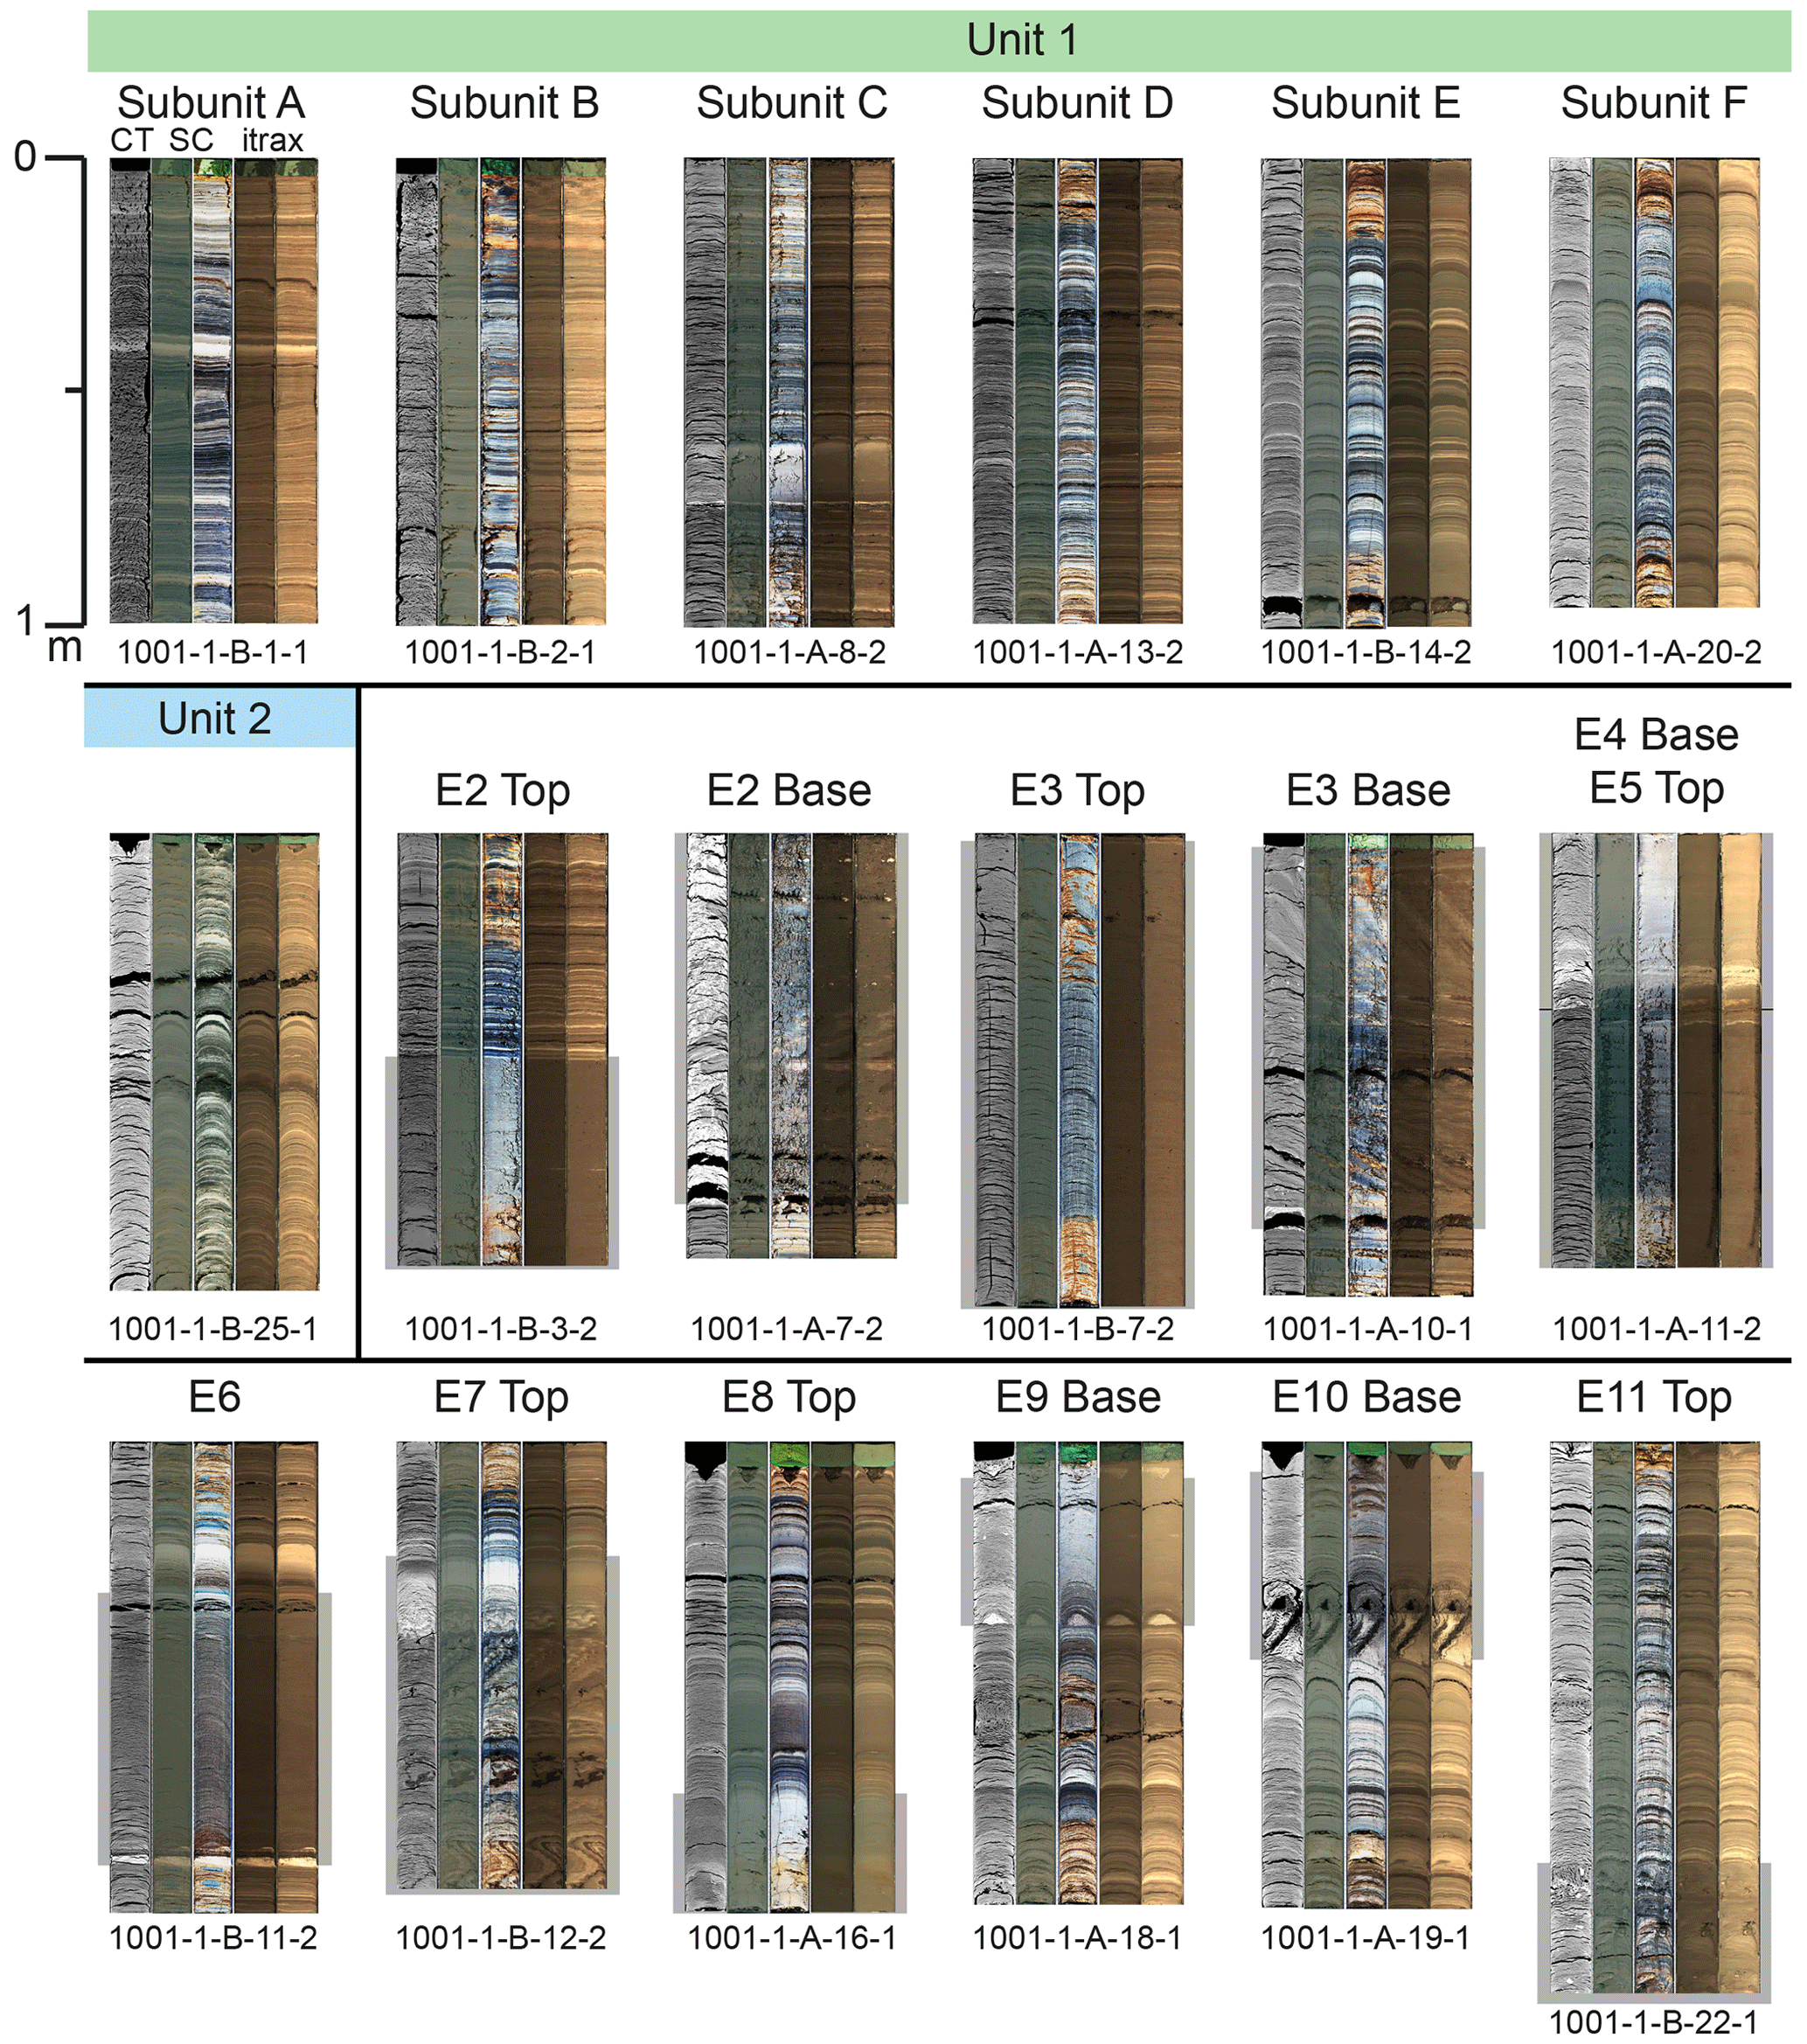
Figure 5Compilation of drilling core images, for each lithological unit (including subunits) of Lake Hallstatt (Salzkammergut, Austria). Each photographic assemblage shows a computer tomography (CT) image (black less dense, white denser), a smart cube image, a smart cube color-adjusted image, and two ITRAX images (with different light intensities). In addition, a representative core section is shown for each major event deposit (> 0.3 m).
Unit 1 – Holocene, 0–47.60 m c.d. (present day to 11 623 ± 150 cal BP)
Subunit A (0–2.36 m composite depth (m c.d.); bottom: 304 ± 28 cal BP) consists of laminated to very thin bedded dark-gray clayey–silty carbonate mud, interbedded with millimeter- to centimeter-thick graded turbidites. It shows very low mean density values of ∼ 1.30 g cm−3 and a drastic increase in magnetic susceptibility up to 10.57 × 10⁻⁸ m3 kg−1. The transition phase (∼ 5 cm, 2.4–2.45 m c.d.) to subunit B is a striking color change toward yellowish as well as to lower MS values (∼ 3.95 × 10⁻⁸ m3 kg−1) and higher-density values (Fig. 4). E1, mainly present close to the Hallstatt alluvial fan (Lauterbach et al., 2023), within subunit A is not indicated, as it shows < 0.3 m thickness at the deep basin. A slight nick point within the age–depth model indicates a slight decrease in sedimentation rate for subunit A compared to subunit B.
Subunit B (2.36–6.87 m c.d.; bottom: 711 ± 34 cal BP) is a prominent yellowish-gray clastic carbonate mud interval of ∼ 4.5 m (2.4–6.87 m c.d.) with faintly millimeter- to centimeter-scale laminated sediments (Fig. 5). This sequence shows a slightly enhanced mean density value of 1.43 g cm−3 compared to the two adjacent subunits A and C and a decreasing trend towards subunit A. The transition phase of subunit B to subunit C (6.76–6.87 m c.d.) is a striking color change from more yellowish to blackish, gray colors, a drop in density values and MS values, and a decrease in sedimentation rate within subunit C. The sedimentation rates of subunits B and A show the highest sedimentation rates.
Subunit C (6.87–18.23 m c.d.; bottom: 2239 ± 82 ka cal BP) consist of laminated to very thin bedded dark-gray clayey–silty carbonate mud (very similar to subunit A), interbedded with millimeter- to centimeter-thick graded turbidites. The background sedimentation shows a mean density of 1.44 g cm−3 and mean MS of 4.1 × 10⁻⁸ m3 kg−1 with the highest values below E2 (10.85 × 10⁻⁸ m3 kg−1). Subunit C comprises two major mass-transport deposits (E2: ∼ 5.1 m thick; E3: ∼ 2.7 m thick; see Table S6) forming respective MTDs containing pebbles (up to 3 cm in diameter) and related co-genetic turbidites. E2 shows a distinct bipartite structure in both holes (A and B) which is separated by a sandy organic-rich interval (9.12–9.42 m c.d.). The basal part (9.42–12.74 m c.d.) shows a chaotic mixture at the bottom of a mainly sandy matrix with pebbles which transitions to a sandy matrix with pebbles and mud clasts, with partly intact laminations or vertical laminations and soft sediment deformation and sand package. The overlying interval shows amalgamated sandy deposits with macro remains, with decreasing thickness towards the overlying turbidite (7.64–9.12 m c.d.), which has a distinct homogenous structure with a very thin mud cap (< 0.5 cm). In comparison to the HAS_2016-1 core (Lauterbach et al., 2023), we observe a much coarser grain size and less deformation structures within the basal part of E2. The base of E2 shows erosional features and missing laminations compared to the HAS_2016-1 core, suggesting a hiatus of ∼ 150–550 years based on the age–depth model (Fig. 4). Event 3 (E3) also shows a bipartite structure with a basal part and an overlying turbidite. The basal part varies strongly between holes A and B within the individual parallel core segments, demonstrating a high spatial heterogeneity of the event deposit. Hole A shows a small (∼ 1 cm) sandy base overlain by subvertical laminations and folded laminas (∼ 80 cm), which is followed by the turbidite (> 1.9 m), a homogenous package. The base of the turbidite was not retrieved in hole A. In hole B, the basal part (∼ 45 cm, 17.76–18.23 m c.d.) consists of a sandy matrix with some pebbles mud clasts, with the very bottom part not being retrieved. The top part of the basal part comprises an amalgamated organic-rich interval (∼ 45 cm, 17.30–17.76 m c.d.) with centimeter-thick sandy intersections towards the turbidite. The turbidite is a ∼ 1.8 m thick homogenous package with a thin (< 0.5 cm) mud cap. The background sedimentation rate between E2 and E3 indicates a slight increase in sedimentation after E3 and an increasing trend towards E2. Also, the transition to subunit D at the base of E3 (18.23 m c.d.) likely shows a hiatus of up to ∼ 600 years based on the age–depth model.
Subunit D (18.23–28.47 m c.d.; bottom: 5544 ± 93 ka cal BP) is similar in appearance to subunit C with increased mean density values of 1.48 g cm−3 and MS values of 5.50 × 10⁻⁸ m3 kg−1. It is intercalated with four homogenous packages (E4, E5, E6, and E7; see Table S6 for depth). E4 and E5 appear to be a stacked event sequence, with an interval of ∼ 2.5 cm in between the deposits which need to be further investigated. E4 is a light-gray, homogenous package, with a sandy base. E5 is black (directly after core opening) and homogenous with a ∼ 1 cm thick organic-rich layer and a sandy base (< 0.5 cm). E6 is a ∼ 60 cm thick, medium-gray, homogenous package with a ∼ 2 cm thick sandy base and a thin (< 0.5 cm) mud cap. Furthermore, the top part of an MTD (E7: min. 0.7 m thick, base not cored) is present at the bottom of subunit D with a ∼ 14 cm thick light-gray mud sequence and sandy intersections, which are deformed at the lower part of the sequence.
Subunit E (28.47–37.43 m c.d.; bottom: 7525 ± 51 cal BP) indicates an overall change within the Holocene unit to laminated dark-gray clayey–silty carbonate mud interbedded with thicker (millimeter- to centimeter-thick) graded turbidites and two > 0.3 m thick turbidites. The transition occurs likely within the coring gap of ∼ 1 m, and based on the age–depth model ∼ 100–800 years could be missing. The mean density value is 1.55 g cm−3 and the mean MS value is 6.5 × 10⁻⁸ m3 kg−1. This shows an increase for both parameters compared to the overlain subunit D. The magnetic susceptibility shows overall the highest values of the composite core and the highest individual MS peaks (23.59 × 10⁻⁸ m3 kg−1) of background sedimentation. Additionally, E8 (∼ 74 cm, 32.02–32.76 m c.d.) represents a homogenous, medium-gray to light-gray (∼ 25 cm of the top) mud, with no prominent coarse base. E9 (∼ 1.44 cm, 36–37.44 m c.d.) shows a similar appearance, with a medium-gray, homogenous body and a light-gray upper part (∼ 50 cm) and a 2 cm thick sandy lens as a base.
Subunit F (37.43–47.60 m c.d.; bottom: 11 623 ± 150 cal BP) is a laminated dark-gray clayey–silty carbonate mud interbedded with millimeter- to centimeter-thick graded turbidites similar to subunit E. The mean density value is 1.61 g cm−3 and the mean MS value is 4.53 × 10⁻⁸ m3 kg−1. The lowest density values of ∼ 1.3 g cm−3 are ∼ 43 m c.d. with slightly more blackish sediments compared to the adjacent sediments. E10 (∼ 1.14 m, 38.9–40 m c.d.) consist of medium-gray, silty carbonate mud with dark patches and a striking, folded organic-rich, sandy base. At ∼ 45 m c.d. E11 occurs (min. 31 cm, 44.76–45.1 m c.d.) and consists of deformed laminations of carbonate mud with chaotically distributed multiple grains (> 0.5 cm) and one layer grains (up to 0.5 cm) in the upper part of E11. In addition, a distinct increase in the density baseline is present at ∼ 47 m c.d. to > 1.69 g cm−3.
Unit 2 – Late Pleistocene, ∼ 47.60–55.3 m c.d. (top: 11 623 ± 150 cal BP; bottom: older than 12 682–12 748 cal BP; 50.5 m c.d.)
Unit 2 consists of a Late Pleistocene sedimentary succession comprising laminated very thin bedded (1–3 cm) medium-gray silty–clayey carbonate mud, with several laminated (< 1 cm) intervals and multiple-centimeter-thick light-gray and graded turbidites. Within Unit 2 there are three intervals observable: (i) a mainly finely laminated (< 1 cm) carbonate mud (∼ 47.60–∼ 50.5 m c.d.) with increased MS values of ∼ 4.63 × 10⁻⁸ m3 kg−1, with the deepest sampled age at the base with 12 682–12 748 cal BP; (ii) a darker colored interval (∼ 50–∼ 54 m c.d.) with a slightly lower magnetic susceptibility (∼ 3.94 × 10⁻⁸ m3 kg−1); and (iii) increased density values below ∼ 54 m c.d. with ∼ 1.75 g cm−3.
5.1 Core–log (seismic) integration
The integration of seismic airgun, borehole logging, and sediment core data confirms that the boundary between seismic units SU1–SU2 corresponds to the base of the E2 MTD at both the H3 site and the HAS_2016-1 site (Figs. 2b, d, and 6), across which a downhole increasing MS trend is observed in both the borehole and core logging data (see detailed description of MS-based borehole logging to core logging data correlation in Sect. S7 and Table S7). Hence, the logging unit LU1 corresponds to subunits A and B and to the upper part of SU1. The high-amplitude reflection at ∼ 0.197 s TWT depth likely originates from the sharp density contrast at the transition from subunit B to C, which also generally shows increased GR (gamma radiation) values for B and a decrease in GR towards C. The lower part of SU1 at the correlative depth of E2 shows a disrupted-reflection pattern, which can be interpreted as thrusts and ramp features (e.g., Sammartini et al., 2019) within the MTD bodies that thin out towards the deep basin (Fig. 2b). The bipartite nature of E2 (as described in the core data with a turbidite overlying the MTD) is also observed in LU2 with the upper part showing low GR values and transitioning to comparably higher GR values at the base. This is also apparent in the seismic data by a ponding deposit overlying the top of the MTD (thick, solid yellow line in Fig. 2b). The base of E2 at the H3 site contains rip-up mud clasts and is coarser than at the HAS_2016-1 site. The basal part of E2 at the HAS_2016-1 site shows plastic deformation (Lauterbach et al., 2023), indicative of basin plane deformation (e.g., Sammartini et al., 2019).
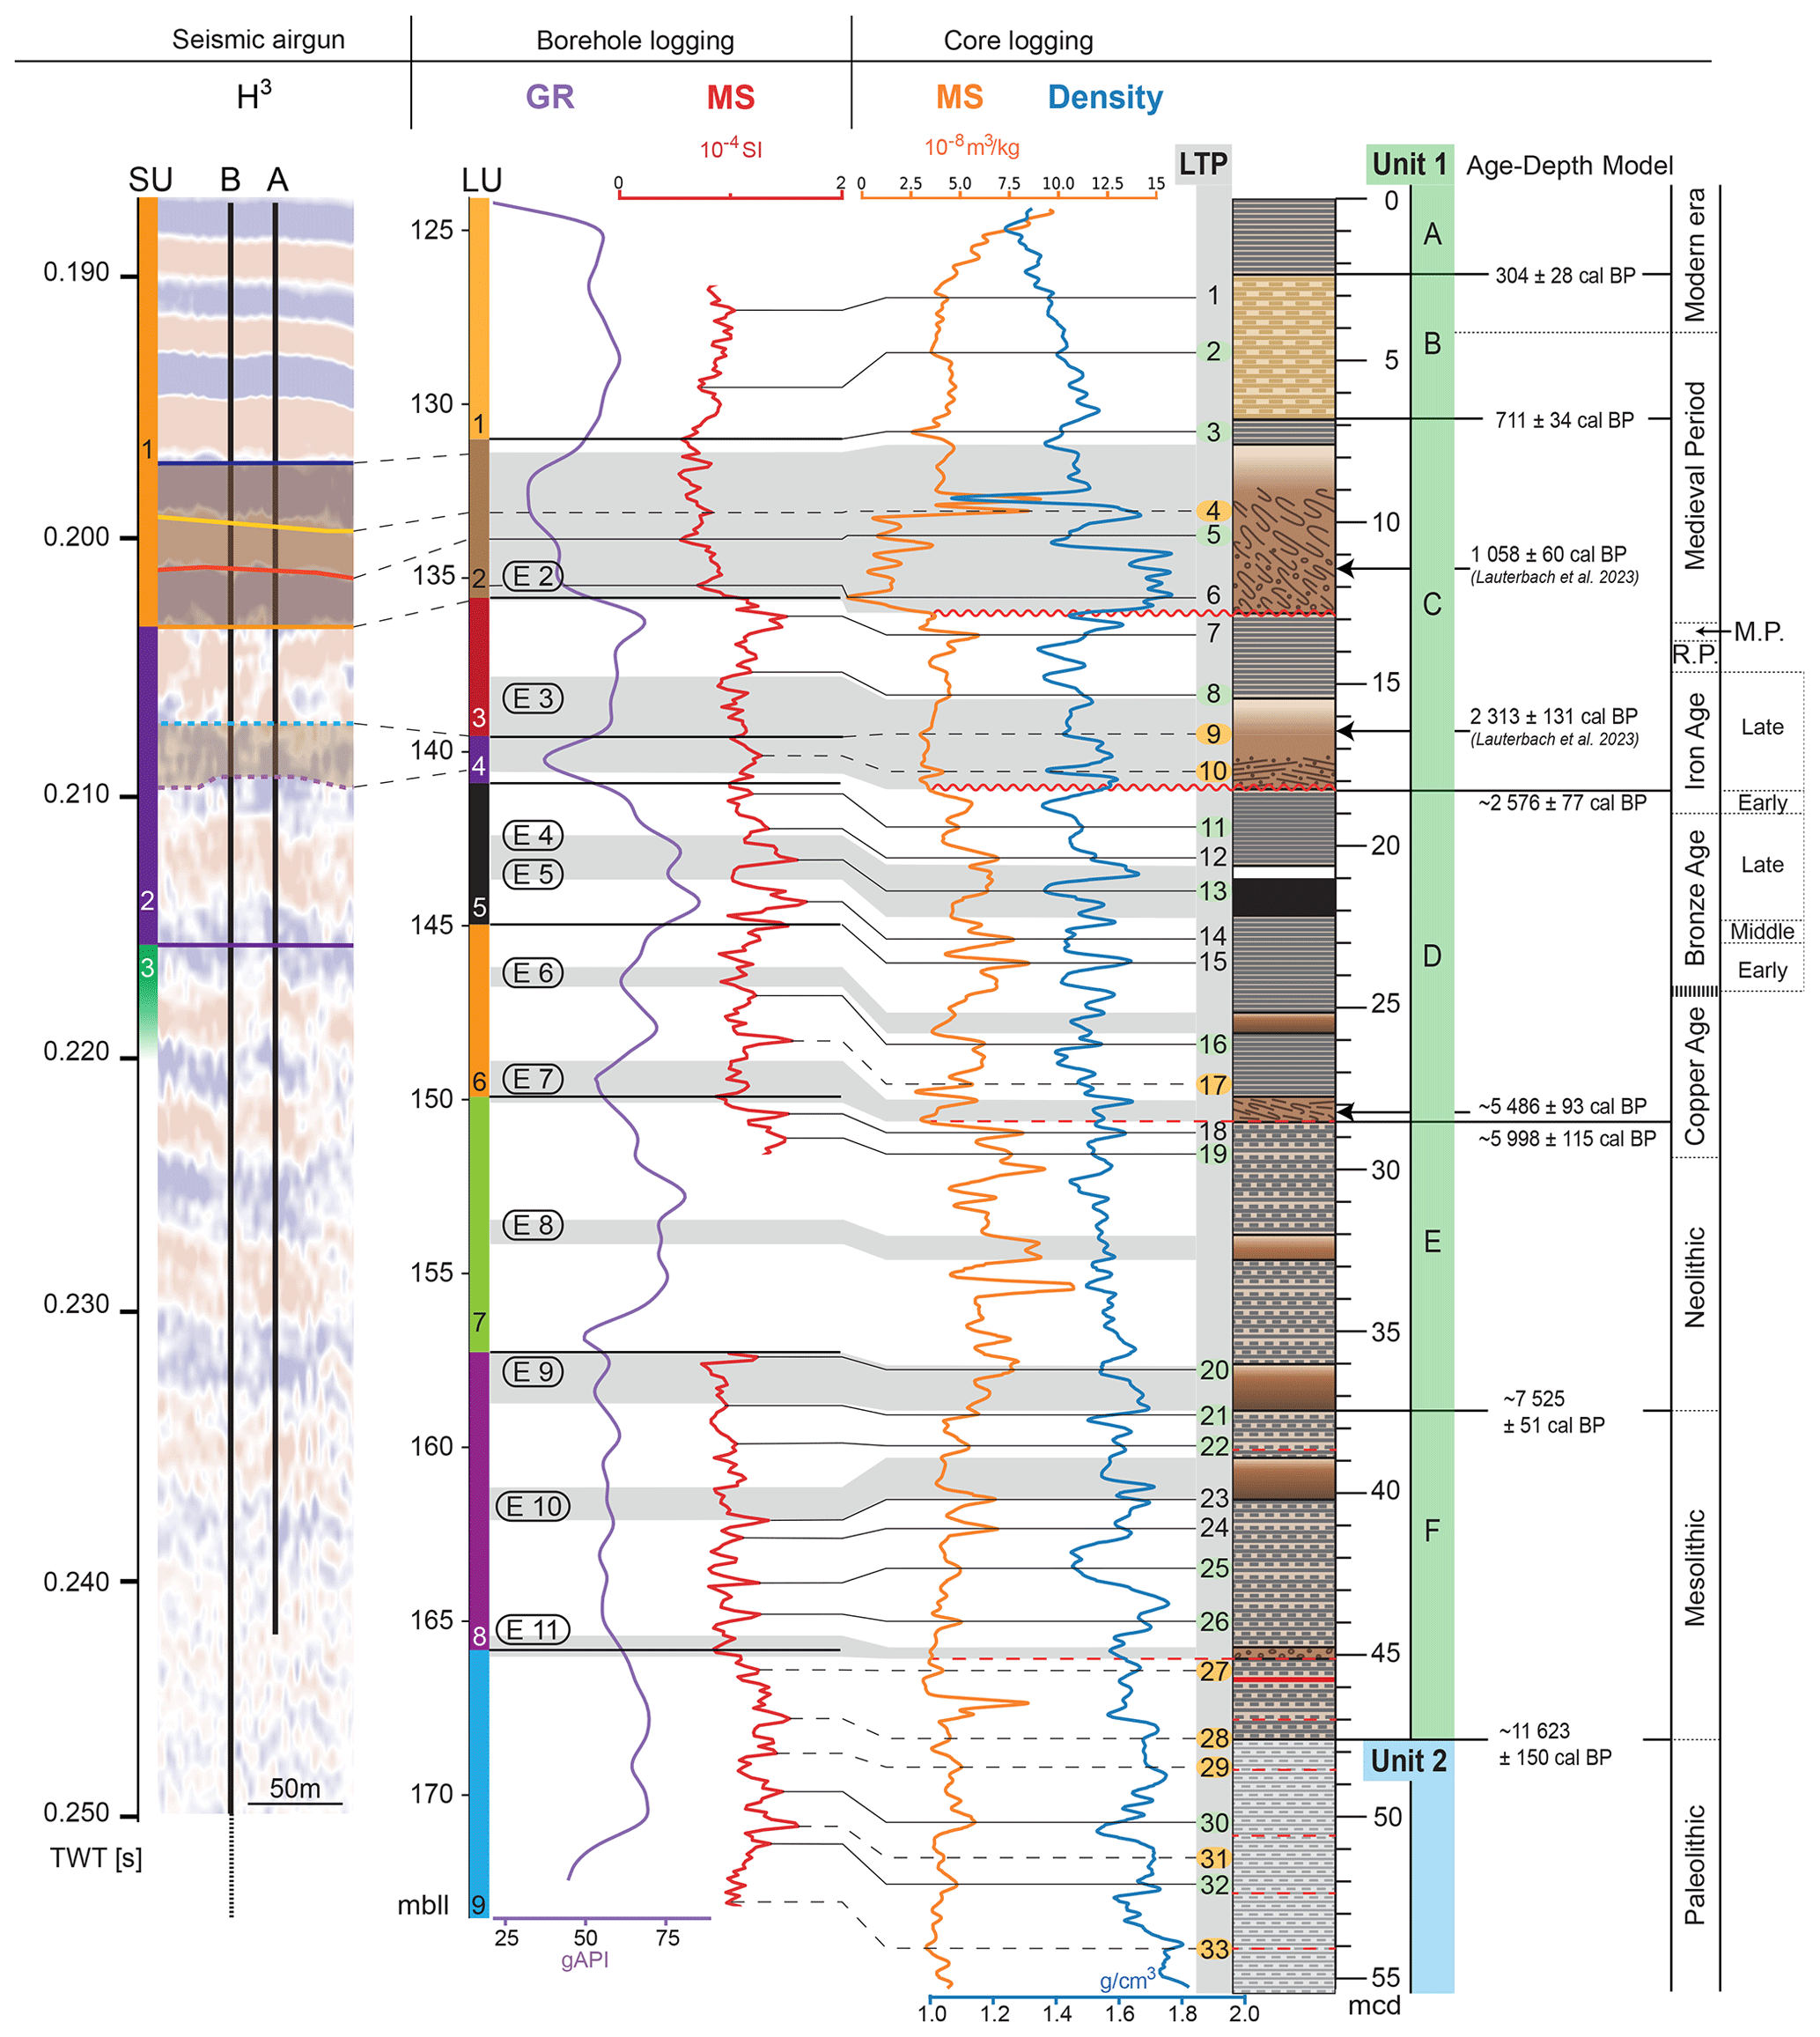
Figure 6Core–log seismic integration of Lake Hallstatt (Salzkammergut, Austria) with a comparison of seismic airgun and borehole logging units and lithological subunits. Note that the three different datasets are plotted against their respective but different depth scale. The composite core depth scale (m c.d.) is not corrected for extension. Due to this as well as to the appending of core sections, the composite core is ∼ 4 m longer compared to the borehole itself. Dashed and solid lines indicate logging tie points (LTPs) defining the correlation between the logging and core data depending on the confidence level (see detailed description in Sect. S7 and Table S7). The main ages of the lithological boundaries are indicated (based on the Bacon age–depth model), in comparison to archeological periods. See legend in Fig. 4 for lithology. Abbreviations: SU – seismic unit; LU – logging unit; GR – gamma radiation; MS – magnetic susceptibility; TWT – two-way travel time; LTP – logging tie point; M.P. – Migration Period; R.P. – Roman Period.
SU2 comprises the lower part of subunit C (including E3) and the upper part of subunit D (including E4 and E5; Fig. 6). The C–D subunit boundary correlates very well with the boundary of LU4 to LU5. The thin layer of low GR values at LU4 correlates to the base of E3, representing the MTD of E3. However, neither physical properties nor lithologic characteristics of the subunit boundary and/or the event deposits can be conclusively correlated with the diffuse acoustic facies in the SU2. A positive-amplitude reflection (peak) with reasonable lateral continuity of ∼ 1 km occurring at roughly the corresponding depth of E3 at site H3 is used to tentatively map the top of the MTD E3 through the basin (dashed blue line in Figs. 2b, d and 6). This tentative correlation is supported by the sharp density contrast between the turbidite and the underlying MTD. The turbidite itself, which – in comparison to E2 is thicker (∼ 1.8 m) and has higher natural radiation – is not recognizable in the seismic data. Similarly, the base of E3, characterized by lateral heterogeneity of the MTD as observed in holes A and B, cannot be traced (but can tentatively be mapped by the dashed purple line, assuming constant depth of the MTD in Fig. 2b). E4 and E5 are below or near the resolution of the seismic data but observable within LU5 and the upper part of subunit D. E4 shows increased GR, MS, and density values, whereas E5 shows prominent low MS values at the base, which correlates between the borehole logging and core logging dataset (i.e., logging tie points (LTPs) 13–14; Fig. 6; Table S7). The SU2-to-SU3 boundary does not correlate to any specific characteristics of the logged and cored sedimentary succession at site H3, reflecting the effect of the bubble pulse as an artificial effect, as methodologically described in Sect. 3.1.
Below 25 m b.l.f., the lower part of subunit D correlates very well to LU6 (including E6 and E7; Fig. 6). The MS values of subunit D and LU6 correlate well (see Fig. 6; LTPs 15 to 16) and show overall intermediate MS values, respectively, whereas E6 and E7 show decreased MS values. Also, the MS values in the lower part of LU6 and subunit D show differences which are addressed in Sect. 5.2.
The D–E subunit boundary correlates very well with the LU6–LU7 boundary, with the low MS values at the base of E7. LU7 correlates to subunit E, including E8 (Fig. 6), and is characterized by increased GR and MS values (see LTPs 18 and 19). E8 shows stable GR and density values and a strong peak in MS values. The transition boundary of LU7–LU8 and subunit E–F likely relates to E9, transitioning from increased GR and MS values to intermediate GR and MS values downcore (LTPs 20–27).
Below E9, LU8 corresponds to subunit F (including E10 and E11; Fig. 6). The interval between LTPs 22 and 23 will be addressed in the following Sect. 5.2. LU8 and subunit F are characterized by intermediate physical properties values; nevertheless there is a low-density interval ∼ 42 m c.d. and at least one interval prior to E10 with higher MS values.
The transition of LU8–LU9 is based on the transition of intermediate towards increased MS and GR values and likely relates to E11 (Fig. 6; LTPs 27–32). The transition from Unit 1 to Unit 2 (indicating the Pleistocene to Holocene transition; Fig. 4) likely occurs around 47.6 m c.d. based on visual description and after a transition phase of increasing MS and GR values (between E11 and ∼ 47.6 m c.d.) as well as a dominant change in density values. Furthermore, the MS correlation between borehole logging and core logging data between LTPs 27 and 33 is more challenging and will be addressed in the following Sect. 5.2 (also see Sect. S7). LU9 and Unit 2 show increased physical property values until ∼ 52 m c.d., followed by lower physical property values until ∼ 54 m c.d., which are followed by a striking increase in density values.
5.2 Advantages of combining borehole logging and coring in lakes
The borehole logging helped to estimate core extension (Baumgarten et al., 2015) and allows us to constrain the three gaps (Baumgarten et al., 2014), which could not be closed by composing the stratigraphy from boreholes A and B. The correlation of MS peaks between logging and core data across the E7 base (LU6 to LU7; and subunit D–E boundary) reveals that the main coring gap (∼ 25 m b.l.f.) is smaller than 1 m, where challenging drilling conditions occurred in both boreholes A and B – see Sect. S5. The coring gap below E11 (estimated < 1 m during challenging coring operation in borehole B – Sect. S5) is underestimated and could be up to 1 m based on the borehole logging. Also in borehole B, challenging coring operations occurred below E9. The interval between E9 and E10 (LTPs 22–23) suggests that LU8 shows 1 m of more variety, which is not clearly observed within subunit F. This observation strengthens the assumption that no correlation line at the respective depth can be described and that up to 1 m of sediment is missing.
Beside the clear advantages of the borehole logging data there are some key differences compared to the core logging data, such as the evolution of E2 and E3 within the respective datasets. The base of E2 is dominated by a mass-transport deposit (of a carbonate-rich facies) with low-amplitude MS values at the base (Fig. 6). Overlying are higher-amplitude MS values within an organic-rich interval containing sand, observed within the core logging data. In contrast, the borehole logging MS data show a gradual decrease in MS values from the base to the top of the deposit (see more details Sect. S7).
The interval between logging tie points (LTPs) 16 and 18 shows more stable MS values within the borehole logging data compared to more MS fluctuations within the core logging data. These differences might be related to the main coring gap occurring at the base of E7. Furthermore, the interval between LTPs 27 and 28 shows high-amplitude values within the core logging data, which are not observed clearly within the borehole logging data. The lack of high-amplitude values within the borehole logging data could be related to the lower vertical resolution of the borehole logging sensor. Further downcore of LTP 27, mostly only low confidence logging tie points could be identified. This could be related to more appended core segments within the core logging data, using only hole B for the deepest part.
5.3 Lithostratigraphy in chronostratigraphic and prehistoric view
The lithostratigraphic Late Pleistocene–Holocene boundary in Lake Hallstatt occurs at ∼ 47.6 m, with a change from finely laminated (< 1 cm) gray silty–clayey carbonate mud (below) towards laminated dark-gray clayey–silty carbonate mud interbedded with millimeter- to centimeter-thick graded turbidites (above). The Bacon (Blaauw and Christen, 2011) modeled age of 11 623 ± 150 cal BP overlaps the described transition at Mondsee with 11 580–11 540 cal BP (Lauterbach et al., 2011), or the Meerfelder Maar varve chronology (11 590 varve years BP; Brauer et al., 1999). Also, prominent end moraines formed during the Younger Dryas (Egesen Stadial) south of Lake Hallstatt on the Dachstein Massif (locally known as Taubenkar stand; Van Husen, 1977). The bottommost dated sample, with a radiocarbon age range of 12 682–12 748 cal BP at ∼ 50.55 m lies within the Allerød–Younger Dryas boundary which was described at Mondsee with 12 760–12 590 cal BP (Lauterbach et al., 2011). Hence, the Allerød–Younger Dryas transition likely occurs at ∼ 50.55 m c.d., which aligns with a decrease in GR and MS values downcore.
The Late Pleistocene (Unit 2 and LU9) covers the final part of the Upper Paleolithic (until 11 623 cal BP, Fig. 6), followed by six subunits (subunit A–F) and eight logging units (LUs 1–8) formed during the Holocene. The Early Holocene (subunit F, LU8) covers the Mesolithic and shows moderate fluctuations in physical properties (Fig. 6). The subsequent intervals – (i) subunit E/LU7 (onset at ∼ 7525 ± 51 cal BP), (ii) subunit D, lower part/LU6 (onset at 5998 ± 115 cal BP), (iii) subunit D, upper part/LU5 (onset at ∼ 3769 ± 91 cal BP), and (iv) subunit C/LU3 and LU4 (onset at ∼ 2576 ± 77 cal BP) – show four distinct phases of drastic changes in physical properties (Fig. 6). We observe strong variations in the sedimentation rate (indicated by the changing slope angle in the age–depth model) and multiple large-scale mass movements. Chronologically, these four intervals cover the prehistoric and large parts of the historical period (from the Neolithic to Medieval periods, Fig. 6) and thus include the onset and development of human activity in the Hallstatt area. The oldest evidence for human activity in the vicinity of Lake Hallstatt dates to the 7th and 6th millennium BP (Festi et al., 2021). The visually observed sedimentary change (as described in Sect. 4.3), as well as the physical property change at the transition towards the Copper Age (6250–4150 cal BP; subunit E (upper part) and subunit D (lower part)/LU6) will help to better characterize the role of human influence in this early phase. It is important to note that archeological as well as paleoecological data indicated the possibility of salt extraction as early as the 7th/6th millennium BP (Festi et al., 2021). Fully developed large-scale underground salt mining is evidenced from ∼ 3400 cal BP (Middle/Late Bronze Age) onwards. The Bronze Age and Early Iron Age mining phases were disrupted by large-scale mass movements several times (Festi et al., 2021; Grabner et al., 2021; Knierzinger et al., 2021). The highly resolved sedimentary record presented here will help elucidate the impact of mining as well as societal reaction to geohazards at a high chronological resolution as well as the chronology of the Late Iron Age salt mining in Hallstatt and the question of a continuity into Roman times (cf. Festi et al., 2021).
The Late Holocene consisting of LU1/subunit B and subunit A, covers the High to Late Medieval period and Modern Era, with the onset of subunit B (∼ 711 ± 34 cal BP) likely being influenced by increased human environmental interaction, such as increased salt mining with related timber exploitation and forest clearance, transport of timber and salt on the lake (Festi et al., 2021; Urstöger, 2000), and potential river diversions further upstream close to Lake Altaussee (Lamer, 1998). The change to subunit A around the mid-17th century CE could be related to systematic forest management (Lauterbach et al., 2023; Urstöger, 2000).
The Hipercorig system successfully drilled a high-resolution Late Pleistocene to Holocene sediment succession of Lake Hallstatt and revealed 10 unique major event deposits, with more than 0.3 m thickness (E2–E11) and performed borehole logging through the Hipercorig system for the first time. The borehole logging and sediment logging reveal several dynamic phases during the Holocene, with changing accumulation rate and physical property fluctuations, and correlate very well with each other. Also, the upper 15 m of the composite profile correlate very well with the HAS_2016-1 core (Lauterbach et al., 2023). However, the E2 and E3 event deposits show high spatial heterogeneity.
The inner Alpine landscape of Lake Hallstatt, within the UNESCO World Heritage region, is described as a fascinating geomorphological laboratory (Weidinger and Götz, 2022). The successful drilling campaign of the Hipercorig platform enables a high-resolution multi-proxy and multi-disciplinary-based analysis of the Late Pleistocene to Holocene sedimentary succession at Lake Hallstatt. The international research team will proceed on several main frontiers: (i) archeology, (ii) paleoclimate, and (iii) paleo-geohazards. This should be done in order to link the H3 sediment sequence to archeological findings and to better understand human–environment interaction as well as to disentangle the probable onset and impact of human activities from climatic and environmental drivers within the surroundings of Lake Hallstatt. In combination with existing neighboring lake research projects (e.g., Mondsee, Lake Altaussee) it will be possible to extract local from regional signals and compare them. Establishing a high-resolution event record for Lake Hallstatt will enable the analysis of the magnitude and frequency of natural hazards and contribute to a regional/global climatic sediment archive on a Holocene timescale in order to better understand the long-term changes within intermountain lake systems.
The code for visualizing the MSCL data is available at https://github.com/Marcel1415/splice (last access: 24 May 2023; DOI: https://doi.org/10.5281/zenodo.7966002, Ortler, 2023).
Preliminary data outlined in this report are not publicly available as they are still being evaluated and expanded. Upon completion, all data will be made available when scientific papers and reports are published.
The supplement related to this article is available online at: https://doi.org/10.5194/sd-33-1-2024-supplement.
MS, KK, AB, SCF, and HR designed the research and secured funding. MO, JK, SCF, AB, IH, JNH, and MS analyzed the data. MO and AB conducted the core descriptions, and MO developed the composite stratigraphy. MO wrote the paper and produced the figures with input from all the co-authors.
The contact author has declared that none of the authors has any competing interests.
Publisher’s note: Copernicus Publications remains neutral with regard to jurisdictional claims made in the text, published maps, institutional affiliations, or any other geographical representation in this paper. While Copernicus Publications makes every effort to include appropriate place names, the final responsibility lies with the authors.
This research was supported by the Austrian Academy of Sciences (ÖAW) through (i) the ÖAW-ESS Project FACEALPS: 3500 years of man-environmental interrelation in the UNESCO World heritage region of Hallstatt–Dachstein/Salzkammergut (PI: Kerstin Kowarik; https://facealps.wordpress.com, last access: 24 May 2023), (ii) the ÖAW-ESS-IGCP Project S4LIDE – Hallstatt Studying the Significance of Subaqueous Slides in Lake Hallstatt (https://www.uibk.ac.at/en/geologie/research/sediment/research/projects/s4lide-hallstatt/, last access: 24 May 2023), and (iii) the ÖAW Project Hipercorig Hallstatt History (H3): Accessing a deep time window of Lake Hallstatt's preHistory (PI: Michael Strasser; https://www.uibk.ac.at/en/geologie/research/sediment/research/projects/h3-project/, last access: 24 May 2023). We also want to thank the project supporters: Freunde des Naturhistorischen Museums Wien, Österreichische Bundesforste, Salinen Austria AG, Salzwelten GmbH, Frauenhofer IEG (Volker Wittig, Timo König, Sebastian Krusenbaum), the German Scientific Earth Probing Consortium (GESEP), and the UWITEC GmbH (especially the drilling operators: Richard Niederreiter and Daniel and Martin Niederreiter). We also thank the drilling supervisor Ulli Raschke as well as Markus Erhardt, Gerald Degenhart, and Wolfgang Recheis for the medical CT measurements at the Medical University of Innsbruck; Hannah B. Stanger for the preparation of the 14C samples; Werner H. Schoch for the determination of wood remains; Felix Lang for information on the Roman Period in our research area; and Chiara Ide, Nicholas J. Lewis, Julia Rechenmacher, Johanna G. Pöll, Markus Niederstätter, Anja B. Grießer, and Hannah Braun for assisting during the core opening week. Moreover, we want to thank crucial project members Martin Töpfer, Daniel Brandner, and Flavio S. Anselmetti for their support and discussions. Copernicus Land Monitoring Services and http://data.gv.at (last access: 12 January 2021) are thanked for providing the DEM data. IHS Markit is acknowledged for their educational grant program providing the Kingdom seismic interpretation software.
This research was supported by the Austrian Academy of Sciences (ÖAWESS Project FACEALPS, ÖAW-ESS-IGCP Project S4LIDE and the ÖAW Project Hipercorig Hallstatt History), the Freunde des Naturhistorischen Museums Wien, Österreichische Bundesforste, Salinen Austria AG, Salzwelten GmbH, Frauenhofer IEG, the German Scientific Earth Probing Consortium (GESEP), and UWITEC GmbH.
This paper was edited by Nadine Hallmann and reviewed by two anonymous referees.
Adler, C., Wester, P., Bhatt, I., Huggel, C., Insarov, G. E., Morecroft, M. D., Muccione, V., and Prakash, A.: Cross-Chapter Paper 5: Mountains, edited by: Pörtner, H. O., Roberts, D. C., Tignor, M., Poloczanska, E. S., Mintenbeck, K., Alegría, A., Craig, M., Langsdorf, S., Löschke, S., Möller, V., Okem, A., and Rama, B., Climate Change 2022: Impacts, Adaptation and Vulnerability. Contribution of Working Group II to the Sixth Assessment Report of the Intergovernmental Panel on Climate Change, Cambridge University Press, 2273–2318, https://doi.org/10.1017/9781009325844.022, 2022.
Arias, P. A., Bellouin, N., Coppola, E., Jones, R. G., Krinner, G., Marotzke, J., Naik, V., Palmer, M. D., Plattner, G.-K., Rogelj, J., Rojas, M., Sillmann, J., Storelvmo, T., Thorne, P. W., Trewin, B., Achuta Rao, K., Adhikary, B., Allan, R. P., Armour, K., Bala, G., Barimalala, R., Berger, S., Canadell, J. G., Cassou, C., Cherchi, A., Collins, W., Collins, W. D., Connors, S. L., Corti, S., Cruz, F., Dentener, F. J., Dereczynski, C., Di Luca, A., Diongue Niang, A., Doblas-Reyes, F. J., Dosio, A., Douville, H., Engelbrecht, F., Eyring, V., Fischer, E., Forster, P., Fox-Kemper, B., Fuglestvedt, J. S., Fyfe, J. C., Gillett, N. P., Goldfarb, L., Gorodetskaya, I., Gutierrez, J. M., Hamdi, R., Hawkins, E., Hewitt, H. T., Hope, P., Islam, A. S., Jones, C., Kaufman, D. S., Kopp, R. E., Kosaka, Y., Kossin, J., Krakovska, S., Lee, J.-Y., Li, J., Mauritsen, T., Maycock, T. K., Meinshausen, M., Min, S.-K., Monteiro, P. M. S., Ngo-Duc, T., Otto, F., Pinto, I., Pirani, A., Raghavan, K., Ranasinghe, R., Ruane, A. C., Ruiz, L., Sallée, J.-B., Samset, B. H., Sathyendranath, S., Seneviratne, S. I., Sörensson, A. A., Szopa, S., Takayabu, I., Tréguier, A.-M., van den Hurk, B., Vautard, R., von Schuckmann, K., Zaehle, S., Zhang, X., and Zickfeld, K.: Technical Summary, edited by: Masson-Delmotte, V., Zhai, P., Pirani, A., Connors, S. L., Péan, C., Berger, S., Caud, N., Chen, Y., Goldfarb, L., Gomis, M. I., Huang, M., Leitzell, K., Lonnoy, E., Matthews, J. B. R., Maycock, T. K., Waterfield, T., Yelekçi, O., Yu, R., and Zhou, B.: Climate Change 2021: The Physical Science Basis. Contribution of Working Group I to the Sixth Assessment Report of the Intergovernmental Panel on Climate Change, Cambridge University Press, 33–144, https://doi.org/10.1017/9781009157896.002, 2021.
Barsch, E., Kowarik, K., Rodler, K., Hörweg, C., Reschreiter, H., Sattmann, H., and Walochnik, J.: First molecular data on the human roundworm Ascaris lumbricoides species complex from the Bronze and Iron Age in Hallstatt, Austria, Sci. Rep., 13, 12055, https://doi.org/10.1038/s41598-023-38989-8, 2023.
Baumgarten, H., Wonik, T., and Kwiecien, O.: Facies characterization based on physical properties from downhole logging for the sediment record of Lake Van, Turkey, Quaternary Sci. Rev., 104, 85–96, https://doi.org/10.1016/j.quascirev.2014.03.016, 2014.
Baumgarten, H., Wonik, T., Tanner, D. C., Francke, A., Wagner, B., Zanchetta, G., Sulpizio, R., Giaccio, B., and Nomade, S.: Age–depth model of the past 630 kyr for Lake Ohrid (FYROM/Albania) based on cyclostratigraphic analysis of downhole gamma ray data, Biogeosciences, 12, 7453–7465, https://doi.org/10.5194/bg-12-7453-2015, 2015.
Behrends, K., Heeschen, K., Kunkel, C., and Conze, R.: The mobile Drilling Information System (mDIS) for core repositories, EGU General Assembly 2020, Online, 4–8 May 2020, EGU2020-13663, https://doi.org/10.5194/egusphere-egu2020-13663, 2020.
Beiwl, C. and Mühlmann, H.: Atlas der natürlichen Seen Österreichs mit einer Fläche > 50 ha: Morphometrie – Typisierung – Trophie, Stand 2005, Bundesamt für Wasserwirtschaft, Wien, 147 pp., ISBN 3-901605-29-0, 2008.
Blaauw, M. and Christen, J. A.: Flexible paleoclimate age-depth models using an autoregressive gamma process, Bayesian Anal., 6, 457–474, https://doi.org/10.1214/11-BA618, 2011.
Blöschl, G., Kiss, A., Viglione, A., Barriendos, M., Böhm, O., Brázdil, R., Coeur, D., Demarée, G., Llasat, M. C., Macdonald, N., Retsö, D., Roald, L., Schmocker-Fackel, P., Amorim, I., Bělínová, M., Benito, G., Bertolin, C., Camuffo, D., Cornel, D., Doktor, R., Elleder, L., Enzi, S., Garcia, J. C., Glaser, R., Hall, J., Haslinger, K., Hofstätter, M., Komma, J., Limanówka, D., Lun, D., Panin, A., Parajka, J., Petrić, H., Rodrigo, F. S., Rohr, C., Schönbein, J., Schulte, L., Silva, L. P., Toonen, W. H. J., Valent, P., Waser, J., and Wetter, O.: Current European flood-rich period exceptional compared with past 500 years, Nature, 583, 560–566, https://doi.org/10.1038/s41586-020-2478-3, 2020.
Brauer, A., Endres, C., and Negendank, J. F. W.: Lateglacial calendar year chronology based on annually laminated sediments from Lake Meerfelder Maar, Germany, Quatern. Int., 61, 17–25, https://doi.org/10.1016/S1040-6182(99)00014-2, 1999.
Brigham-Grette, J., Melles, M., Minyuk, P., Andreev, A., Tarasov, P., DeConto, R., Koenig, S., Nowaczyk, N., Wennrich, V., Rosén, P., Haltia, E., Cook, T., Gebhardt, C., Meyer-Jacob, C., Snyder, J., and Herzschuh, U.: Pliocene Warmth, Polar Amplification, and Stepped Pleistocene Cooling Recorded in NE Arctic Russia, Science, 340, 1421–1427, https://doi.org/10.1126/science.1233137, 2013.
Bronk Ramsey, C.: Bayesian Analysis of Radiocarbon Dates, Radiocarbon, 51, 337–360, https://doi.org/10.1017/S0033822200033865, 2009.
Costanza, R., Graumlich, L., Steffen, W., Crumley, C., Dearing, J., Hibbard, K., Leemans, R., Redman, C., and Schimel, D.: Sustainability or Collapse: What Can We Learn from Integrating the History of Humans and the Rest of Nature?, AMBIO, 36, 522–527, https://doi.org/10.1579/0044-7447(2007)36[522:SOCWCW]2.0.CO;2, 2007.
Croudace, I. W., Rindby, A., and Rothwell, R. G.: ITRAX: description and evaluation of a new multi-function X-ray core scanner, Geol. Soc. Lond. Spec. Publ., 267, 51–63, https://doi.org/10.1144/GSL.SP.2006.267.01.04, 2006.
Fernández, O., Habermüller, M., and Grasemann, B.: Hooked on salt: Rethinking Alpine tectonics in Hallstatt (Eastern Alps, Austria), Geology, 49, 325–329, https://doi.org/10.1130/G47981.1, 2021.
Festi, D., Brandner, D., Grabner, M., Knierzinger, W., Reschreiter, H., and Kowarik, K.: 3500 years of environmental sustainability in the large-scale alpine mining district of Hallstatt, Austria, J. Archaeol. Sci.-Reports, 35, 102670, https://doi.org/10.1016/j.jasrep.2020.102670, 2021.
Ficker, H., Gassner, H., Achleitner, D., and Schabetsberger, R.: Ectogenic Meromixis of Lake Hallstättersee, Austria Induced by Waste Water Intrusions from Salt Mining, Water Air Soil Poll., 218, 109–120, https://doi.org/10.1007/s11270-010-0627-2, 2011.
Grabner, M., Reschreiter, H., Wächter, E., Mayer, K., Winner, G., and Kowarik, K.: Die verwendeten Holzarten im prähistorischen Salzbergbau von Hallstatt, in: Hallstätter Beziehungsgeschichten. Wirtschaftsstrukturen und Umfeldbeziehungen der bronze-und ältereisenzeitlichen Salzbergbaue von Hallstatt/OÖ. Studien zur Kulturgeschichte von Oberösterreich, vol. 50, edited by: Kowarik, K., 83–96, ISBN 978-3-85474-353-8, 2019.
Grabner, M., Wächter, E., Nicolussi, K., Bolka, M., Sormaz, T., Steier, P., Wild, E. M., Barth, F. E., Kern, A., Rudorfer, J., Kowarik, K., Stöllner, T., and Reschreiter, H.: Prehistoric salt mining in Hallstatt, Austria. New chronologies out of small wooden fragments, Dendrochronologia, 66, 125814, https://doi.org/10.1016/j.dendro.2021.125814, 2021.
Hajdas, I.: Radiocarbon dating and its applications in Quaternary studies, E&G Quaternary Sci. J., 57, 2–24, https://doi.org/10.3285/eg.57.1-2.1, 2008.
Harms, U., Raschke, U., Anselmetti, F. S., Strasser, M., Wittig, V., Wessels, M., Schaller, S., Fabbri, S. C., Niederreiter, R., and Schwalb, A.: Hipercorig – an innovative hydraulic coring system recovering over 60 m long sediment cores from deep perialpine lakes, Sci. Dril., 28, 29–41, https://doi.org/10.5194/sd-28-29-2020, 2020.
IODP depth scales terminology: https://www.iodp.org/policies-and-guidelines/142-iodp-depth-scales-terminology-april-2011/file, last access: 6 February 2023.
Jutzeler, M., White, J. D. L., Talling, P. J., McCanta, M., Morgan, S., Le Friant, A., and Ishizuka, O.: Coring disturbances in IODP piston cores with implications for offshore record of volcanic events and the Missoula megafloods, Geochem. Geophy. Geosy., 15, 3572–3590, https://doi.org/10.1002/2014GC005447, 2014.
Kiefer, C., Oswald, P., Moernaut, J., Fabbri, S. C., Mayr, C., Strasser, M., and Krautblatter, M.: A 4000-year debris flow record based on amphibious investigations of fan delta activity in Plansee (Austria, Eastern Alps), Earth Surf. Dynam., 9, 1481–1503, https://doi.org/10.5194/esurf-9-1481-2021, 2021.
Kiss, A.: Floods and Long-Term Water-Level Changes in Medieval Hungary, Springer International Publishing, Cham, https://doi.org/10.1007/978-3-319-38864-9, 2019.
Knapp, S., Gilli, A., Anselmetti, F. S., Krautblatter, M., and Hajdas, I.: Multistage Rock-Slope Failures Revealed in Lake Sediments in a Seismically Active Alpine Region (Lake Oeschinen, Switzerland), J. Geophys. Res.-Earth Surf., 123, 658–677, https://doi.org/10.1029/2017JF004455, 2018.
Knierzinger, W., Festi, D., Limbeck, A., Horak, F., Brunnbauer, L., Drollinger, S., Wagreich, M., Huang, J.-J. S., Strasser, M., Knorr, K.-H., Reschreiter, H., Gier, S., Kofler, W., Herzig, C., and Kowarik, K.: Multi-proxy analyses of a minerotrophic fen to reconstruct prehistoric periods of human activity associated with salt mining in the Hallstatt region (Austria), J. Archaeol. Sci.-Reports, 36, 102813, https://doi.org/10.1016/j.jasrep.2021.102813, 2021.
Kück, J., Groh, M., Töpfer, M., Jurczyk, A., and Harms, U.: New geophysical memory-logging system for highly unstable and inclined scientific exploration drilling, Sci. Dril., 29, 39–48, https://doi.org/10.5194/sd-29-39-2021, 2021.
Lamer, R.: Das Ausseer Land: Geschichte und Kultur einer Landschaft, Styria, ISBN 978-3222126130, 1998.
Lankston, R. W.: J. New Display of the 1970 Flathead Lake Seismic Data, 1970 Flathead Lake Seismic Survey, Edited version of the Lankston 2011 Northwest Geology paper, Montana's ScholarWorks, https://scholarworks.umt.edu/flathead/13 (last access: 13 May 2023), 2017.
Lauterbach, S., Brauer, A., Andersen, N., Danielopol, D. L., Dulski, P., Hüls, M., Milecka, K., Namiotko, T., Obremska, M., Von Grafenstein, U., and Declakes Participants: Environmental responses to Lateglacial climatic fluctuations recorded in the sediments of pre-Alpine Lake Mondsee (northeastern Alps), J. Quaternary Sci., 26, 253–267, https://doi.org/10.1002/jqs.1448, 2011.
Lauterbach, S., Strasser, M., Kowarik, K., Reschreiter, H., Mandl, G. W., Spötl, C., Plessen, B., and Brauer, A.: Large-scale mass movements recorded in the sediments of Lake Hallstatt (Austria)–evidence for recurrent natural hazards at a UNESCO World Heritage site, J. Quaternary Sci., 38, 258–275, https://doi.org/10.1002/jqs.3472, 2023.
Litt, T., Anselmetti, F. S., Baumgarten, H., Beer, J., Cagatay, N., Cukur, D., Damci, E., Glombitza, C., Haug, G., Heumann, G., Kallmeyer, H., Kipfer, R., Krastel, S., Kwiecien, O., Meydan, A. F., Orcen, S., Pickarski, N., Randlett, M.-E., Schmincke, H.-U., Schubert, C. J., Sturm, M., Sumita, M., Stockhecke, M., Tomonaga, Y., Vigliotti, L., Wonik, T., and the PALEOVAN Scientific Team: 500,000 Years of Environmental History in Eastern Anatolia: The PALEOVAN Drilling Project, Sci. Dril., 14, 18–29, https://doi.org/10.2204/iodp.sd.14.02.2012, 2012.
Mandl, G. W., Van Husen, D., and Lobitzer, H.: Geologische Karte der Republik Österreich 1 : 50 000, Erläuterungen zu Blatt 96 Bad Ischl, Geologische Bundesanst, Wien, ISBN 978-3-85316-061-9, 2012.
Melzner, S.: Ereignis- und Schadenskataster von Sturzprozessen (Steinschlag/Felssturz) in der Gemeinde Hallstatt, in: Arbeitstagung “Angewandte Geowissenschaften an der GBA”, edited by: Wimmer-Frey, I., Römer, A., and Janda, C., Bad Ischl, Hallstatt, Gmunden, 19–22 June 2017, Geologische Bundesanstalt, 289–290, ISBN-978-3-85316-092-3, 2017.
Moernaut, J.: Time-dependent recurrence of strong earthquake shaking near plate boundaries: A lake sediment perspective, Earth-Sci. Rev., 210, 103344, https://doi.org/10.1016/j.earscirev.2020.103344, 2020.
Ortler, M.: Marcel1415/splice: v0.2-alpha, Zenodo [code], https://doi.org/10.5281/zenodo.7966002, 2023.
Oswald, P., Strasser, M., Hammerl, C., and Moernaut, J.: Seismic control of large prehistoric rockslides in the Eastern Alps, Nat. Commun., 12, 1059, https://doi.org/10.1038/s41467-021-21327-9, 2021.
Pürstinger, C.: Verbauungsgeschichte Hallstätter Mühlbach und Revision des Gefahrenzonenplans der Marktgemeinde Hallstatt, in: Arbeitstagung “Angewandte Geowissenschaften an der GBA”, edited by: Wimmer-Frey, I., Römer, A., and Janda, C., Bad Ischl, Hallstatt, Gmunden, 19–22 June 2017, Geologische Bundesanstalt, 132–139, ISBN-978-3-85316-092-3, 2017.
Reimer, P. J., Austin, W. E. N., Bard, E., Bayliss, A., Blackwell, P. G., Bronk Ramsey, C., Butzin, M., Cheng, H., Edwards, R. L., Friedrich, M., Grootes, P. M., Guilderson, T. P., Hajdas, I., Heaton, T. J., Hogg, A. G., Hughen, K. A., Kromer, B., Manning, S. W., Muscheler, R., Palmer, J. G., Pearson, C., van der Plicht, J., Reimer, R. W., Richards, D. A., Scott, E. M., Southon, J. R., Turney, C. S. M., Wacker, L., Adolphi, F., Büntgen, U., Capano, M., Fahrni, S. M., Fogtmann-Schulz, A., Friedrich, R., Köhler, P., Kudsk, S., Miyake, F., Olsen, J., Reinig, F., Sakamoto, M., Sookdeo, A., and Talamo, S.: The IntCal20 Northern Hemisphere Radiocarbon Age Calibration Curve (0–55 cal kBP), Radiocarbon, 62, 725–757, https://doi.org/10.1017/RDC.2020.41, 2020.
Reschreiter, H. and Kowarik, K.: Bronze Age Mining in Hallstatt. A New Picture of Everyday Life in the Salt Mines and Beyond, Archaeologia Austriaca, 103, 99–136, https://doi.org/10.1553/archaeologia103s99, 2019.
Rohn, J., Ehret, D., Moser, M., and Czurda, K.: Prehistoric and recent mass movements of the World Cultural Heritage Site Hallstatt, Austria, Environ. Geol., 47, 702–714, https://doi.org/10.1007/s00254-004-1201-2, 2005.
Rohr, C.: Measuring the frequency and intensity of floods of the Traun River (Upper Austria), 1441–1574, Hydrolog. Sci. J., 51, 834–847, https://doi.org/10.1623/hysj.51.5.834, 2006.
Rohr, C.: Extreme Naturereignisse im Ostalpenraum, Naturerfahrung im Spätmittelalter und am Beginn der Neuzeit, Umwelthistorische Forschungen, vol. 4, ISBN 9783412200428, 2007.
Sabatier, P., Moernaut, J., Bertrand, S., Van Daele, M., Kremer, K., Chaumillon, E., and Arnaud, F.: A Review of Event Deposits in Lake Sediments, Quaternary, 5, 34, https://doi.org/10.3390/quat5030034, 2022.
Sammartini, M., Moernaut, J., Anselmetti, F. S., Hilbe, M., Lindhorst, K., Praet, N., and Strasser, M.: An Atlas of Mass-Transport Deposits in Lakes, in: Submarine Landslides, Geophysical Monograph Series, edited by: Ogata, K., Festa, A., and Pini, G. A., Wiley, 201–226, https://doi.org/10.1002/9781119500513.ch13, 2019.
Schaller, S., Böttcher, M. E., Buechi, M. W., Epp, L. S., Fabbri, S. C., Gribenski, N., Harms, U., Krastel, S., Liebezeit, A., Lindhorst, K., Marxen, H., Raschke, U., Schleheck, D., Schmiedinger, I., Schwalb, A., Vogel, H., Wessels, M., and Anselmetti, F. S.: Postglacial evolution of Lake Constance: sedimentological and geochemical evidence from a deep-basin sediment core, Swiss J. Geosci., 115, 7, https://doi.org/10.1186/s00015-022-00412-1, 2022.
Schnurrenberger, D., Russell, J., and Kelts, K.: Classification of lacustrine sediments based on sedimentary components, J. Paleolimnol., 29, 141–154, https://doi.org/10.1023/A:1023270324800, 2003.
Schorn, A. and Neubauer, F.: The structure of the Hallstatt evaporite body (Northern Calcareous Alps, Austria): A compressive diapir superposed by strike-slip shear?, J. Struct. Geol., 60, 70–84, https://doi.org/10.1016/j.jsg.2013.12.008, 2014.
Stein, S., Geller, R. J., and Liu, M.: Why earthquake hazard maps often fail and what to do about it, Tectonophysics, 562–563, 1–25, https://doi.org/10.1016/j.tecto.2012.06.047, 2012.
Strasser, M., Berberich, T., Fabbri, S., Hilbe, M., Huang, J.-J. S., Lauterbach, S., Ortler, M., Rechschreiter, H., Brauer, A., Anselmetti, F., and Kowarik, K.: Geomorphology and event-stratigraphy of recent mass-movement processes in Lake Hallstatt (UNESCO World Heritage Cultural Landscape, Austria), Geol. Soc. Lond. Spec. Publ., 500, 405–426, https://doi.org/10.1144/SP500-2019-178, 2020.
Stuiver, M. and Polach, H. A.: Discussion Reporting of 14C Data, Radiocarbon, 19, 355–363, https://doi.org/10.1017/S0033822200003672, 1977.
Swierczynski, T., Lauterbach, S., Dulski, P., Delgado, J., Merz, B., and Brauer, A.: Mid- to late Holocene flood frequency changes in the northeastern Alps as recorded in varved sediments of Lake Mondsee (Upper Austria), Quaternary Sci. Rev., 80, 78–90, https://doi.org/10.1016/j.quascirev.2013.08.018, 2013.
Synal, H.-A., Stocker, M., and Suter, M.: MICADAS: A new compact radiocarbon AMS system, Nucl. Instrum. Meth. B, 259, 7–13, https://doi.org/10.1016/j.nimb.2007.01.138, 2007.
Urstöger, H. J.: Hallstatt-Chronik: von den Anfängen bis zum Jahr 2000. Nach Originalchroniken, Veröffentlichungen über Hallstatt, Unterlagen aus dem Museumsarchiv und Berichten von Zeitzeugen, Verlag d. Musealvereins Hallstatt, ISBN 3900998507, 2000.
Van Husen, D.: Zur Fazies und Stratigraphie der jungpleistozänen Ablagerungen im Trauntal, Geolog. Bundesanstalt, 1–130 pp., ISSN 0016-7800, 1977.
Van Husen, D.: LGM and late-glacial fluctuations in the Eastern Alps, Quatern. Int., 38–39, 109–118, https://doi.org/10.1016/S1040-6182(96)00017-1, 1997.
Van Husen, D.: Chapter 2 – Quaternary Glaciations in Austria, in: Quaternary Glaciations – Extent and Chronology, edited by: Ehlers, J., Gibbard, P. L., and Hughes, P. D., Elsevier, vol. 15, 15–28, https://doi.org/10.1016/B978-0-444-53447-7.00002-7, 2011.
Wagner, B., Vogel, H., Francke, A., Friedrich, T., Donders, T., Lacey, J. H., Leng, M. J., Regattieri, E., Sadori, L., Wilke, T., Zanchetta, G., Albrecht, C., Bertini, A., Combourieu-Nebout, N., Cvetkoska, A., Giaccio, B., Grazhdani, A., Hauffe, T., Holtvoeth, J., Joannin, S., Jovanovska, E., Just, J., Kouli, K., Kousis, I., Koutsodendris, A., Krastel, S., Lagos, M., Leicher, N., Levkov, Z., Lindhorst, K., Masi, A., Melles, M., Mercuri, A. M., Nomade, S., Nowaczyk, N., Panagiotopoulos, K., Peyron, O., Reed, J. M., Sagnotti, L., Sinopoli, G., Stelbrink, B., Sulpizio, R., Timmermann, A., Tofilovska, S., Torri, P., Wagner-Cremer, F., Wonik, T., and Zhang, X.: Mediterranean winter rainfall in phase with African monsoons during the past 1.36 million years, Nature, 573, 256–260, https://doi.org/10.1038/s41586-019-1529-0, 2019.
Weidinger, J. T. and Götz, J.: The World Heritage Site Hallstatt-Dachstein/Salzkammergut: A Fascinating Geomorphological Field Laboratory, in: Landscapes and Landforms of Austria, edited by: Embleton-Hamann, C., Springer International Publishing, Cham, 265–276, https://doi.org/10.1007/978-3-030-92815-5_17, 2022.
Wilhelm, B., Rapuc, W., Amann, B., Anselmetti, F. S., Arnaud, F., Blanchet, J., Brauer, A., Czymzik, M., Giguet-Covex, C., Gilli, A., Glur, L., Grosjean, M., Irmler, R., Nicolle, M., Sabatier, P., Swierczynski, T., and Wirth, S. B.: Impact of warmer climate periods on flood hazard in the European Alps, Nat. Geosci., 15, 118–123, https://doi.org/10.1038/s41561-021-00878-y, 2022.