the Creative Commons Attribution 4.0 License.
the Creative Commons Attribution 4.0 License.
 | 02 Sep 2024
Active seismic surveys for drilling target characterization in Ossola Valley: International Continental Scientific Drilling Program (ICDP) project Drilling the Ivrea–Verbano zonE (DIVE) phase I
Andrew Greenwood
György Hetényi
Ludovic Baron
Alberto Zanetti
Othmar Müntener
Drilling target locations of the International Continental Scientific Drilling Program (ICDP) project Drilling the Ivrea–Verbano zonE (DIVE) have been initially proposed based on geological knowledge of surface outcrops and the structural context of the Ivrea–Verbano zone (IVZ) and of the Insubric Line. For the determination of the exact locations of drilling sites as well as for drilling geometry planning, we have carried out a series of active seismic experiments to image the subsurface at high resolution. The two drilling sites of project DIVE in Ossola Valley, one near Ornavasso and the other in Megolo di Mezzo, in the central part of the Ivrea–Verbano zone have been surveyed with site-specific velocity models and a seismic data processing chain. The findings have been interpreted in relation with the outcropping structures. These suggest a reasonable continuity from the surface. They also guide the planned borehole orientations: near-vertical at DT-1B (Ornavasso) into the tightly folded Massone Antiform and at 15–20° from the vertical in Megolo across a flank of the broad Proman Anticline. The seismic surveys indicate that the sedimentary overburden is up to 50 m deep at the specific drill sites and can be minimized by relocating the proposed locations. The seismic surveys also indicate that the center of the Ossola Valley contains about 550 m of sedimentary infill, defining the interface of bedrock and Quaternary glacial sediments at about 300 m below sea level.
- Article
(13550 KB) - Full-text XML
- BibTeX
- EndNote


The geology of the Ivrea–Verbano zone (IVZ) has been extensively studied for over a century and is arguably one of the most complete exhumed cross sections of the lower continental crust (LCC) and its transition into the uppermost mantle (Fig. 1) in the world. Consequently, these exposed sections in the Western Alps of Italy have been a prime locality to gain insights into the composition, structure, and evolution of the continental lithosphere from surface samples (e.g., Brodie and Rutter, 1987; Fountain, 1989; Quick et al., 1995). Furthermore, prominent geophysical anomalies observed over the IVZ, such as seismic, gravimetric, and magnetic anomalies, have sparked worldwide interest (e.g., Niggli, 1946; Berckhemer, 1968; Lanza, 1982; Kissling et al., 1984; Kissling, 1993; The ECORS-CROP Gravity Group, 1989; The ECORS-CROP DSS Group, 1989; Diehl et al., 2009; Lu et al., 2018; Scarponi et al., 2020, 2021). The common interpretation of the causative structure is a sliver of the Adriatic lower crust and upper mantle, the so-called Ivrea Geophysical Body (IGB), which was finally exhumed during the collision with the European plate (e.g., Schmid et al., 2017).
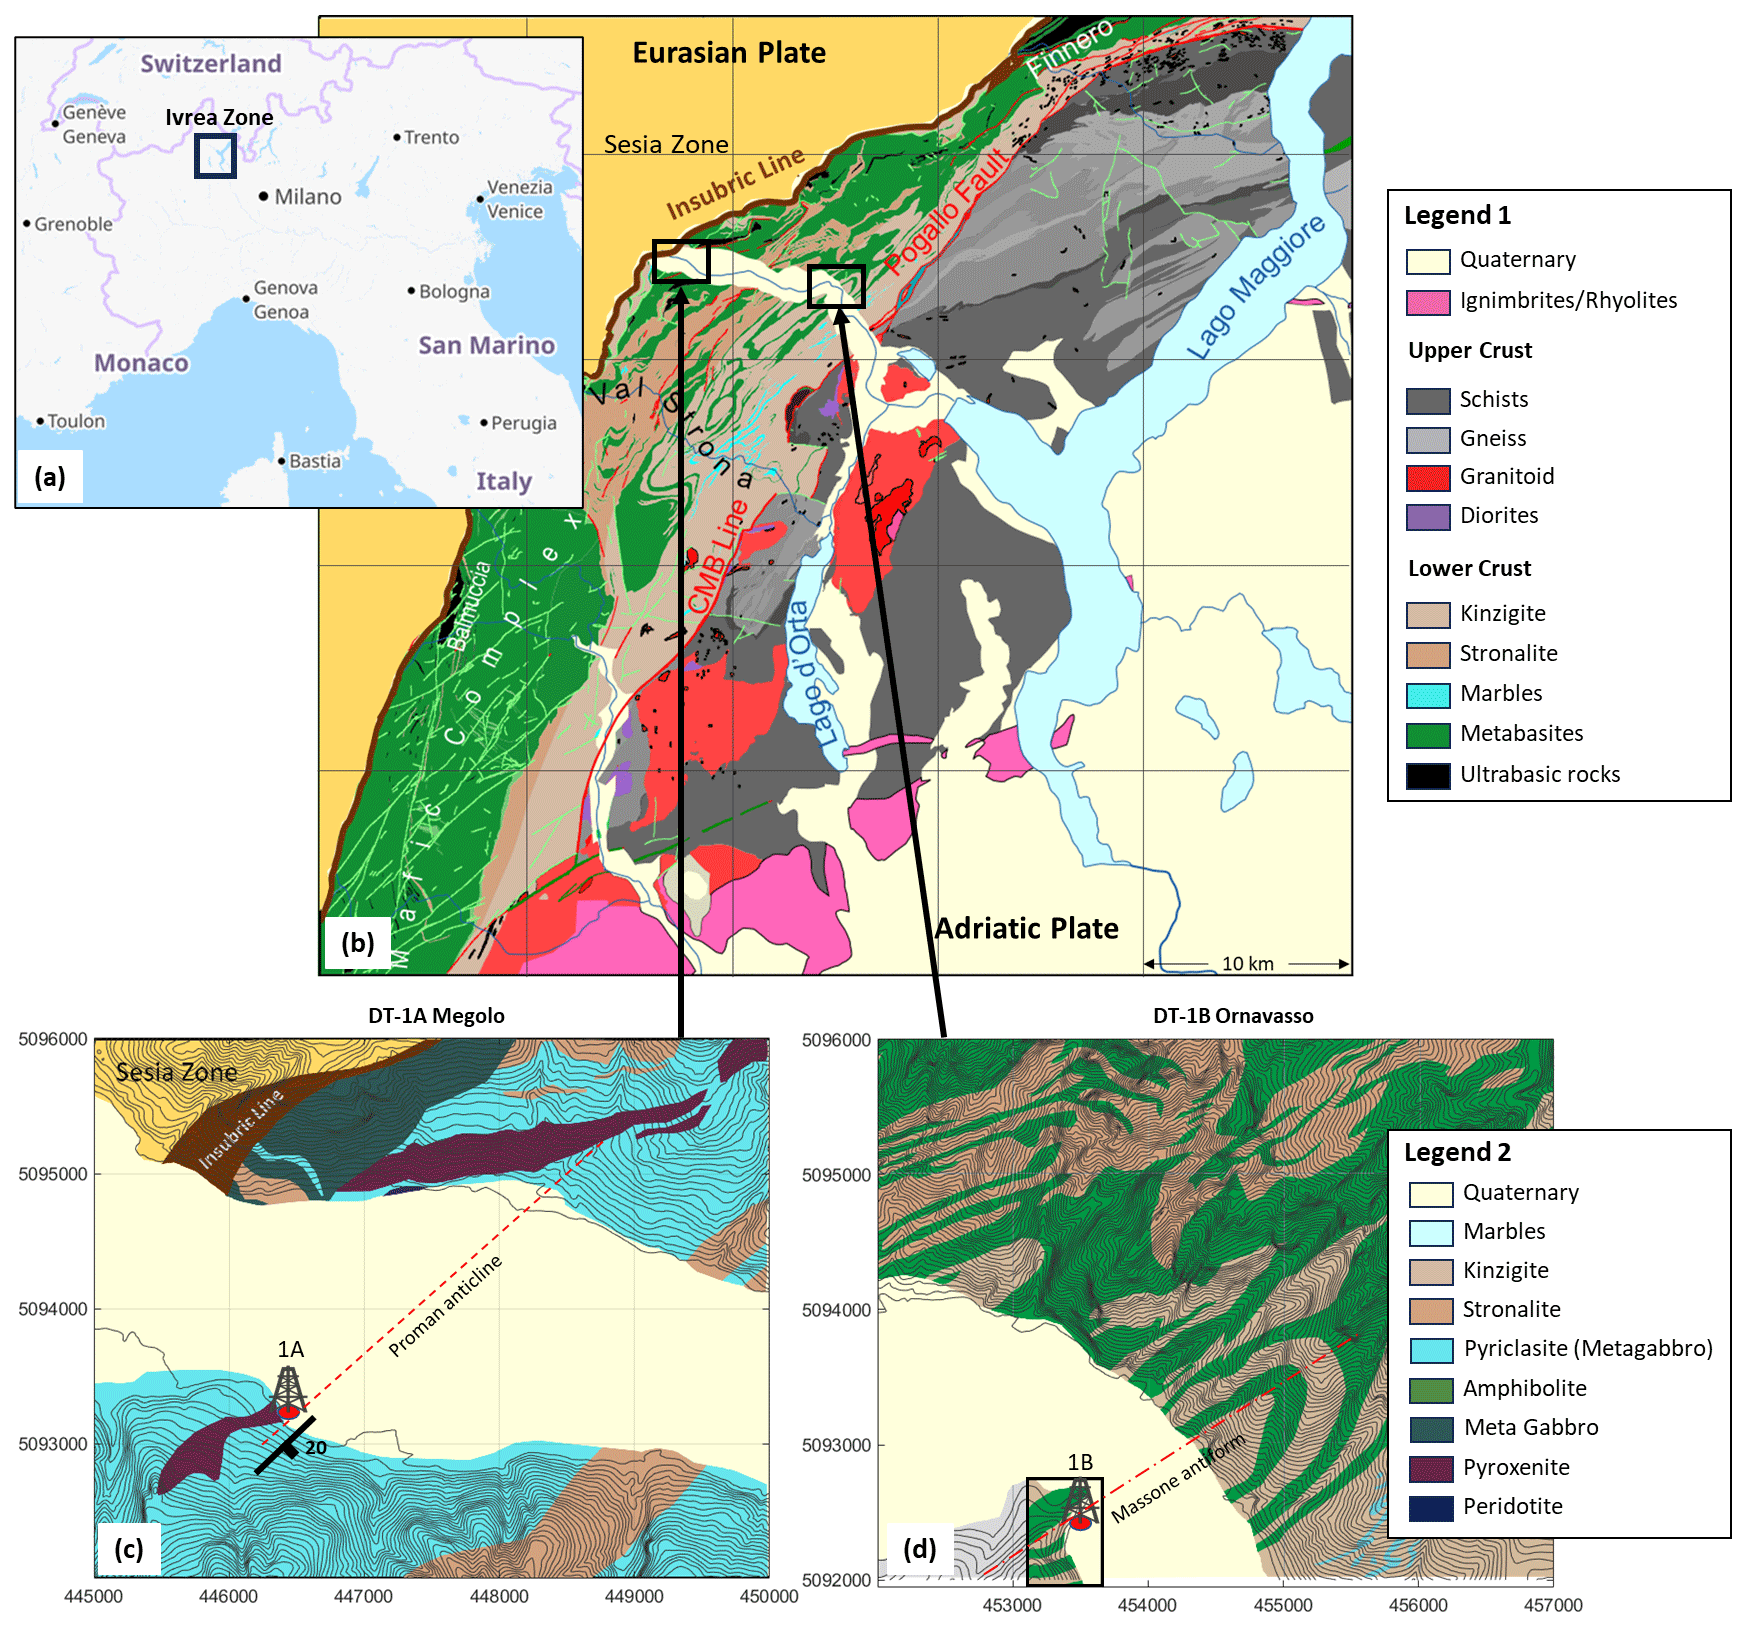
Figure 1(a) Location of the Ivrea–Verbano zone (black rectangle) in Italy. (© OpenStreetMap contributors 2024. Distributed under the Open Data Commons Open Database License (ODbL) v1.0.) (b) Overview of the IVZ geology (modified from Brack et al., 2010), with the Insubric Line as the major boundary between the Adriatic and Eurasian plates. Marked by black rectangles are the locations of geologic maps enhanced in panels (c) and (d). Refer to Legend 1 for the geologic unit description of (b). Geologic units of the Sesia zone west of the Insubric Line are not shown. Panels (c) and (d) show the local geology (modified after Burlini, 2008) of the DT-1A and DT-1B drill sites. The proposed drill locations are marked by red dots and a drill rig symbol. The Sesia zone geologic units and the Insubric Line mylonites are not fully described. Refer to Legend 2 for the geologic unit description for areas in panels (c) and (d). The dashed red line indicates the strike of the Proman Anticline, which dips ESE at 20°in Megolo. The dotted–dashed red line indicates the orientation of the Massone Antiform axial plane. The southern geology in panel (c) and the insert in panel (d) have been mapped by DIVE.
Based on the intense interest in deepening our understanding of the lower crust, the Drilling the Ivrea–Verbano zonE (DIVE) project has been approved and co-funded by the International Continental Scientific Drilling Program (ICDP). Drilling is the only way to analyze the deepest, non-exposed portions of the IVZ crustal sections in a continuous manner by means of fresh rock cores. Using this method, the DIVE project aims at unraveling long-standing fundamental questions on the nature of the LCC and the characteristics of the underlying physical and chemical rock properties across a broad range of spatial scales and investigating potential microbiological niches; these will ultimately provide unique insights into the architecture of the LCC and the processes that have formed it. For a detailed description and motivations to initiate project DIVE, we refer to Pistone et al. (2017). Scientific drilling is planned to have two phases. DIVE phase II, in the future, is planned to be in Sesia Valley (Liu et al., 2021; Ryberg et al., 2023), with the promising target of drilling through the crust–mantle transition zone, the Moho (Fig. 1), whereas the approved and funded DIVE phase I plans to drill two boreholes that are 1 km in length, DT-1A (5071-1A, IGSN ICDP5071EH10001; Müntener, 2024a) and DT-1B (5071-1B, IGSN ICDP5071EH30001; Müntener, 2024b), into two portions of an archetypal lower crustal section in the central IVZ (Fig. 1) that have been selected primarily based on the geological structure (see details in Pistone et al., 2017). The recovered rock cores in combination with a comprehensive downhole logging program and high-resolution geophysical studies will significantly advance our knowledge with respect to the geological information collected at the surface.
In preparation for the borehole location and orientation as well as for post-drilling interpretation of the DIVE phase I, a set of active seismic surveys has been planned with the aim to image the subsurface structure at and around the targeted borehole locations. This is highly needed to cover the gap in spatial scales between the regional geophysical structure (known from broadband seismology and gravity results) on the 1–10 km scale and the future borehole geophysics dataset at the 0.1–1 m scale. Furthermore, although the surface geological structure is mapped in detail and topographic relief and deformed structure allow for some level of downward extrapolation, it is essential to perform an actual site characterization by high-resolution active seismic methods. This was planned not only with the departure hypothesis that surface geology is reasonably continuable downward and to verify that there are no unexpected subsurface discontinuities at the drilling target locations, but also to precisely locate and optimally orient the borehole for the DIVE scientific targets to be reached, such as reaching the deepest structural layers possible during drilling.
With these objectives in mind, the corresponding active seismic surveys have been carefully planned and completed. These investigations concentrate on transects within the Ossola Valley to characterize the vicinity of the DT-1A and DT-1B drill hole locations in Megolo and Ornavasso (Fig. 1), respectively. Here we present the results of our so-called MicrO-SEIZE (SEismic imaging of the Ivrea ZonE; MOS) active seismic campaigns. The observations are discussed with respect to the prevailing structure and planning of the drilling operations. An ancillary goal is to determine the bedrock–Quaternary sediment interface, which provides additional constraints when defining the precise drill sites. The overall findings will ultimately serve for the interpretation of the rich program of borehole geophysical results of both drill holes.
The central IVZ consists of highly variable amphibolite to granulite facies rocks (e.g., Schmid and Wood, 1976; Sills, 1984), dominated by garnet-bearing metasediments, enriched in U, Th, and K, intercalated with minor marble and mafic rocks (e.g., Redler et al., 2012) and locally cut by alkali syenites, carbonatites, and ultramafic pipes (e.g., Schaltegger et al., 2015; Galli et al., 2019; Garuti et al., 2001). It is characterized by large-scale folds, Permian to Jurassic high-temperature shear zones, low-grade Alpine deformation, and past partial melting represented by migmatites (e.g., Rutter et al., 2007; Ewing et al., 2015; Wyatt et al., 2022). The dominant Paleozoic deformation was responsible for the formation of large-scale folds (Massone Antiform; Rutter et al., 2007), whilst Alpine tilting resulted in the general orientation of the foliation that dips steeply northeast or southwest. Previous deformation is documented by small- to large-scale tight folds (Candoglia Antiform; Rutter et al., 2007). Alpine shortening and back-thrusting followed by dextral strike-slip deformation caused the formation of the large-scale Proman Anticline (Schmid, 1967; Rutter et al., 2007), localized greenschist facies fabrics, cataclasites, and pseudotachylytes (Obata and Karato, 1995; Souquière and Fabbri, 2010; Pittarello et al., 2012; Garde et al., 2015).
The Ornavasso borehole is expected to intersect the pre-Permian dominantly felsic heterogeneous upper part of the lower crust in the hinge of the tightly folded Massone Antiform. Site surveys indicate that intercalations of amphibolite facies, metasedimentary, and metamafic rocks are present and there is a reasonable chance to investigate the transition into denser rock types. At Megolo, an inclined borehole is planned to intersect the Proman Anticline, a pre-Permian part of the continental lower crust characterized by peridotite–gabbro–metasedimentary interfaces, dipping approximately 20° east-southeast. Together, these two sites will provide a comprehensive section of Ivrea LCC lithologies and may encounter the transition into deeper mantle rocks.
MicrO-SEIZE (MOS) surveys were conducted over a period of 12 d in mid- to late June 2019, utilizing a 26 000 lb (12 247 kg) EnviroVibe 2™ vibrator source. A total of four seismic reflection surveys, one in Megolo, two in Ornavasso (Ornavasso primary, OP; Ornavasso secondary, OS), and a transect crossing from Premosello–Chiovenda south toward Megolo (PCM), make up the database (Fig. 2). The Ossola Valley is a deep glacial valley bounded by steep (ca. 25–30 degree), densely vegetated mountain flanks. Consequently, the valley hosts agricultural pastures, the Toce River, major arterial roads, water canals, and rail lines, which impose major constraints on seismic survey design and generate anthropogenic noise. In addition to these constraints and to avoid drilling thick Quaternary sedimentary overburden, the DT-1A and DT-1B drill sites are located very close to the valley sides, further complicating the coverage obtainable with surface seismic arrays. Nonetheless, survey planning utilized existing roads, pathways, and open grass fields to cover as much area as possible around the borehole sites, to reduce the environmental impact on cultivation, and to ease operation logistics. In the Megolo survey, between 446750 and 447000 m E (Fig. 2b), in order to maintain better geophone coupling, it was decided to plant geophones along an old disused highway, whilst the EnviroVibe followed the current road, which navigates over a large stormwater culvert spanned by a bridge and gentle ramps.
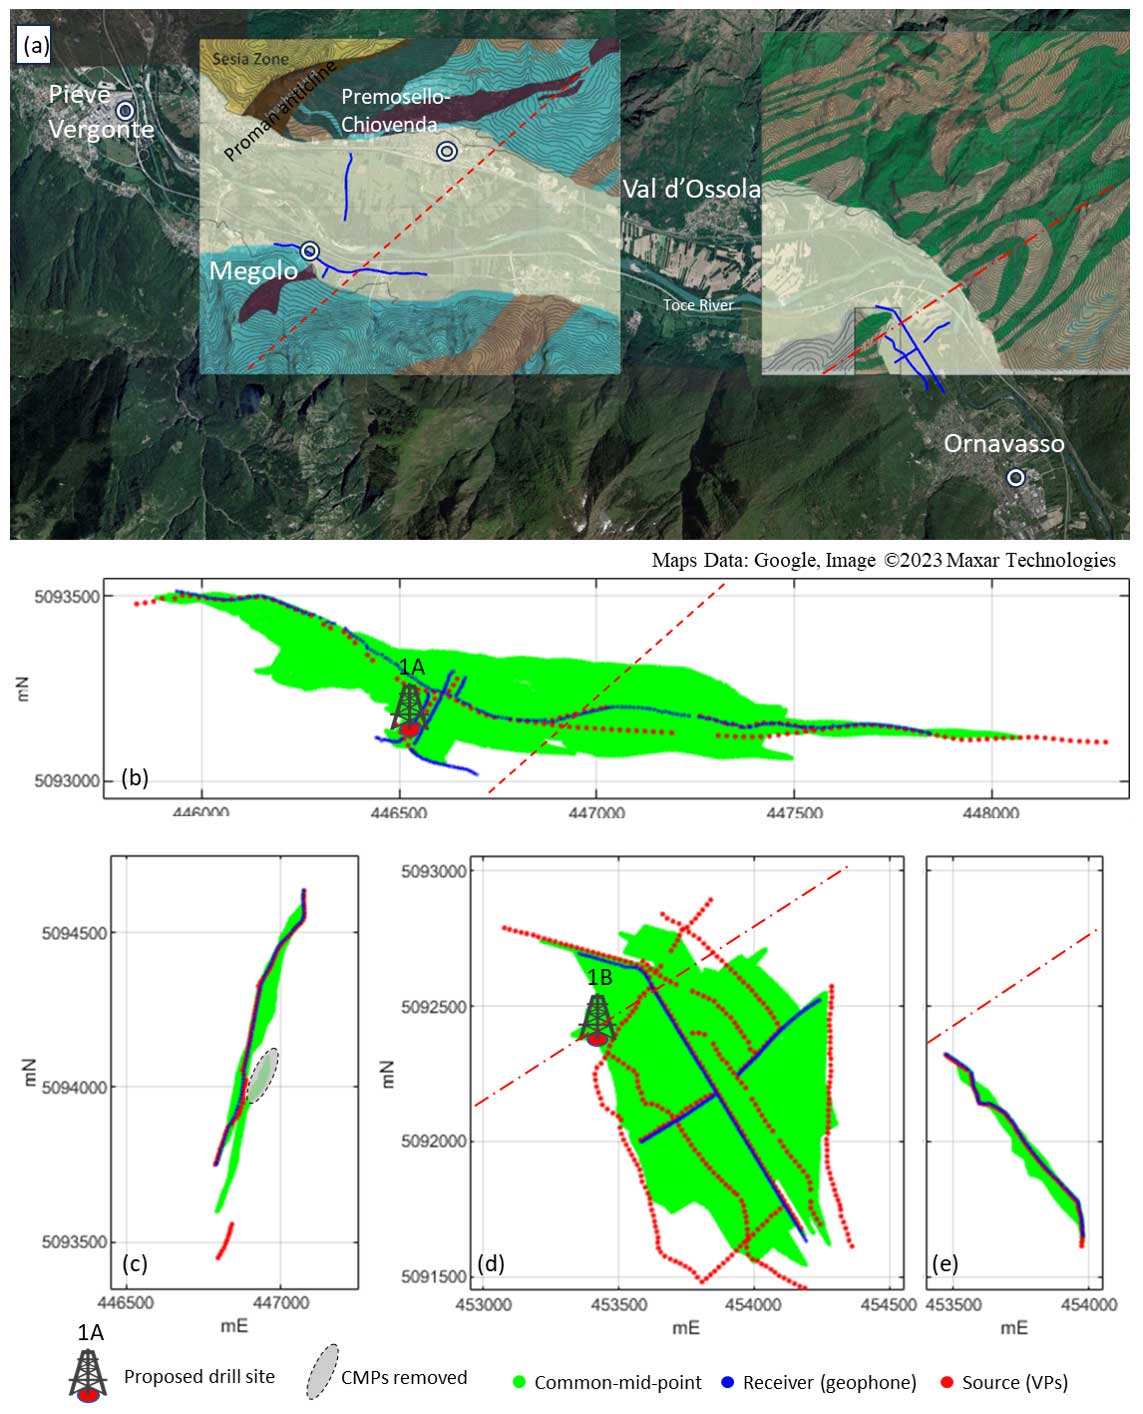
Figure 2(a) Location of the MOS active seismic surveys within the Ossola Valley. Seismic receiver lines are indicated by blue lines and the geology overlay maps and lithologies are as described in Fig. 1. Common-midpoint (CMP) maps for (b) the Megolo primary (MP) profile, (c) the Premosello Chiovenda–Megolo (PCM) profile, (d) the Ornavasso primary (OP) profile, and (e) the Ornavasso secondary (OS) line. CMPs are shown as green dots, whereas source and receiver locations are displayed as red and blue dots, respectively. For reference, the Proman Anticline and Massone Antiform are indicated by dashed and dotted–dashed red lines, respectively (refer to Fig. 1). CMPs that were removed from the Premosello–Megolo profile processing are indicated with a dashed grey oval. (d) displays the crossed array method whereby the receiver lines are approximately orthogonal to each other and oriented to be orthogonal and parallel to the main strike.
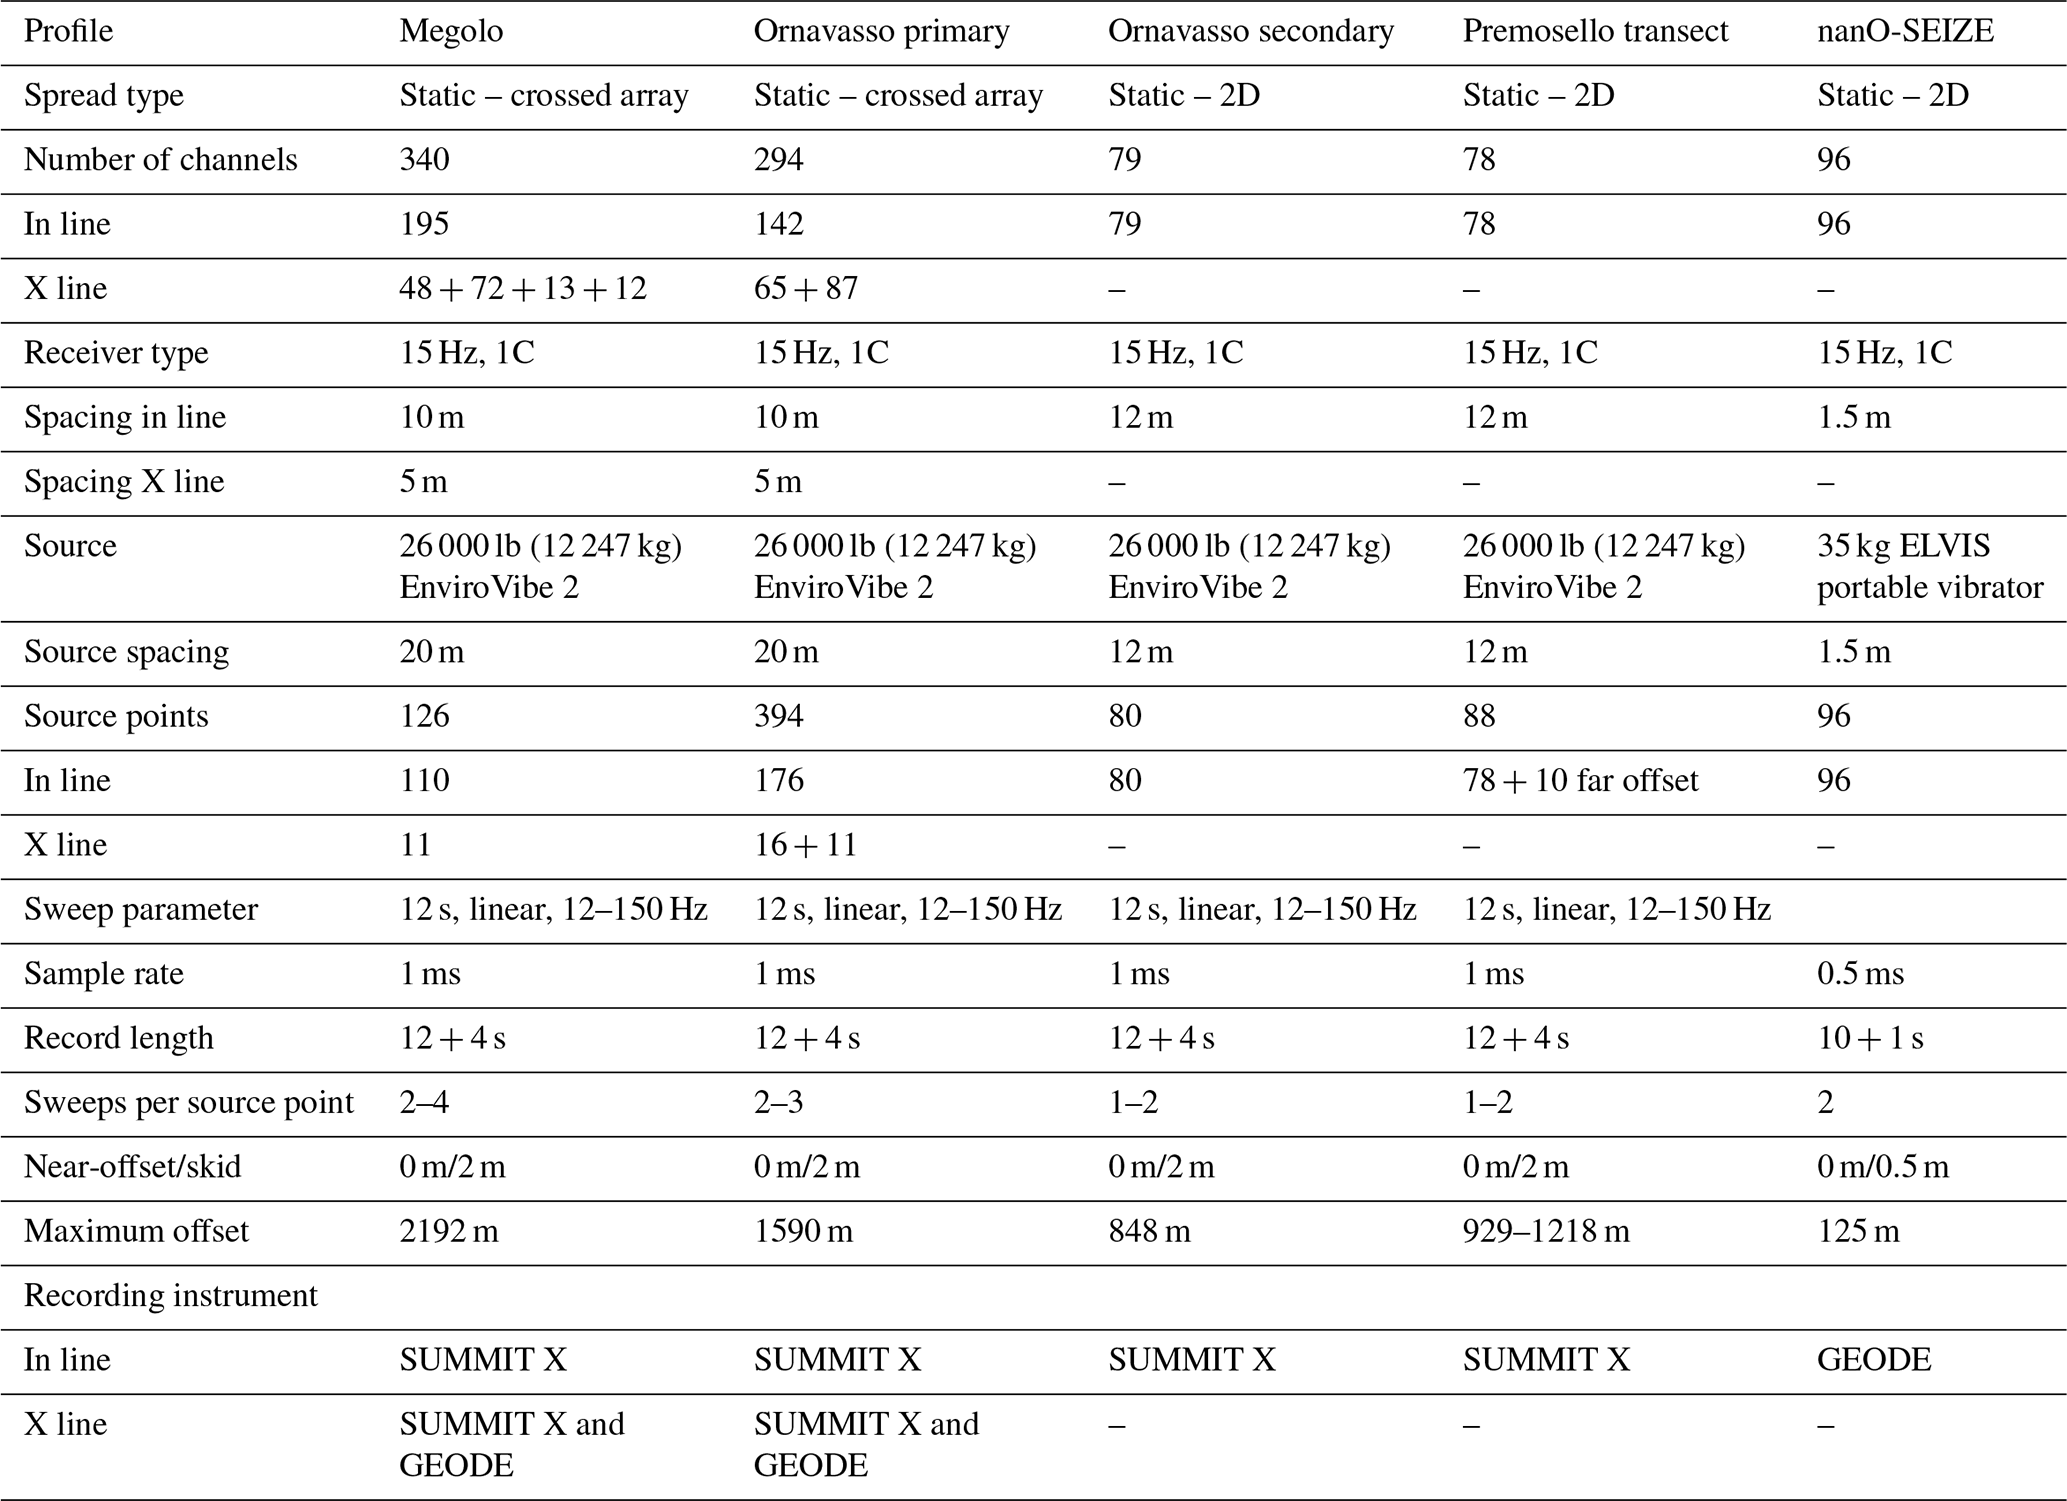
Seismic equipment and operational support for the surveys were supplied by the Montanuniversität Leoben (MUL), the University of Lausanne (UNIL), the University of Pavia, the University of Trieste, and the vibrator source supplied by Geo2X SA. Geophones with a nominal resonant frequency of 15 Hz were used in conjunction with two cabled distributed seismic systems: (1) SUMMIT X One™ system, with 240 channels (MUL) nominally spaced at 10 m along in lines and (2) Geometrics Geode system (UNIL and Geo2X), with 144 channels nominally spaced at 5 m deployed along supplementary and crosslines. The EnviroVibe produced a broadband vibroseis sweep of 12.5 to 150 Hz over 12 s. The seismic records were recorded at 1 kHz with a 4 s correlation time. This ensured the recording of both low-velocity layers of variable thickness and steeply dipping (greater than 45°) reflections that may have been produced by far-offset source points. A Pelton vibrator controller and a GISCO radio trigger were used to synchronize the vibrator sweep and the two seismic acquisition systems. A summary of acquisition parameters is provided in Table 1.
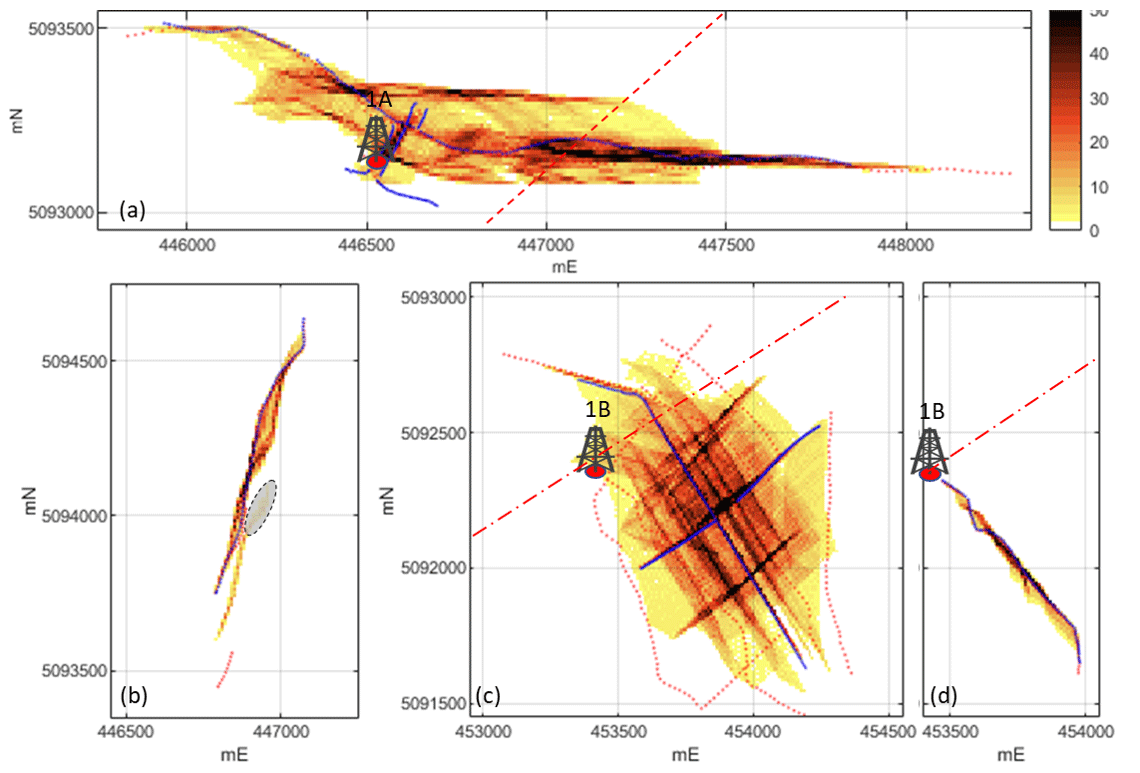
Figure 3Fold maps for (a) Premosello, (b) Megolo primary profile, (c) Ornavasso primary profile, and (d) Ornavasso secondary profile. Source and receiver locations are defined by red and blue dots, respectively, and the relative location of DT-1A and DT-1B are shown. Fold is calculated for a 10×10 m bin size. The color bar indicates the fold of each bin. All fold values higher than 50 are indicated in black.
In the anticipation of complex and steeply dipping structures, the surveys were designed to capture potentially 3D cross-dipping reflections whilst maintaining a wide-angle reflection profile orthogonal to the strike of the target structures, the Proman and Massone antiforms. This is achieved using the crossed array method (Figs. 2 and 3), whereby the principle seismic coverage across strike is attained along a central (2D) receiver line, the in line, with long offsets of up to approximately 2 km and complemented by shorter orthogonal crosslines to help constrain structural dips oblique to strike. Vibrator points (VPs) were along both the in- and crosslines, and along nearby farm tracks where possible. This greatly increases the common-midpoint (CMP) coverage, providing a sparse 3D coverage (Fig. 3). Where large segments of profile have co-located sources and receivers, the fold is as high as 70, and up to 195 in the center of the OP profile. Figure 3c shows linear areas of high fold in orthogonal orientations due to the crossed array method.
In addition to the aforementioned MOS surveys, a very shallow penetrating seismic survey, nanO-SEIZE, utilizing a 1.5 m geophone separation and a 35 kg ELVIS VII portable vibrator (Table 1) was conducted to extend the northwest extent of the OS profile. This allowed a very near-surface characterization of the immediate vicinity of the DT-1B drill site by placing a high density of sources and receivers up to the adjoining cliff face.
A standard processing sequence for the MOS datasets is applied based on parameters derived from P-wave reflection processing of the PCM transect. Importantly, this transect is processed first to understand the overlying Quaternary sedimentary cover in the Ossola Valley. Moreover, the PMC profile is the simplest of the profiles to process due to the horizontal layering of the valley infill, and it is relatively noise-free due to the profile being somewhat away from roads, railways, and the Toce River. Following this, processing flows are adapted to the more complex scenarios in Megolo and Ornavasso.
Processing typically involved the following procedures:
-
vibroseis correlation (pilot trace),
-
applying geometry to the seismic records (UTM 32 coordinate system),
-
bad trace editing,
-
trace conditioning and amplitude corrections (band-pass filtering, spherical divergence correction, and trace equalization),
-
vertical stack (stacking of shot records),
-
spiking deconvolution,
-
crooked-line common-midpoint (CMP) binning,
-
first-break picking and refraction analysis,
-
static corrections,
-
S-wave removal (time-variant bandpass filtering and f–k filtering),
-
first arrival removal (top mute),
-
normal moveout (NMO) correction and CMP stacking (NMO stack),
-
velocity modeling,
-
post-stack filtering and amplitude corrections.
The conditioned NMO stacked sections are then reviewed for the refinement of processing parameters and updating velocity models. Subsequently, flow procedures are re-run and pre- and/or post-stack time migration applied to the resulting NMO-corrected data. RadexPro© professional seismic processing software is used to process all MOS data, and MATLAB© scripts are used to develop 3D velocity models outside of RadexPro. Additional profile-specific processing, such as static corrections and velocity modeling, are described in the following sections along with the results of each profile.
5.1 Data quality and refraction analysis
Data quality for the MOS profiles is mixed, whereby the near offsets are generally of good quality and far offsets strongly affected by constant road noise. This is improved by sweeping twice (or more) at each VP. However, in the MP profile, both source and geophone coupling were variable due to the diversion around the aforementioned stormwater culvert. This resulted in variable data quality, data gaps, and low fold between 446750 and 447000 m E. In an exemplary example of good data from the OS profile collected away from noise sources, seismic refraction energy reaches the far offsets, and near-surface reflections are clearly observed between 100 and 300 ms in the raw shot records (Fig. 4). However, shot records over crystalline rock, such as the northwest end of the OP profile, no such reflections are observed.
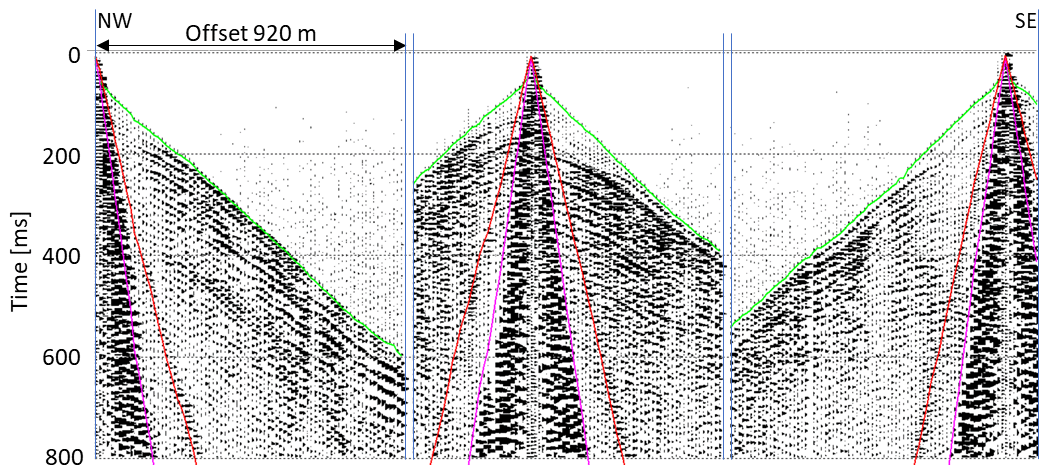
Figure 4Exemplary shot records without topographic correction from the OS profile, annotated with the first arrivals (green), the airwave arrival (330 m s−1 red), and the very slow ground roll (200 m s−1 magenta). The vertical axis is two-way-travel-time in milliseconds. Only the first 800 ms out of 4000 is shown. Trace normalization has been applied for display.
The first-break arrival times of refracted phases were manually picked for each profile and displayed in MATLAB for quality control. This, in general, showed very linear refracted phases within the valley, which is consistent with a topographically flat and homogeneous sedimentary cover. Simple refraction analysis using the generalized reciprocal method (Palmer, 1981) (Easy Refraction module; RadexPro) is performed and results in a simple two-layer case, with average velocities of 200 and 1520 m s−1, respectively, for the two layers (Fig. 5b). It should be noted in Fig. 5a that the refracted phase already arrives at the nearest receivers, indicating a very shallow interface. The two layers are interpreted to be dry and saturated sediments, respectively. The non-saturated zone above is on average only approximately 5–10 m thick (Fig. 5) and agrees with the approximate height above the nearby Toce River. Thus, the elevation and refraction static corrections were negligible for all areas. Deeper, second refractive layers, in general, were not observed, except in the MP profile, and this supports the assumption of thick valley sediment infill away from steeply dipping valley walls.
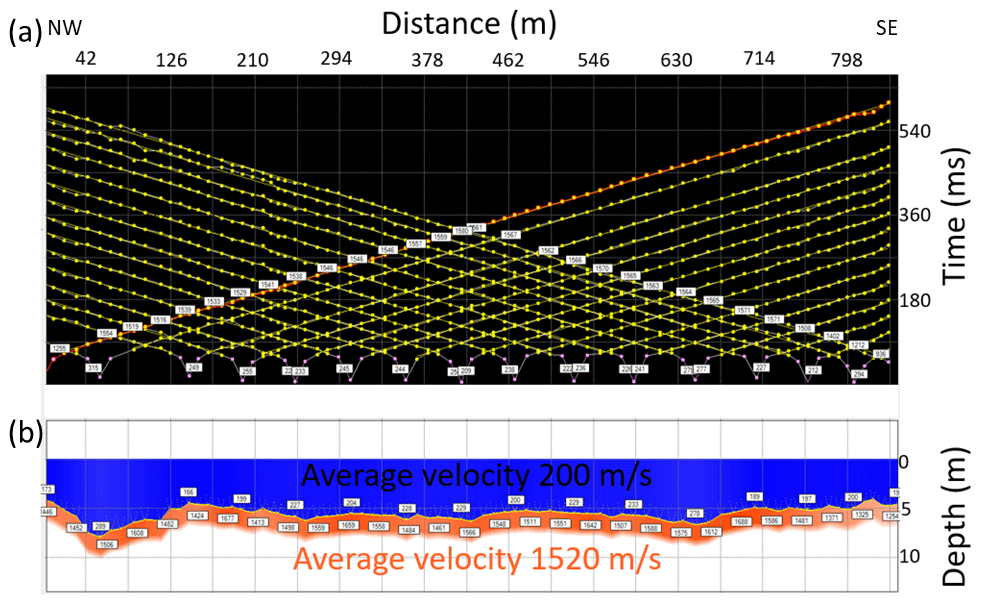
Figure 5Generalized reciprocal method of refraction analysis from the OS profile. (a) First-arrival offset-travel-time curves from every fifth source point of the Ornavasso secondary profile. (b) Two-layer velocity model derived from travel time curves in panel (a).
5.2 Velocity modeling
Velocity models are developed for each profile and are presented with the results of each profile. The classic 1D velocity semblance analysis of NMO-corrected CMP panels (e.g., Yilmaz, 2001) is not applied, as the nominal 10 m receiver separation used results in poor imaging of the first 50–100 m (100–200 ms two-way travel time). However, the basic principle of applying NMO corrections in a series of velocity panels to determine the correct stacking velocity is applied. To resolve the uppermost sediment layer, velocities from the refraction analysis are used as a starting point, and constant-velocity stacks (CVS) using a small range of velocities (1400–1600 m s−1 at 20 m s−1 intervals) centered around the first refractor velocity (determined in the previous section) are applied to the data. For the PCM profile, the optimal near-surface stacking velocity is 1480 m s−1, which is slightly slower than the average refractor velocity observed in the OS profile. To resolve horizontal reflectors below 100 ms, a series of velocity gradients is then trialed. A gradient of 0.00167 m s−1 is found to coherently resolve horizontal reflectors at times up to 500 ms (ca. 500 m) and is used for subsequent velocity models for the valley sediments and delineating the sedimentary basement contact. From this contact, more advanced velocity models are developed to account for the crystalline crustal rocks. In general, higher-velocity areas are graphically picked from the basement contact and a gradient is applied to smooth the boundary. Various boundary gradients and upper velocity limits are tested. The upper velocity in the PCM and OS profiles that returns the best images is 5500 m s−1. These simple 2D models accurately resolve the sedimentary basement contact in the PCM, OP, and OS profiles, which are generally perpendicular to the basement contact. However, the MP profile is (sub)parallel to the local valley walls, which dip to the north, and the Proman Anticline, which dips to the west. Thus, a 3D velocity model is developed for the MP profile.
5.3 Premosello–Chiovenda to Megolo
To increase the CMP coverage of the PCM profile in the south, where access is restricted (Fig. 2b), far-offset VPs are acquired past the termination of the geophone line. These long-offset VPs are offset from the projected receiver line, resulting in laterally offset CMP positions. To reduce the effects of the non-collocated CMPs, a selection of the offset-CMPs is removed before stacking. Results from the PCM profile are shown in Fig. 6. These consist of an NMO stack and a pre-stack time migration (PSTM) section, derived using a gradient velocity model, as described in Sect. 5.2. A weathered crystalline contact with a velocity of 4500 m s−1, which increases to 6000 m s−1, has been assumed (Fig. 6b). The sections are converted from time to depth (T2D) using only the gradient velocity, thus preserving the depth to the base of the valley. The velocity model is considered reliable, as reflectors within the Quaternary sediments are well imaged and typically flat-lying, with many coherent reflections down to 500 m, i.e. the base of the sediments (Fig. 6c). These sedimentary reflections often show local variation and changes in continuity, indicating potential movement within the sediments and paleo-erosion surfaces (e.g., ca. 100 ms highlighted in green). Shallow reflections in the southern end of the profile are affected down to approximately 300 ms by the large and lateral displacement of CMPs. Automatic NMO stretch-muting has also been applied in the upper portion of this zone and along the profile, reducing the resolution in the upper 50–100 ms. The sedimentary bedrock interface is generally well imaged (highlighted), indicating a wide U-shaped valley, the center of which is at approximately a 300 m profile distance, which is equivalent to the center of the Ossola Valley at this location.
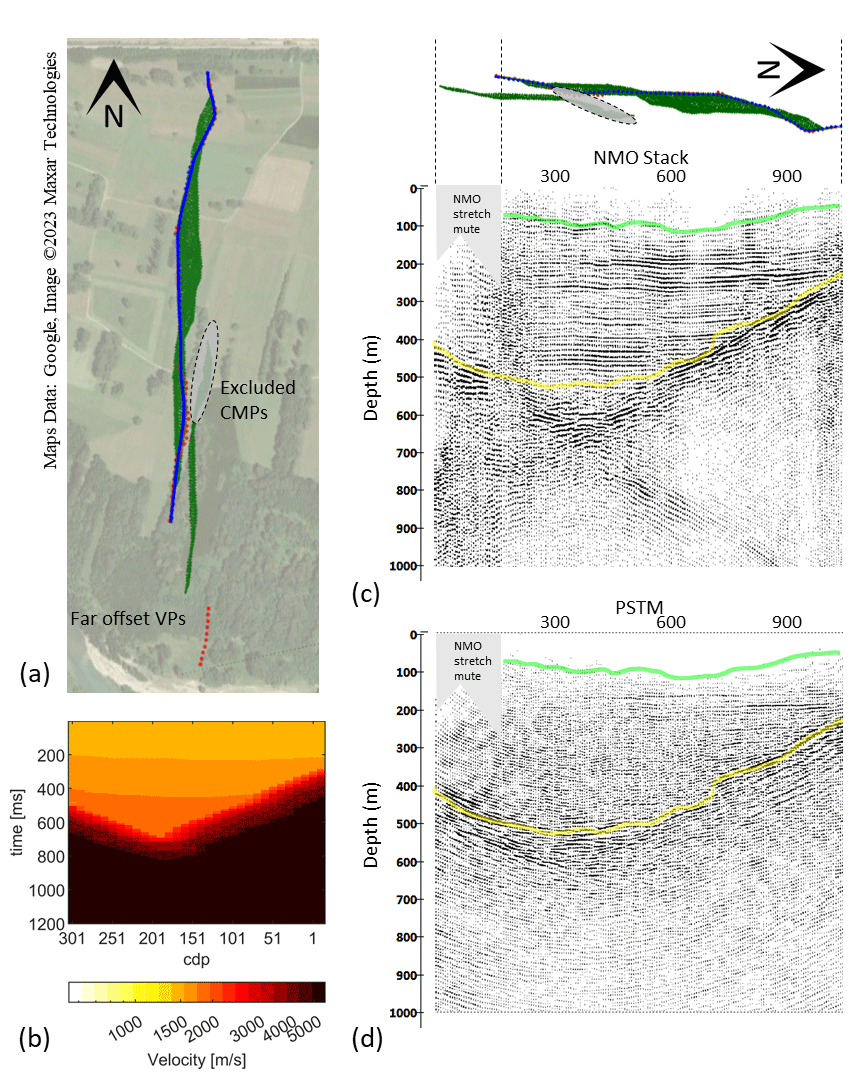
Figure 6Premosello–Chiovenda-to-Megolo seismic section. (a) CMP map overlaying the aerial photo showing the extent of the receivers (blue dots) and source points (red dots), CMPs (green dots), and CMPs that are excluded from the stack (grey oval). (b) Velocity model showing a gradient from 1480–1850 m s−1 down to 500 ms in the sedimentary deposits and a weathered contact from 4500 to 6000 m s−1. (c) NMO stack derived from the velocity model in panel (b). The survey geometry is displayed above the profile indicating where the out-of-plane CMPs have a negative influence on the stack and where fold decreases at the edges of the profile. (d) Pre-stack time migration derived from velocity model. (b) Low-fold and offset CMPs in the south end of the profile result in many migration smiles. The green line indicates a potential paleo-surface within the Quaternary sediments, whilst the yellow line is the contact between the sediments and valley basement rocks.
PSTM imaging (Fig. 6d) improves the coherency of the Quaternary sediment crystalline interface and structure of the U-shape valley. Coherent reflections below this contact within the crystalline basement, however, are not observed, and migration smiles dominate below 600 m.
5.4 Megolo
The Megolo DT-1A drill hole is planned to intersect a crystalline rock sequence of garnet-bearing metagabbros, charnockitic granites, pyroxenites, and potentially peridotites within the IVZ. The dominant metagabbro (pyriclasite in Fig. 1d) dips approximately 20° east-southeast and forms part of the Proman Anticline (Fig. 1c). The survey consists of a central 2.3 km long receiver line (in line, across strike) that follows the F. M. Beltrami Road which connects Megolo to Pieve Vergonte and Ornavasso and a section of old disused road that crosses a water channel to the east of Megolo di Fondo as well as two closely spaced short crosslines placed within the nominated DT-1A drill site (Fig. 7a).
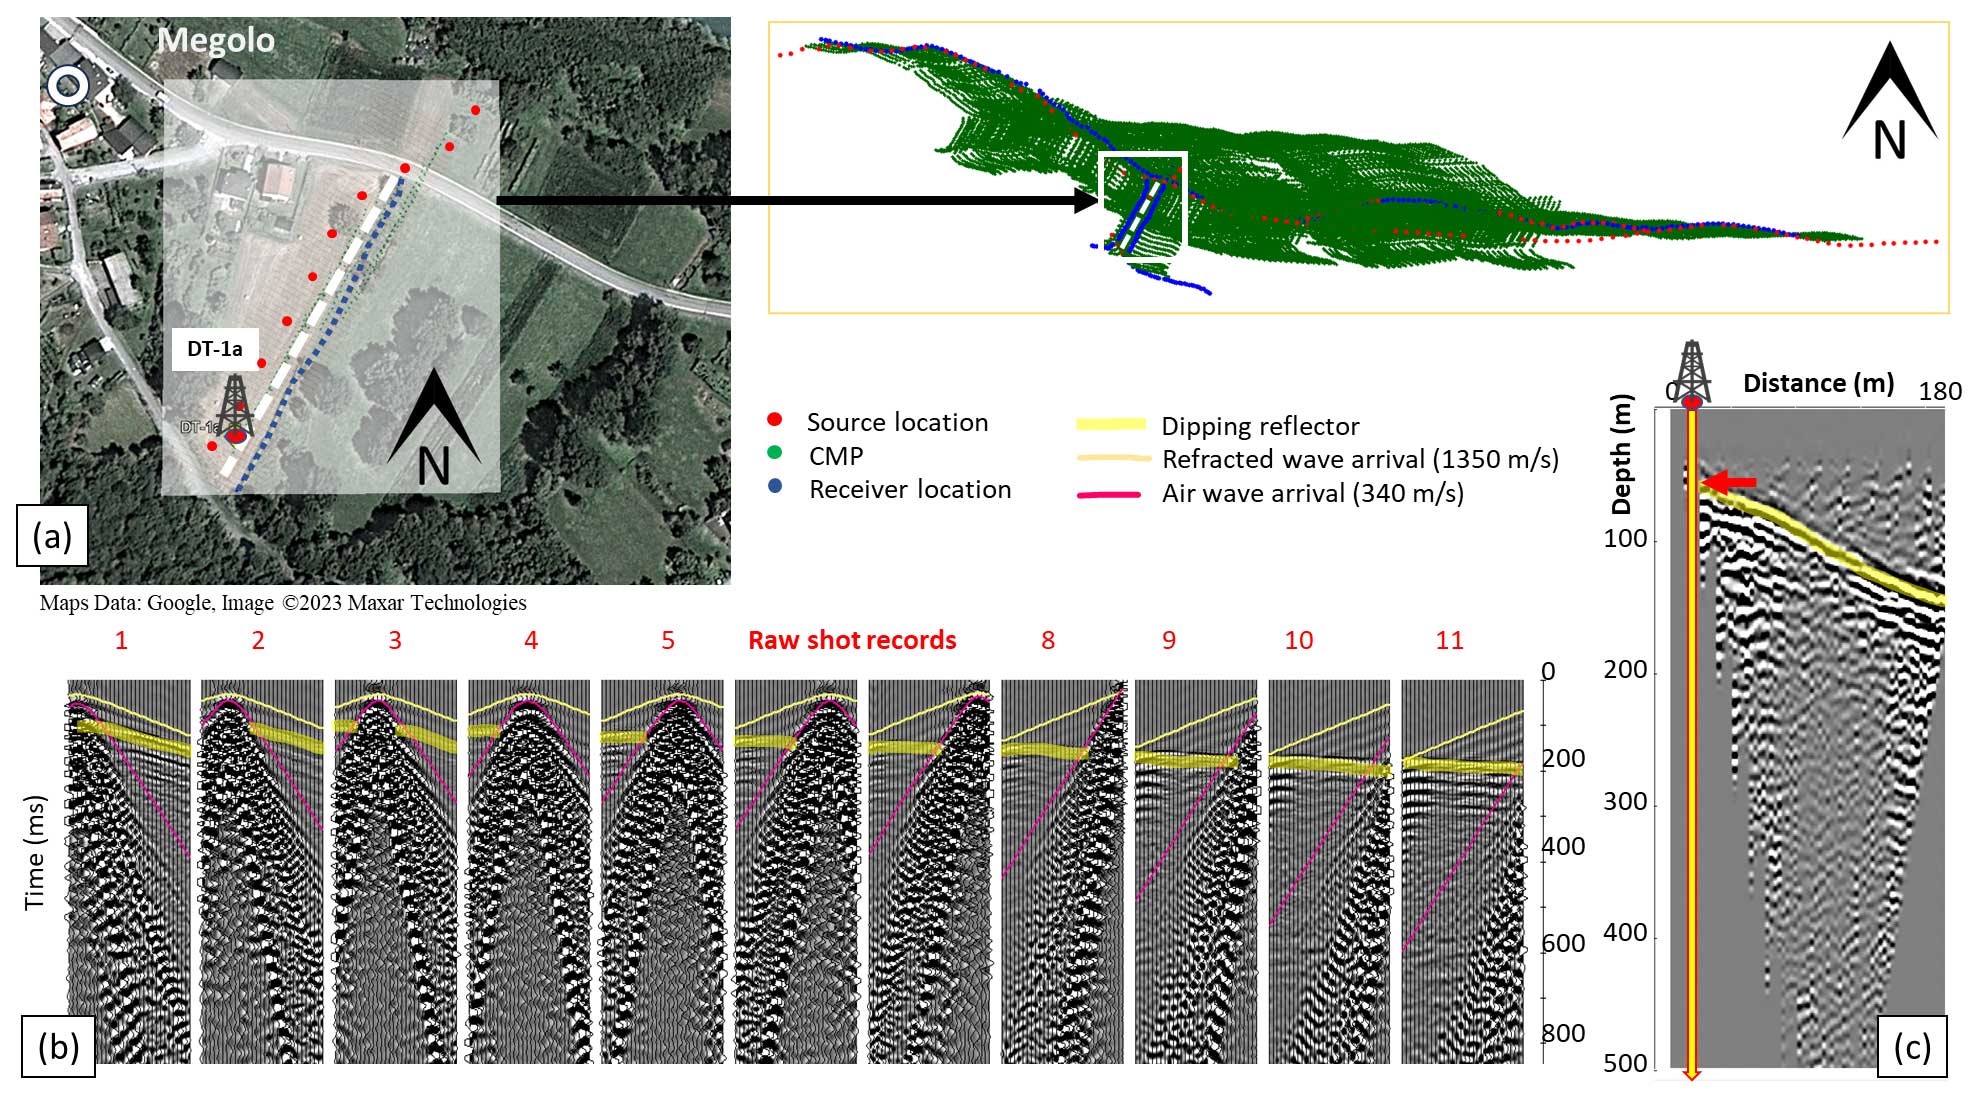
Figure 7Megolo high-resolution (5 m geophone spacing) crossline profile. (a) Plan view of DT-1A site area and the short crossline. (b) Raw shot records after correlation of the vibroseis sweep. The first-arrival (yellow), airwave (magenta), and shallow dipping reflector (highlighted in yellow) are clearly visible. (c) NMO reflection profile after simple processing. A near-surface dipping reflector (highlighted in yellow) has been imaged at a depth of 45 m, dipping at 30° to the north.
5.4.1 X line
Along the crosslines, the data are of extremely high quality due to the short offsets and excellent coupling of both the EnviroVibe and geophones, with a shallow dipping reflection that is very apparent in the raw data (Fig. 7b). The data are processed to produce a simple depth-converted NMO stack (Fig. 7c). Again, due to stretch-muting and the survey geometry, the upper 100 m of the section has poor resolution. However, the processed stack locates the prominent reflector at 45–50 m depth below the proposed drilling location dipping approximately 30° toward north-northeast. This is interpreted as the contact between the Quaternary sediments and metagabbros of the valley basement rocks, which outcrop some tens of meters south of the drill site (Fig. 2). When this section is placed in line with the PCM transect (Fig. 8), it is obvious that the dipping reflector conforms with the glacial valley structure seen in the PCM transect. Again, reflections within the crystalline basement rocks are not well observed, partially due to the short extent of the crossline profile, although it is expected that more energy is transmitted through the Quaternary sediment–crystalline basement interface in this area due to the better coupling and thinner sedimentary cover.
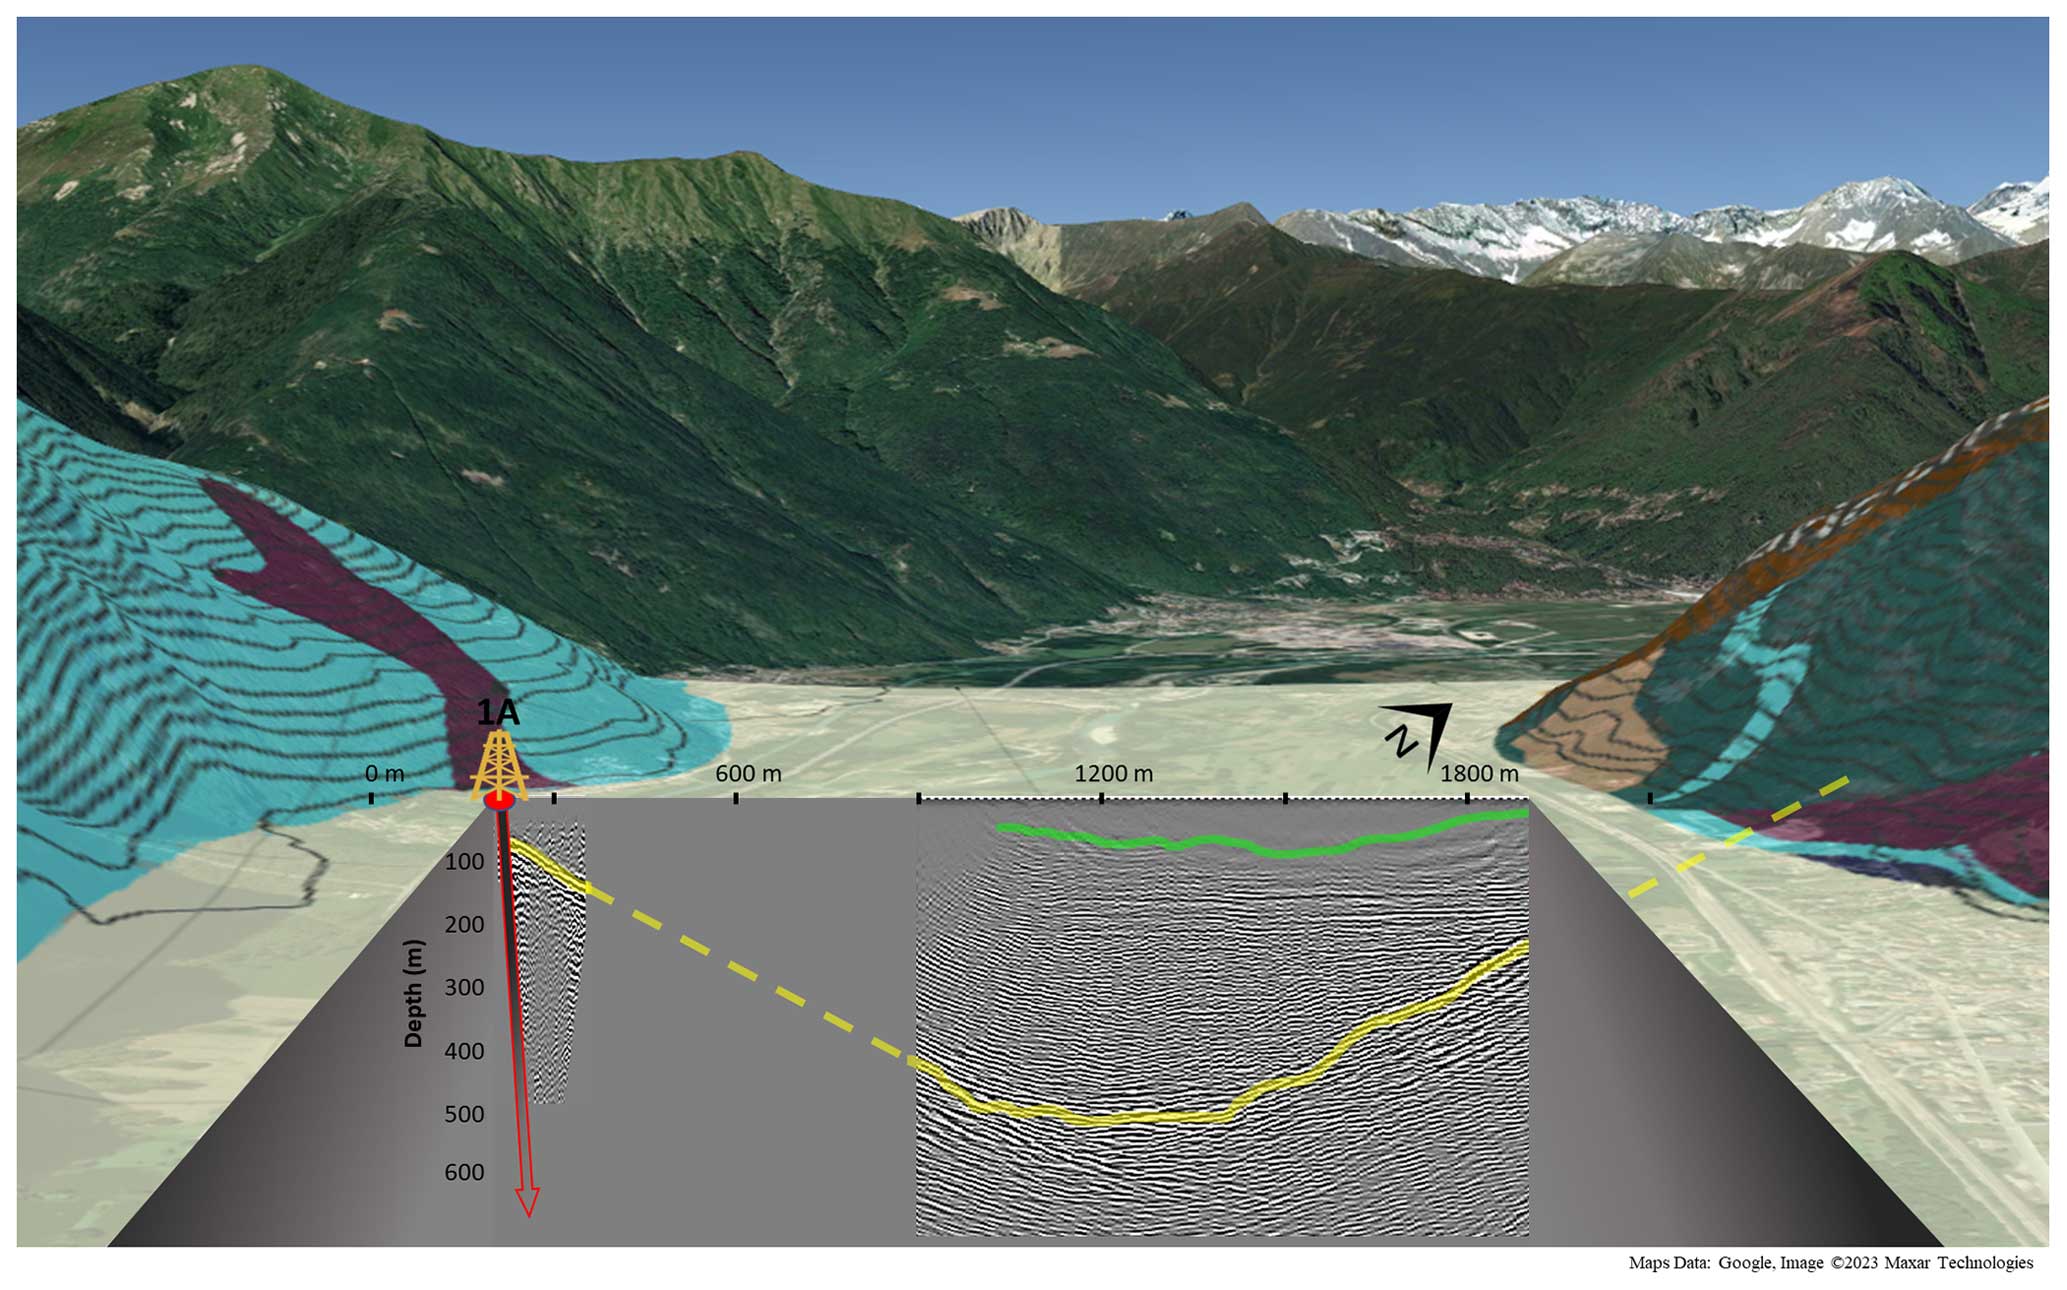
Figure 8Premosello–Chiovenda-to-Megolo transect and Megolo crossline profile projected into a cut-through of the Ossola Valley. The geology, yellow, and green lines are as described in Figs. 1, 5, and 6.
5.4.2 In line
Refraction depths and velocities varied from west to east with variable near-surface conditions. Additionally, the western end of the profile is slightly topographically elevated and crosses over a shoulder protruding from the southern valley flank.
Refraction analysis of the Megolo in line profile is shown in Fig. 9. This clearly shows the elevated high-velocity section in the west corresponding to the subsurface extension of the southern valley flank, the slow valley sediments in the center, and a higher-velocity near-surface feature at the eastern end of the profile. Corresponding elevation and refraction static corrections are applied to the inline dataset. Processed results are shown in Fig. 10 and consist of NMO, PSTM, and post-stack time migration (PostSTM) sections presented in two-way travel time. Within these processed sections, the contact at the base of the Quaternary sediments is reasonably well mapped and agrees with the refraction analysis (Fig. 9) and the assumption that the crystalline rock is closer to surface in the west and gently dips to the east. At the eastern end of the profile, a shallow horizontal reflector is prominent in the PSTM image (Fig. 10b and e), coinciding with the higher-velocity zone exposed in the refraction analysis. Here a complex overburden is also observable. Within the crystalline rock, there is little reflection energy received, and each of the processed sections reveals different seismic features. The NMO stack maps the strong reflection from the sedimentary basement well, indicating discontinuities and terminations (Fig. 10a and d). Below this, however, the stack is particularly bland. The PostSTM profile (Fig. 10b and e) similarly shows little below the Quaternary–basement contact and progressively smears the seismic energy into smiles beyond 500 ms, an artifact of the migration process due to a lack of coherent reflectors being present. However, the seismic character is consistent for approximately 400 ms below the sediment contact, indicating a shallow dip to the east. The PSTM profile (Fig. 10c and f) over-migrates the near-surface, with many smiles evident; however, a weaker shallow (100 ms) reflector in the east has become more coherent (marked with a blue arrow Fig. 10d–f), and the dipping seismic character has been enhanced in the west updip of the origin of the crystalline rock.
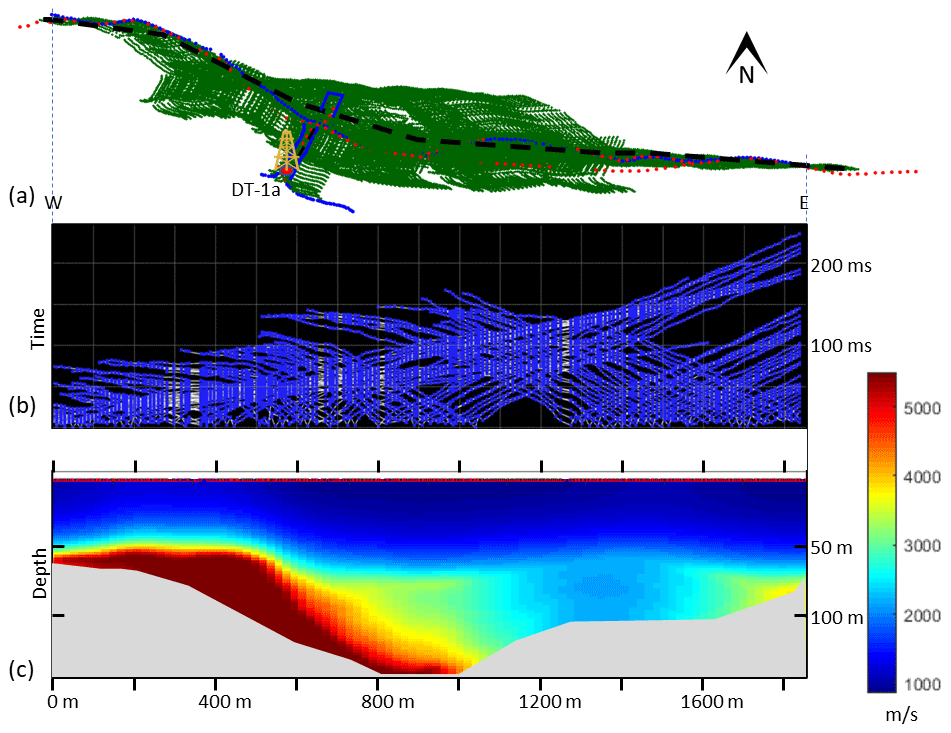
Figure 9Megolo refraction tomography analysis. (a) CMP (green) plot of the Megolo survey, including data from all receiver lines (blue). The refraction profile is taken along the main receiver line approximated by the dashed black line. (b) Travel time plot of the first arrivals for all shot records along the main profile. (c) Travel time tomography results showing very slow sediments (blue) overlying fast hard rocks (red) in the west and a valley structure to the east with faster sediments. Grey-shaded area depicts the area with no ray-path coverage.
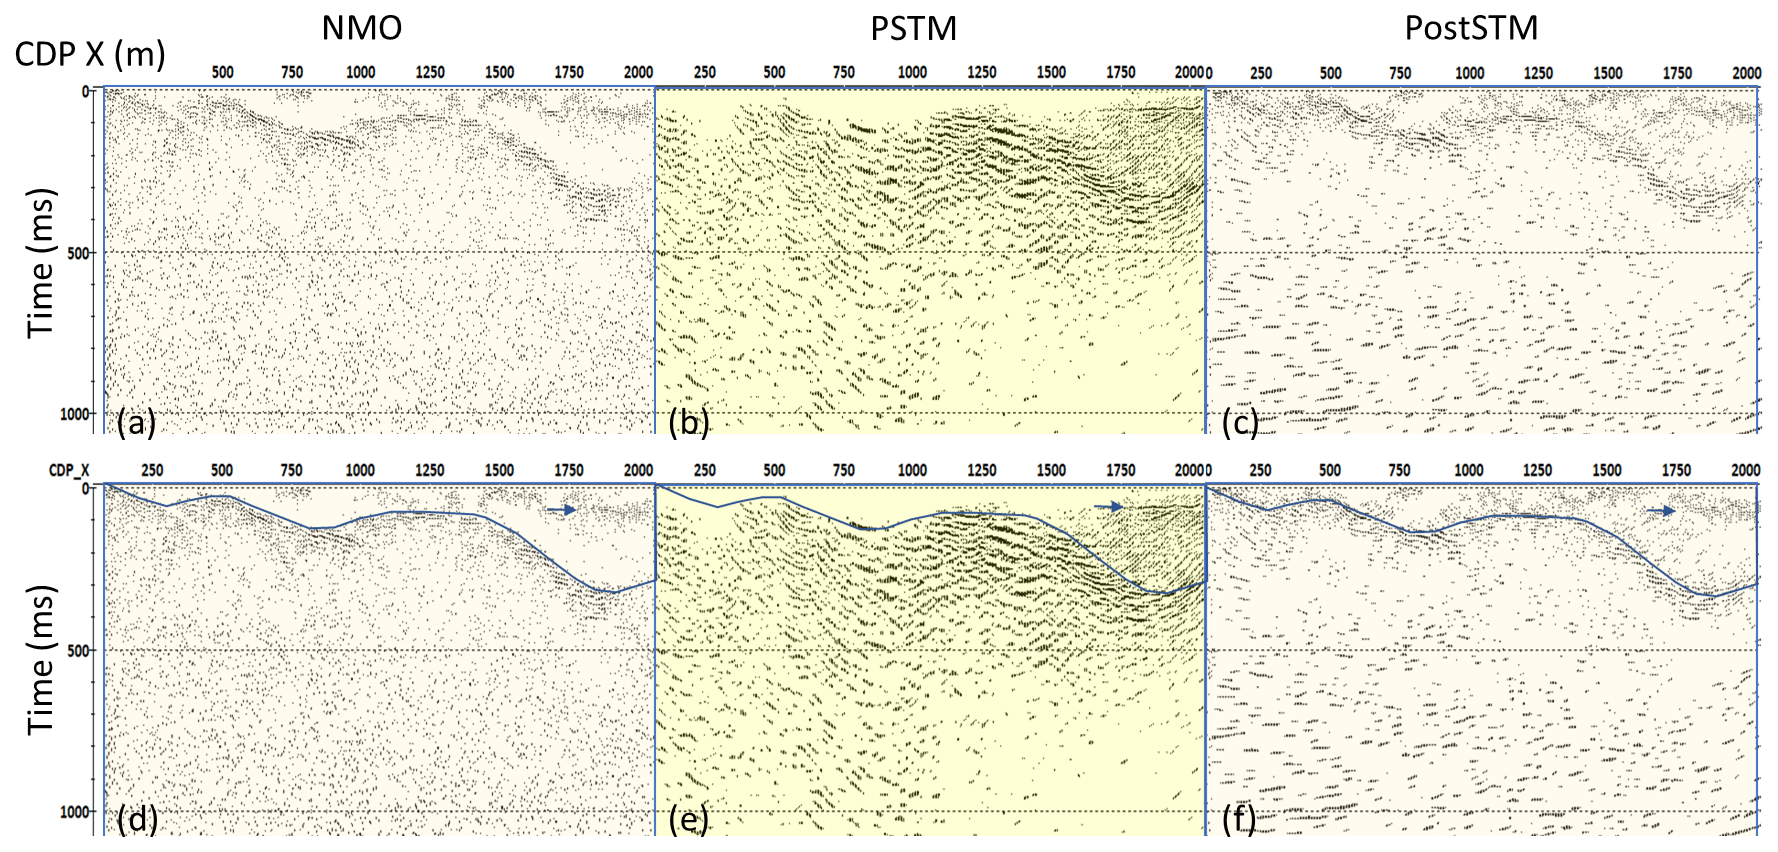
Figure 10(a) NMO stack, (b) PSTM, and (c) PostSTM profiles of the Megolo inline seismic survey. Panels (d), (e), and (f) show annotated plots in panels (a), (b), and (c), which show the depth to the local crystalline basement rocks (blue line). A shallow reflector within the sediment cover is indicated by a blue arrow. Note that the profiles are shown oriented west to east, as acquired in the field.
The strong velocity contrast between the sediments and crystalline rocks distorts T2D-converted images and imposes an interface in the depth–velocity model; thus, a 20° southeast dipping smoothed velocity gradient (1500 to 6500 m s−1) from the base of the sediments until 2500 ms is used. Depths to the Quaternary–metagabbro contact are assumed accurate, although depths below this are likely underestimated and features within the crystalline rocks deeper than indicated.
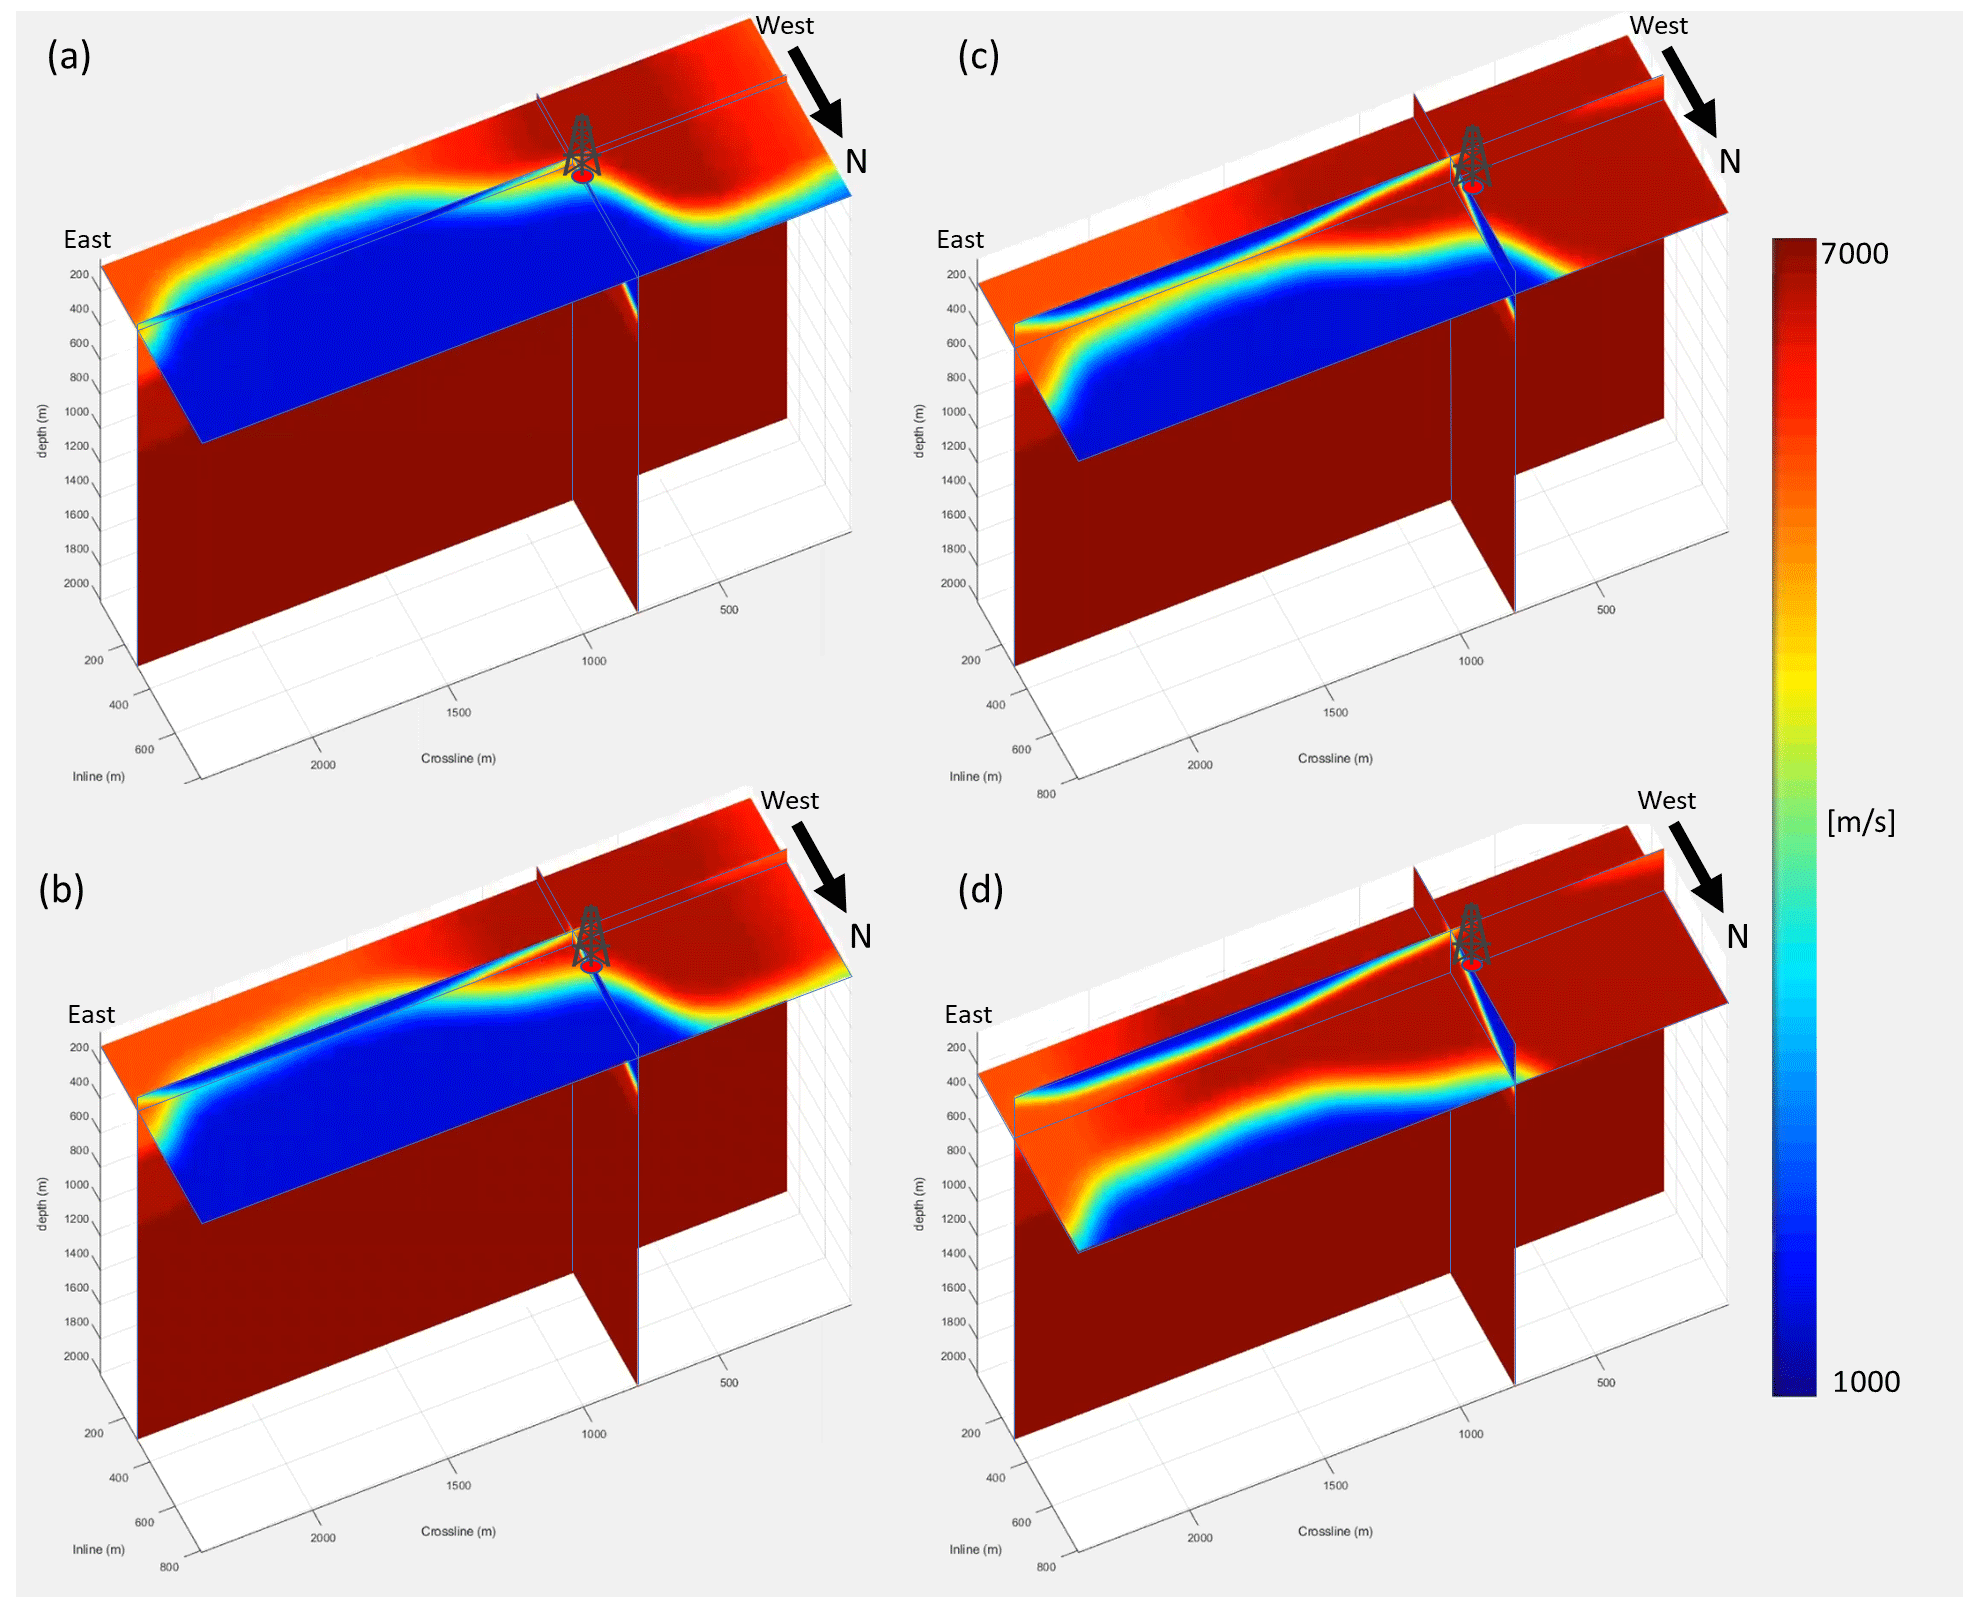
Figure 11(a) Depth slices through the Megolo 3D depth velocity model showing the near-surface 50 m topology transition from slow (blue) valley sediments to fast (red) metagabbro–pyriclasite rocks. The valley walls are modeled as dipping 30° to the north, as indicated by the sediment–metagabbro interface (yellow contour) progressing northward in depth slices of (b) 100 m, (c) 200 m, and (d) 300 m. Also modeled are the westward dipping metagabbros, with a gradient from 6000–7000 m s−1 (light red to dark red) also visible in panels (b), (c), and (d). The velocity model is displayed as oriented obliquely east to west looking from the Ossola Valley to the south.
An attempt at improving imaging within the crystalline basement is made using the MOS sparse 3D seismic data collected. To generate a 3D depth–velocity model representative of the sedimentary cover and basement topography, the valley boundary is determined from aerial photographs (Google Earth) and topographic maps, and the slope of the valley determined in the short crossline is used to extend the crystalline structure below ground level. A lack of coherent reflectors within the crystalline rock mass prevents the performance of a classic semblance velocity analysis, and a velocity of 7000 m s−1 is used as a representative metagabbro velocity. This velocity is established by a field sample analysis and values from the literature (e.g., Khazanehdari et al., 2000; Salisbury et al., 2003; Weiss et al., 1999). To avoid pre-imposed sharp boundaries in reflection images, the velocity model is smoothed. The complete 3D depth–velocity model is shown as depth slices in Fig. 11a–d.
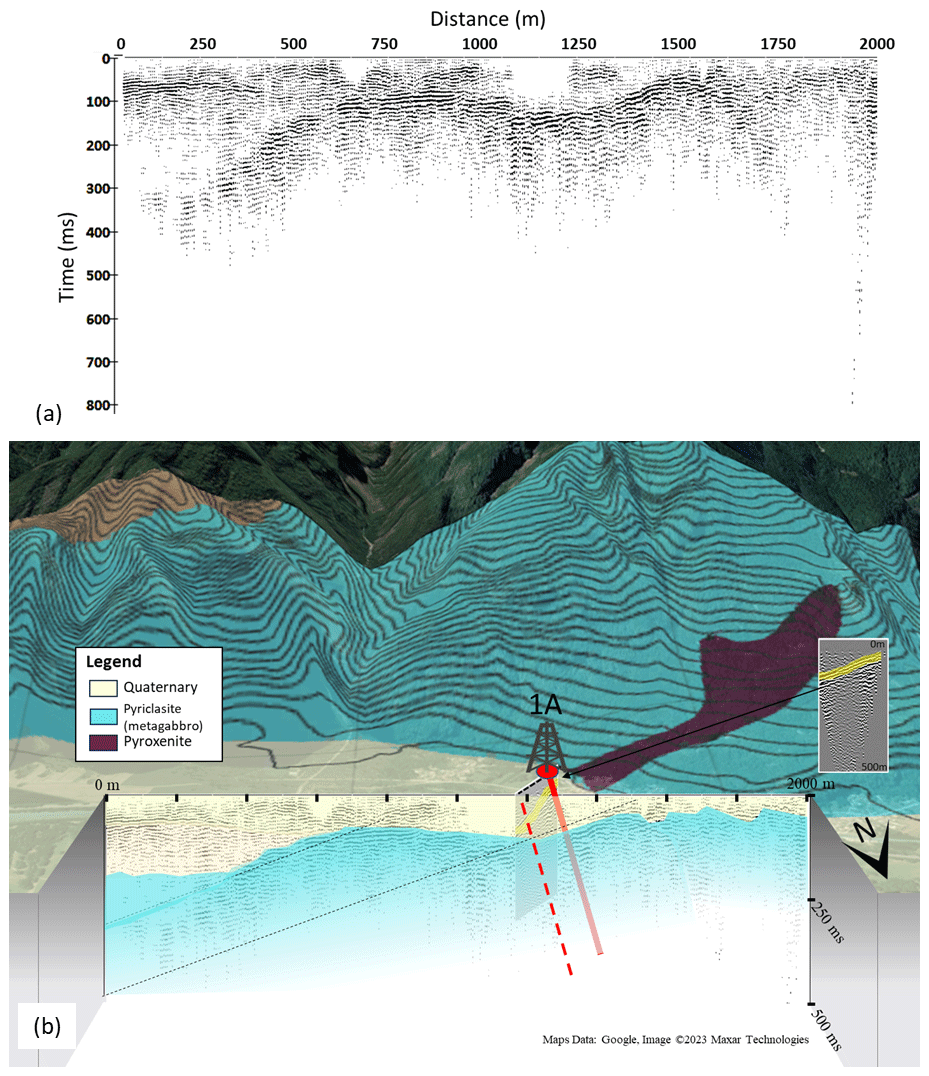
Figure 12(a) Megolo primary profile using the 3D velocity model developed, predictive deconvolution to remove near-surface multiples, and post-stack FX deconvolution to improve coherency of reflection events. (b) Megolo in line, post-processed, time-to-depth-converted NMO stack, inlaid onto the Ossola Valley with 3D topography and geology displayed. The general dip of the metagabbro (dashed light-grey line) conforms with the prominent dip of the metagabbro mapped at approximately 21°. For reference, the Megolo crossline profile (refer to Fig. 6) is displayed as an insert (right) and as an inlay in oblique view to the primary inline. The location and orientation of the proposed of DT-1A drill path are indicated as a solid red line, and its location, relative to the inline profile, is indicated as a dashed red line.
Additional processing is applied to the NMO data using the 3D velocity model developed, predictive deconvolution to remove near-surface multiples, and post-stack FX deconvolution to improve coherency of reflection events. The advanced processing greatly improves imaging of the sedimentary crystalline basement contact, sedimentary layering, and the structural dip of the metagabbro facies. This image (Fig. 12) is offset approximately 100 m north of the planned DT-1A location and inserted into a combined topographic and geologic collage.
5.5 Ornavasso
The DT-1B drill hole at Ornavasso targets the center of the tightly folded Massone Antiform (Fig. 1) to intersect metasediments; amphibolite; and, potentially, metagabbro units. An irregular sparse 3D survey pattern was used (Fig. 2), consisting of a long central primary receiver line across strike, two short receiver crosslines, and multiple VP lines on and around the receiver lines wherever access was possible. Near the end of the MOS campaign, a second 2D line, progressing away from the DT-1B drill site and parallel to the OP line as well as a short very high-resolution profile (nanO-SEIZE) across the DT-1B drill site were acquired. The drill site is located within close proximity to a near-vertical cliff face, exposing metasediments and amphibolites.
5.5.1 Secondary line
The OS profile is processed first due to its high data quality, as it is away from the main road, and its proximity to DT-1B. The imaging results are shown in Fig. 13. The results clearly show multiple flat-lying to sub-horizontal reflectors in the first 250 ms. These are associated with the valley sediments, which seemingly do not reach the northwest edge of the profile and roughly terminate at a 45° angle from the start of the profile (Fig. 13a and b). This termination line is the basis for a simple steeply dipping layer velocity model (Fig. 13c), assuming that the crystalline valley walls are directly to the west-northwest of the profile. This velocity model is applied to produce time-to-depth-converted NMO, PSTM, and PostSTM profiles (Fig. 13d and e). Each profile shows different seismic features, with the sediment layers having been enhanced in the migration profiles; however, due to the lack of seismic coverage at the edge of the profile, the migration process smears energy at the edge of the profile and falsely enhances dipping events, and the seismic characteristics pertaining to the terminating western edge are easier to interpret in the NMO stack. A broader-scale interpretation of the OS profile is conducted using the results of the nanO-SEIZE and OP profiles.
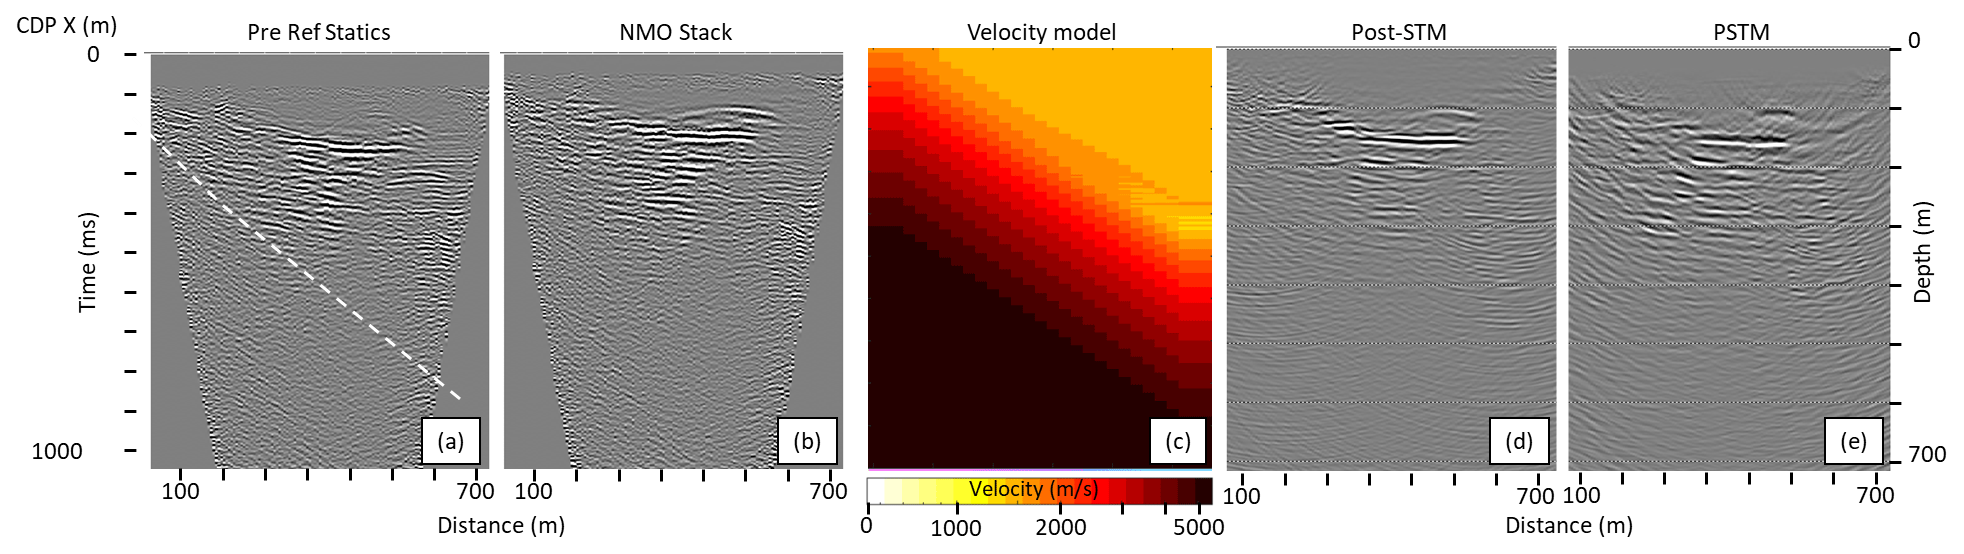
Figure 13Ornavasso secondary profile constant velocity NMO stack (a) before and (b) after the application of refraction statics; (c) smooth-gradational-dipping (45°) velocity model for stacking, migration, and T2D conversion; and (d)–(e) T2D-converted PostSTM and PSTM profiles after the application of the velocity model in panel (c).
5.5.2 The nanO-SEIZE profile
The nanO-SEIZE profile is a short, very high-resolution (Table 1) north-northwest extension of the OS profile up to the cliff edge of the DT-1B drill site. The resulting NMO profile is shown in Fig. 14. Thickness of the sedimentary cover at DT-1B is indicated as being 30–50 m thick at 40 m profile distance (Fig. 14c). Additionally, it is ascertained that the near-surface crystalline rock dips at approximately 22° and then terminates at about 100 m profile distance, where an internal reflection within the crystalline structure is observed. This termination indicates a very steep progression of the valley walls at this location. A high-energy near-surface reflection causing a large step in the near-surface reflections is evident in the data between 0 and 12 m. This is interpreted to be a block or rock debris from the adjacent cliff face. Many diffraction tails observed as very steeply dipping events are evident in the profile and indicate the presence of either near-surface point sources, such as buried boulders, or sharp edges.
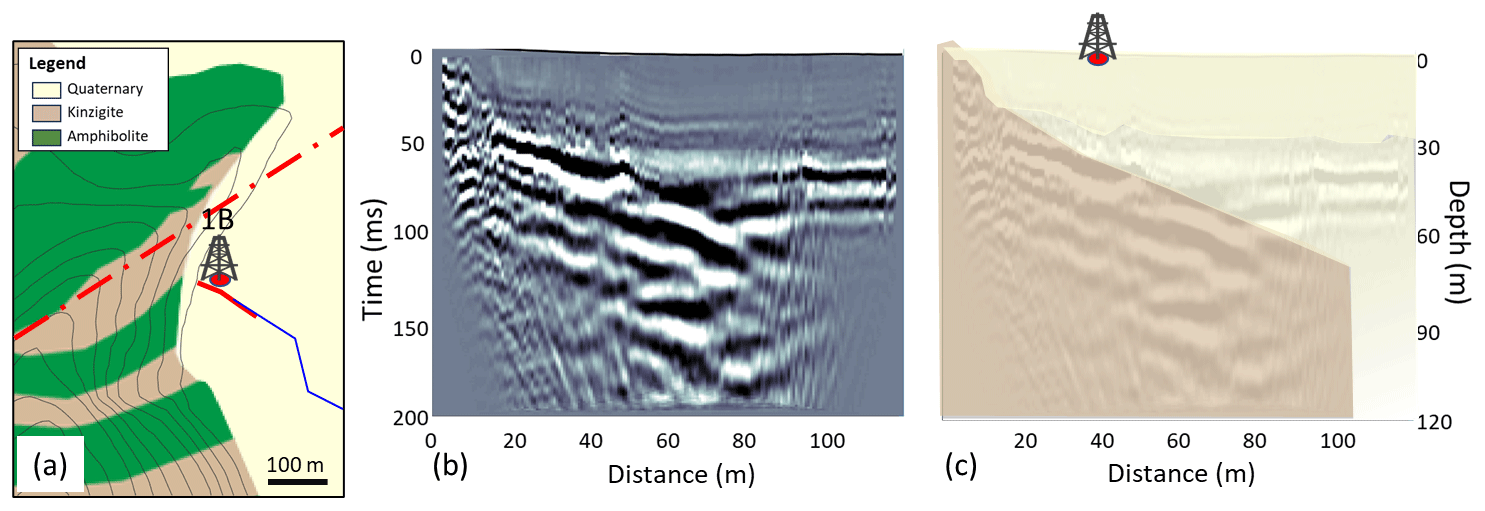
Figure 14Results of the nanO-SEIZE profile collected at 1.5 m geophone spacing using an ELVIS VII wheelbarrow 35 kg vibrator. (a) Planned location of DT-1B in relation to the Massone Antiform (Fig. 1) and steep topography. (b) CMP stack. (c) Interpretation overlay showing the depth extent of Quaternary sediments (yellow) and underlying kinzigite.
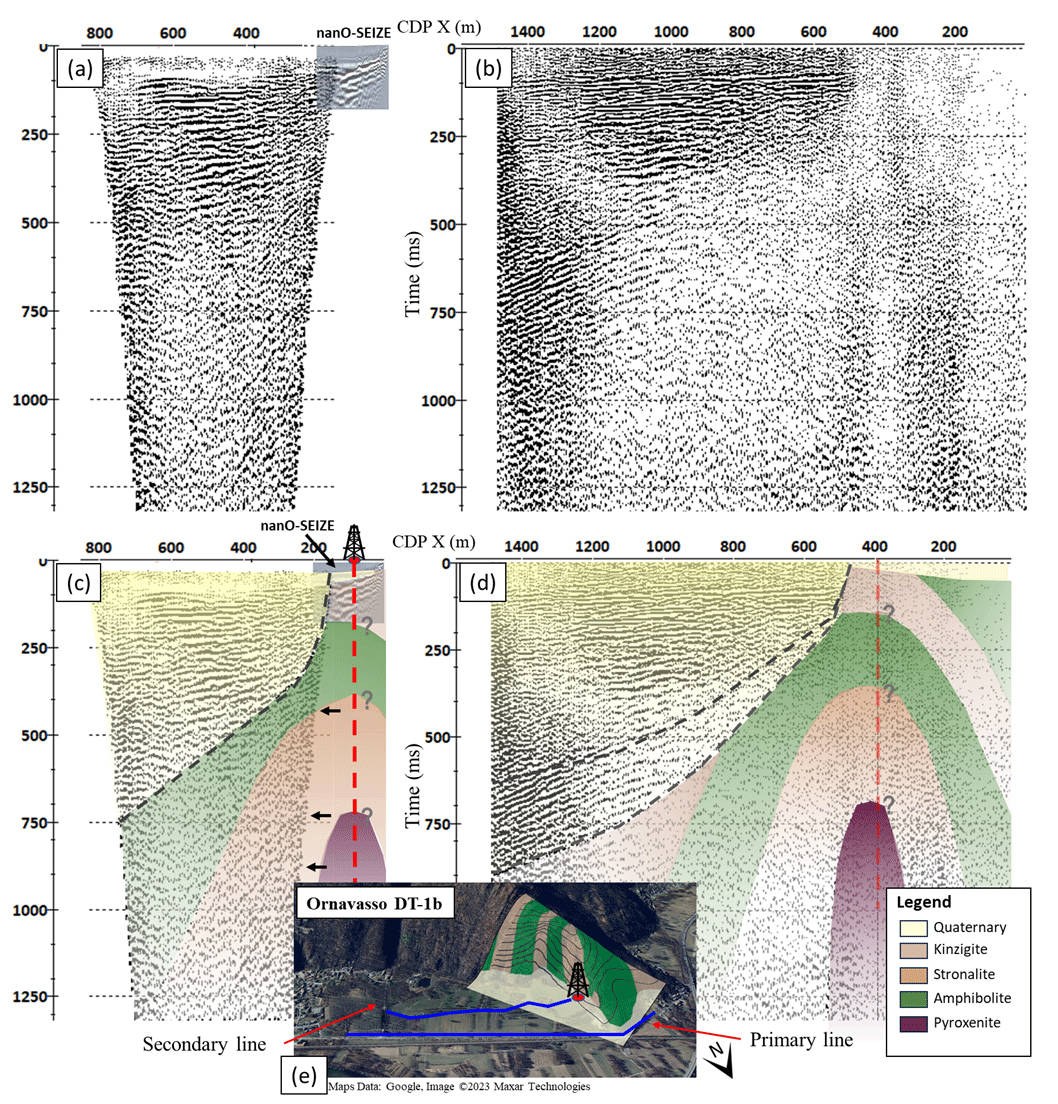
Figure 15Reflection profiles of (a) the Ornavasso secondary and nanO-SEIZE profiles and (b) the Ornavasso primary profile after CMP stacking. Panels (c) and (d) include an interpretation overlay showing the Quaternary sediments as yellow, whilst the expected crystalline sequences of the Massone Antiform are shown as green, pink, and purple colors (Legend 2). The dashed black lines indicate the boundary between the valley sediments and Massone Antiform units. Black arrows in panel (c) identify diffraction tails that are synonymous with a steeply dipping irregular surface. For reference, the geographic location of the seismic lines is indicated in panel (e), with DT-1A located at the near-vertical western boundary of the secondary line.
Combining the results of the nanO-SEIZE and OS profiles in Fig. 15a shows a very good continuation of the near-surface reflections and agreement of the general interpretations observed in both profiles. These observations are also supported by the results of the OP profile.
5.5.3 Primary line
The OP profile is processed using crooked-line geometry with a swath of 50 m to increase the CMP fold with data from nearby VPs. Although data quality suffered from traffic noise and required significant trace editing, energy from the EnviroVibe over two sweeps is sufficient to maintain energy for up to 1200 m offsets. Elevation and refraction static corrections were minimal, as the Ornavasso site is in a flat open part of the Ossola Valley (Figs. 1 and 2). Processing adapted the parameters and velocity model determined from the OS profile. The results are similar to that of the OS profile, with, however, some lateral coverage over the outcropping Massone Antiform. The OP and OS T2D NMO profiles have been interpreted together in Fig. 15, whereby the assumed lithologies of the Massone Antiform have been overlaid. There is a clear termination, observed as a change in seismic character, of the Quaternary valley sediments at the western end of the profiles where metasedimentary rocks outcrop. The sediments within the valley are largely horizontal, showing local variability and character changes with depth. There is seemingly no sharp reflector at the Quaternary metasediment interface like that observed in the PMC transect. This is likely due to a steeper profile of the valley walls. The crystalline section is indicated by a change in seismic character, with the presence of scattered energy and lack of specular reflections. Inference of any lithological changes within this section is speculative and interpretation can only be guided by a priori knowledge (expected geology) and the existence of diffraction events such as those highlighted by the arrows in Fig. 15a, which is evidence of steeply dipping irregular surfaces. Like the depth observations in Megolo, the smoothed gradational velocity model used for T2D conversion in Ornavasso is assumed to have accurately determined the depth of the Quaternary sediments; however, any observations within the crystalline section are underestimated in depth.
A large contrast in the seismic response between the Quaternary valley sediments and the Permian basement metasediments is observed throughout the MOS profiles. Within the sedimentary infill, horizontal reflectors are prominent, and one would expect a simple infill of the last glacial cycle to be preserved; however, the layering is quite irregular and onlapping horizontally, which is indicative of thick lacustrine proglacial sediments from preserved older fills and evidence of paleochannels from the Toce River meandering. These soft sediments are in high acoustic impedance (AI) contrast to the basement rocks, resulting in a strong reflection at the contact, which is well observed in the PMC transect as well as the Megolo crossline extension. The shape is consistent with a wide U-shaped glacial valley with its trough at the center of the Ossola Valley, and the bottom is estimated at approximately 550 m (e.g., ∼ 300 m b.s.l.). However, whilst the high AI sedimentary–basement boundary results in a clear definition of the glacial valley, there is a lack of coherent specular reflections within the basement rocks, which is problematic in the MOS data and quite typical of crystalline environments (e.g., Salisbury et al., 2003). The problem is primarily due to the very low AI contrast of conformable boundaries within the lower crustal Ivrea rocks, which generate very weak reflections, with reflection coefficients of less than 0.05 for Ivrea metagabbros and metasediments (Barberini et al., 2007). Accordingly, very low-reflectivity features within the crystalline basement will need to be extensively laterally continuous, at least a Fresnel zone width (ca. 200 m at 50 Hz, 5500 m s−1, and 500 m in depth), and be no more than moderately dipping (ca. 35°) to be observed within the seismic sections. Such events can only be observed in the primary Megolo profile, where the Proman Anticline is known to be broad and dipping approximately 20° east-southeast. This is observed in the western end of the profile, where the target rocks are closer to the surface and exhibit a shallow east-dipping fabric. Any highly dipping (> 45°) metasedimentary layering, such as that expected in the Massone Antiform, cannot be significantly imaged by the surface seismic reflection method below shallow depths. In such instances, we rely on secondary geological features within the crystalline basement rocks to ascertain the geological structure. Only features with high contrast to the surrounding rock mass are expected to produce observable reflections, such as cataclastic and fault zones, large open fractures or fracture sets, or sharp terminations. Sharp terminations are recognized by diffraction tails, such as those detected in the western edge of the Ornavasso secondary profile, and anomalies such as small fault/joint offsets or apexes and terminations of continuous reflectors may be evident in the Ornavasso primary profile through the recognition of weak diffraction events. However, there are no shallow-dipping strong, short, continuous reflectors observed in any of the crystalline sections in all profiles, indicating that there are likely no major cataclastic zones, faults, or fracture planes with open porosity at shallow angles. We, however, cannot exclude the possibility of such zones and structures at high angles. These commonly exhibit as dislocated reflections (faults), often separated with null-energy zones. Small dislocations, with very limited null zones, can be observed in the MP profile (Fig. 12a), and it would be reasonable to assume the presence of high-angle faults and fractures in Megolo.
The high-resolution MicrO-SEIZE active seismic campaigns have been carried out to characterize the subsurface structure at two planned borehole locations of the ICDP project DIVE. The processed and interpreted profiles have confidently imaged the Quaternary sediment–basement contact of the Ossola Valley, placing the base of the valley at approximately 550 m depth at its center and clearly showing the continuation of the topographic slopes observed at the adjacent mountain flanks, which are sloping at approximately 25–30°. The sediments within the valley show signs of several proglacial fill cycles older than the last glacial cycle. The sediments in Ossola Valley have a relatively low velocity (1500–1800 m s−1), which cause a large acoustic impedance contrast at the contact point with the underlying crystalline crustal rocks. Below this contact, the majority of sections show little to no specular reflections due to the very low AI contrast of Ivrea rocks. Shallow dipping reflectors that would suggest large open-fracture or fault systems are not observable; however, a steeply dipping structure is not imaged with the geometry of the surveys, and the existence of steep faults or fractures cannot be excluded. However, such features are not thought to be extensive, and it is reasonable to consider that the lithological progression is in continuous succession of the geological structures mapped at the surface at both sites, i.e., at DT-1B (Ornavasso; narrow antiform) and at DT-1A (Megolo; dipping layers).
Sedimentary overburden is established to be at least 30–50 m at the Ornavasso and Megolo drill sites, respectively. At DT-1B (Ornavasso), the seismic survey has prompted moving the borehole location approximately 20 m closer to the exposed bedrock cliff in order to minimize the Quaternary overburden and to approach the axis of the narrow Massone Antiform. At DT-1A (Megolo), the borehole location plan is confirmed and the seismic survey results are the primary subsurface constraint to orient the borehole's inclination to be at 15–20° in order to orthogonally cross the flank of the broad Proman Anticline and reach the deepest layers of the crust.
Future deployment of longer seismic profiles and larger seismic sources may aid the delineation of the broader geology in the area; however, these are not necessary to plan the borehole geometries, which are determined and agreed on, and enable the start of drilling. Further analysis of the MOS seismic data with respect to fracture reflectivity, and anisotropy effects of metasedimentary layering will be conducted after the rock-core physical property analysis (density and P- and S-wave velocity), borehole geophysics, seismic analysis while drilling, and seismic anisotropy modeling become available. Conversely, the MOS seismic database will also help interpret the forthcoming comprehensive borehole logging program's dataset. Passive seismic data from the DIVEnet monitoring network, which are composed of 12 continuously operated stations over 2 years, covering an area of up to 10 km distance around the boreholes, may further aid the interpretation at a broader scale.
All data have been processed with RadExPro commercial seismic processing software. 3D velocity models were generated in MATLAB using generic MATLAB functions. The MATLAB script is available upon request from the author.
The data collected within the DIVE project are available to the scientific community. Seismic raw data are available at https://doi.org/10.5880/ICDP.5071.002 (Greenwood et al., 2024).
Nicolò Barago (University of Trieste, Trieste, Italy), Ludovic Baron (University of Lausanne, Lausanne, Switzerland), Davide Berno (University of Pavia, Pavia, Italy), Florian Bleibinhaus (University of Leoben, Leoben, Austria), Mattia Bonazzi (University of Pavia, Pavia, Italy), Lorenzo Candioti (University of Lausanne, Lausanne, Switzerland), Andrew Greenwood (University of Lausanne, Lausanne, Switzerland), Steve Henchoz (Geo2X SA, Yverdon-les-Bains, Switzerland), György Hetényi (University of Lausanne, Lausanne, Switzerland), Gerado Maurizio (University of Trieste, Trieste, Italy), Valentin Métraux (Geo2X SA, Yverdon-les-Bains, Switzerland), Alexis Neven (University of Lausanne, Lausanne, Switzerland), Gerald Raymond (University of Lausanne, Lausanne, Switzerland), Alberto Roselli (Geo2X SA, Yverdon-les-Bains, Switzerland), Matteo Scarponi (University of Lausanne, Lausanne, Switzerland), Edith Sotelo (University of Lausanne, Lausanne, Switzerland), Thomas Tsaner (Geo2X SA, Yverdon-les-Bains, Switzerland).
AG designed and planned the survey, coordinated and led the data acquisition, processed the data, and prepared the paper. GH led the implementation of the survey, coordinated and participated in the acquisition, and assisted with paper preparation. LB assisted in survey design and implementation, data acquisition, and processing. AZ arranged all permissions and land access, contributed to the implementation of the study, and gave feedback on the paper. OM, contributed to the implementation of the study and gave input and assistance with paper preparation.
The contact author has declared that none of the authors has any competing interests.
Publisher’s note: Copernicus Publications remains neutral with regard to jurisdictional claims made in the text, published maps, institutional affiliations, or any other geographical representation in this paper. While Copernicus Publications makes every effort to include appropriate place names, the final responsibility lies with the authors.
We would like to acknowledge the Swiss National Science Foundation for the support (grant nos. PP00P2_157627 and PP00P2_187199) as part of project OROG3NY that funded the field campaign.
This research has been supported by the Swiss National Science Foundation (grant nos. PP00P2_157627 and PP00P2_187199).
This paper was edited by Ulrich Harms and reviewed by Christopher Juhlin and one anonymous referee.
Barberini, V., Burlini, L., and Zappone, A.: Elastic properties, fabric and seismic anisotropy of amphibolites and their contribution to the lower crust reflectivity, Tectonophysics, 445, 227–244, https://doi.org/10.1016/j.tecto.2007.08.017, 2007.
Berckhemer, H.: Topographie des “Ivrea-Körpers“ abgeleitet aus seismischen und gravimetrischen Daten, Schweiz Mineral. Petrogr. Mitt., 48, 235–246, 1968.
Brack, P., Ulmer, P., and Schmid, S.: A crustal magmatic system from Earth mantle to the Permian surface: Field trip to the area of lower Valsesia and val d'Ossola (massiccio dei Laghi, Southern Alps, Northern Italy), Swiss Bull. Angew. Geol., 15, 3–21, 2010.
Brodie, K. H. and Rutter, E. H.: Deep crustal extensional faulting in the Ivrea Zone (N-Italy), Tectonophysics, 140, 193–212, https://doi.org/10.1016/0040-1951(87)90229-0, 1987.
Burlini, L.: Parco Nazionale Val Grande: Carta geologica (1 : 25'000), ETH Zurich, Zurich, 2008.
Diehl, T., Husen, S., Kissling, E., and Deichmann, N.: High resolution 3-D P-wave model of the Alpine crust, Geophys. J. Int., 179, 1133–1147, https://doi.org/10.1111/j.1365-246X.2009.04331.x, 2009.
Ewing, T. A., Rubatto, D., Beltrando, M., and Hermann, J.: Constraints on the thermal evolution of the Adriatic margin during Jurassic continental break-up: U–Pb dating of rutile from the Ivrea–Verbano Zone, Italy, Contrib. Mineral Petrol., 169, 1–22, https://doi.org/10.1007/s00410-015-1135-6, 2015.
Fountain, D. M.: Growth and modification of lower continental crust in extended terrains: The role of extension and magmatic underplating, in: Properties and Processes of Earth's Lower Crust, edited by: Mereu, R. F., Mueller, S., and Fountain, D. M., AGU Monograph series, 51, 287–299, AGU, Washington DC, https://agupubs.onlinelibrary.wiley.com/doi/10.1029/GM051p0287 (last access: 22 August 2024), 1989.
Galli, A., Grassi D., Sartori G., Gianola O., Burg J. P., and Schmidt M. W.: Jurassic carbonatite and alkaline magmatism in the Ivrea zone (European Alps) related to the breakup of Pangea, Geology, 1, 199–202, https://doi.org/10.1130/G45678.1, 2019.
Garde, A. A., Boriani, A., and Sørensen, E. V.: Crustal modeling of the Ivrea-Verbano zone in northern Italy re-examined: coseismic cataclasis versus extensional shear zones and sideways rotation, Tectonophys, 662, 291–311, https://doi.org/10.1016/j.tecto.2015.04.003, 2015.
Garuti, G., Bea, F., Zaccarini, F., and Montero, P.: Age, geochemistry and petrogenesis of the ultramafic pipes in the Ivrea Zone, NW Italy, J. Petrol., 42, 433–457, https://doi.org/10.1093/petrology/42.2.433, 2001.
Greenwood, A., Hetényi, G., and Baron, L.: Active seismic surveys for drilling target characterisation in Ossola valley, ICDP expedition 5071, DIVE phase I (Drilling the Ivrea-Verbano zonE) seismic dataset, GFZ Data Services [data set], https://doi.org/10.5880/ICDP.5071.002, 2024.
Khazanehdari, J., Rutter, E. H., and Brodie, K. H.: High-pressure-high-temperature seismic velocity structure of the midcrustal and lower crustal rocks of the Ivrea-Verbano zone and Serie dei Laghi, NW Italy, J. Geophys. Res., 105, 13843–13858, https://doi.org/10.1029/2000JB900025, 2000.
Kissling, E.: Deep structure of the Alps: What do we really know?, Phys. Earth Planet. Int., 79, 87–112, https://doi.org/10.1016/0031-9201(93)90144-X, 1993.
Kissling, E., Wagner, J. J., and Mueller, S.: Three-dimensional gravity model of the northern Ivrea-Verbano zone, in: Geomagnetic and gravimetric studies of the Ivrea zone, edited by: Wagner, J. J. and Mueller, S., 53–61 pp., Swiss Geophys. Comm., Kümmerly & Frey, Neuchâtel, 1984.
Lanza, R.: Models for interpretation of the magnetic anomaly of the Ivrea body, Géologie Alpine, 58, 85–94, 1982.
Liu, Y., Greenwood, A., Hetényi, G., Baron, L., and Holliger, K.: High-resolution seismic reflection survey crossing the Insubric Line into the Ivrea-Verbano Zone: Novel approaches for interpreting the seismic response of steeply dipping structures, Tectonophysics, 816, 229035, https://doi.org/10.1016/j.tecto.2021.229035, 2021.
Lu, Y., Stehly, L., and Paul, A.: High-resolution surface wave tomography of the European crust and uppermost mantle from ambient seismic noise, Geophys. J. Int., 214, 1136–1150. https://doi.org/10.1093/gji/ggy188, 2018.
Müntener, O.: IGSN ICDP5071EH10001 (5071_1_A): Borehole: rock from Megolo (Val d'Ossola) (ICDP DIVE Project), near Verbano-Cusio-Ossola, Italy, GFZ Data Services, https://doi.org/10.60510/ICDP5071EH10001, 2024a.
Müntener, O.: IGSN ICDP5071EH30001 (5071_1_B): Borehole: rock from Ornavasso (Val d'Ossola) (ICDP DIVE Project), near Verbano-Cusio-Ossola, GFZ Data Services, https://doi.org/10.60510/ICDP5071EH30001, 2024b.
Niggli, E.: Über den Zusammenhang zwischen der positiven Schwereanomalie am Südfuss der Westalpen und der Gesteinszone von Ivrea, Eclogae Geol. Helv., 39, 211–220, 1946.
Obata, M. and Karato, S.: Ultramafic pseudotachylyte from the Balmuccia peridotite, Ivrea-Verbano zone, northern Italy, Tectonophys, 242, 313–328, https://doi.org/10.1016/0040-1951(94)00228-2, 1995.
Palmer, D.: An introduction to the generalized reciprocal method of seismic refraction interpretation, Geophysics, 46, 1508–1518, https://doi.org/10.1190/1.1441157, 1981.
Pistone, M., Müntener, O., Ziberna, L., Hetényi, G., and Zanetti, A.: Report on the ICDP workshop DIVE (Drilling the Ivrea–Verbano zonE), Sci. Dril., 23, 47–56, https://doi.org/10.5194/sd-23-47-2017, 2017.
Pittarello, L., Pennacchioni, G., and Di Toro, G.: Amphibolite-facies pseudotachylytes in Premosello metagabbro and felsic mylonites (Ivrea Zone, Italy), Tectonophy, 580, 43–57, https://doi.org/10.1016/j.tecto.2012.08.001, 2012.
Quick, J. E., Sinigoi, S., and Mayer, A.: Emplacement of mantle peridotite in the lower continental crust, Ivrea-Verbano Zone, northwest Italy, Geology, 23, 739–742, https://doi.org/10.1130/0091-7613(1995)023<0739:EOMPIT>2.3.CO;2, 1995.
Redler, C., Johnson, T. E., White, R. W., and Kunz, B.: Phase equilibrium constraints on a deep crustal metamorphic field gradient: Metapelitic rocks from the Ivrea Zone (NW Italy), J. Metam. Geol., 30, 235–254, https://doi.org/10.1111/j.1525-1314.2011.00965.x, 2012.
Rutter, E. H., Brodie, K. H., James, T., and Burlini, L.: Large scale folding in the upper part of the Ivrea-Verbano zone, J. Struct. Geol., 29, 1–17, https://doi.org/10.1016/j.jsg.2006.08.013, 2007.
Ryberg, T., Haberland, C., Wawerzinek, B., Stiller, M., Bauer, K., Zanetti, A., Ziberna, L., Hetényi, G., Müntener, O., Weber, M. M., and Krawczyk, C. M.: 3-D imaging of the Balmuccia peridotite body (Ivrea–Verbano zone, NW-Italy) using controlled source seismic data, Geophys. J. Int., 234, 1985–1998, https://doi.org/10.1093/gji/ggad182, 2023.
Salisbury, M. H., Harvey, C. W., Matthews, L., Eaton, D. W., and Milkereit, B.: The acoustic properties of ores and host rocks in hardrock terranes, Hardrock seismic exploration, SEG, 9–19, https://doi.org/10.1190/1.9781560802396.ch1, 2003.
Scarponi, M., Hetényi, G., Berthet, T., Baron, L., Manzotti, P., and Petri, B., et al.: New gravity data and 3D density model constraints on the Ivrea geophysical body (Western Alps), Geophys. J. Int., 222, 1977–1991, https://doi.org/10.1093/gji/ggaa263, 2020.
Scarponi, M., Hetényi, G., Plomerová, J., Solarino, S., Baron, L., and Petri, B.: Joint seismic and gravity data inversion to image intra-crustal structures: the Ivrea Geophysical Body along the Val Sesia profile (Piedmont, Italy), Front. Earth Sci., 9, 671412, https://doi.org/10.3389/feart.2021.671412, 2021.
Schaltegger, U., Ulianov, A., Müntener, O., Ovtcharova, M., Peytcheva, I., Vonlanthen, P., Vennemann, T., Antognini, M., and Girlanda, F.: Megacrystic zircon with planar fractures in miaskite-type nepheline pegmatites formed at high pressures in the lower crust (Ivrea Zone, southern Alps, Switzerland), Am. Mineral., 100, 83–94, https://doi.org/10.2138/am-2015-4773, 2015.
Schmid, S. M., Kissling, E., Diehl, T., van Hinsbergen, D. J. J., and Molli, G.: Ivrea mantle wedge, arc of the Western Alps, and kinematic evolution of the Alps-Appenines orogenic system, Swiss J. Geosci., 110, 581–612, https://doi.org/10.1007/s00015-016-0237-0, 2017.
Schmid, R.: Zur Petrographie und Struktur der Zone Ivrea-Verbano zwischen Valle d`Ossola und Valle Grande, Schweiz Mineral. Petrogr. Mitt., 47, 935–1117, 1967.
Schmid, R. and Wood, B. J.: Phase relationships in granulitic metapelites from the Ivrea-Verbano zone (Northern Italy), Contrib. Mineral Petrol, 54, 255–279, 1976.
Sills, J. D.: Granulite facies metamorphism in the Ivrea zone, N.W. Italy, Schweiz Mineral Petrograph. Mitt., 64, 169–191, 1984.
Souquière, F. and Fabbri, O.: Pseudotachylites in the Balmuccia peridotite (Ivrea Zone) as markers of the exhumation of the southern Alpine continental crust, Terra Nova, 22, 70–77, https://doi.org/10.1111/j.1365-3121.2009.00918.x, 2010.
The ECORS-CROP Deep Seismic Sounding Group: Mapping the Moho of the Western Alps by wide-angle reflection seismics, Tectonophysics, 162, 193–202, https://doi.org/10.1016/0040-1951(89)90243-6 , 1989.
The ECORS-CROP Gravity Group: Gravity modeling along the ECORS-CROP vertical seismic reflection profile through the Western Alps, Tectonophysics, 162, 203–218, https://doi.org/10.1016/0040-1951(89)90244-8, 1989.
Weiss, T., Siegesmund, S., Rabbel, W., Bohlen, T., and Pohl, M.: Seismic Velocities and Anisotropy of the Lower Continental Crust: A Review, in: Seismic Exploration of the Deep Continental Crust, edited by: Gajewski, D. and Rabbel, W., Pure and Applied Geophysics (PAGEOPH), Birkhäuser, Basel, https://doi.org/10.1007/978-3-0348-8670-3_6, 1999.
Wyatt, D. C., Smye, A. J., Garber, J. M., and Hacker, B. R.: Assembly and Tectonic Evolution of Continental Lower Crust: Monazite Petrochronology of the Ivrea-Verbano Zone (Val Strona di Omegna), Tectonics, 41, e2021TC006841, https://doi.org/10.1029/2021TC006841, 2022.
Yilmaz, Ö.: Seismic data analysis: Processing, inversion, and interpretation of seismic data, Society of Exploration Geophysicists , https://doi.org/10.1190/1.9781560801580, 2001.
- Abstract
- Introduction
- Geological setting of DIVE phase I drilling targets
- MicrO-SEIZE surveys
- Processing
- Results
- Discussion and limitations
- Conclusions
- Code availability
- Data availability
- Team list
- Author contributions
- Competing interests
- Disclaimer
- Acknowledgements
- Financial support
- Review statement
- References