the Creative Commons Attribution 4.0 License.
the Creative Commons Attribution 4.0 License.
 | 05 Mar 2026
Real-time unwrapping of 3D X-ray CT scans for visual core description
Mai-Linh Doan
Morgane Brunet
Charlotte Pizer
Hanaya Okuda
Yu-Chun Chang
Sara Satolli
Uisdean Nicholson
Yuzuru Yamamoto
Marianne Conin
Rina Fukuchi
Jamie Kirkpatrick
Sean Toczko
X-ray computed tomography (XCT) scanning is routinely conducted on board the drilling vessel Chikyu for scientific expeditions. A rapid visualization method, developed during International Ocean Discovery Program (IODP) Expedition 405, unwraps XCT images to enable the early characterization of sediment heterogeneities and identification of geological structures at the visual core description stage.
- Article
(3286 KB) - Full-text XML
- BibTeX
- EndNote


X-ray computed tomography (XCT) scanning is an optimal method for early analysis of drilling cores due to its non-destructive nature, which enables rapid characterization of the 3D structure of rocks and sediments (Nakano et al., 2000; Mees et al., 2003; Cnudde and Boone, 2013). During Expeditions of the International Ocean Discovery Program (IODP) on the drilling vessel (D/V) Chikyu, XCT scanning is routinely used to delineate sampling strategies based on a preliminary assessment of structural geology and sedimentology. Early identification of intervals of interest is crucial for preserving key geological features and selecting homogenous intervals, suitable for whole-round sampling and other analyses that require a substantial volume of material (e.g., interstitial water measurements and permeability tests).
On board the D/V Chikyu, XCT scans are systematically performed at the beginning of the core processing workflow, before whole-core sampling and core splitting (Kirkpatrick et al., 2025). Therefore, the resulting XCT images provide the most continuous and preserved record of the cores and are the dataset of choice for performing core–log correlation. However, the large volume of the X-ray images makes it cumbersome to use and integrate further into the core processing workflow. Currently, XCT images are visualized through specialized software running on a few dedicated computers (Horos and Osirix, only running on MacOS), which limits accessibility and slows the workflow. Exploring this dataset therefore distracts from the actual visual core description, as it requires back and forth displacement between the cores and the XCT computers. Moreover, checking the planarity of structures implies lengthy scrolling of parallel slices. In practice, using the XCT scans requires a dedicated and time-consuming effort that introduces a lot of friction in the core processing workflow.
To enhance the intuitive interpretation and integration of XCT-derived information, we propose a systematic and efficient workflow for unwrapping and displaying XCT data. This approach enables a comprehensive visualization of key geological features – such as fractures, lithological boundaries, and downhole variations in formation density – within a 2D image. By incorporating relevant measurement results, the image can be printed out as a reference while visual core descriptions take place. The successful implementation during Window 1 of IODP Expedition 405 encourages its adoption in future IODP3 expeditions, particularly where time constraints limit the analytical capacity of the scientific team.
A medical scanner (Discovery CT 750HG by GE Healthcare) is installed on board D/V Chikyu at the time of IODP Expedition 405 (Kodaira et al., 2025; GE Healthcare, 2006). The core sections (ca. 1.5 m) are placed on a translating table and advanced forward from top to bottom, along the so-called “z axis”, while a pair consisting of an emitter and receiver rotates with a circular circuit along the diameter (Fig. 1A). The X-ray emitted from the source is attenuated through a combination of Compton scattering and photoelectric effect, so that the attenuation coefficient is almost proportional to density (Phillips and Lannutti, 1997; Ellis and Singer, 2007, p. 290). For each core depth, a series of radiograph images (or projections) are acquired at 360° around the core axis and then inverted to reconstruct a 3D image representative of the attenuation of the beam and hence of the density of the sample (Tonai et al., 2019), provided the parameters of the X-ray acquisition are kept constant and calibrated with reference data, like moisture and density (MAD).
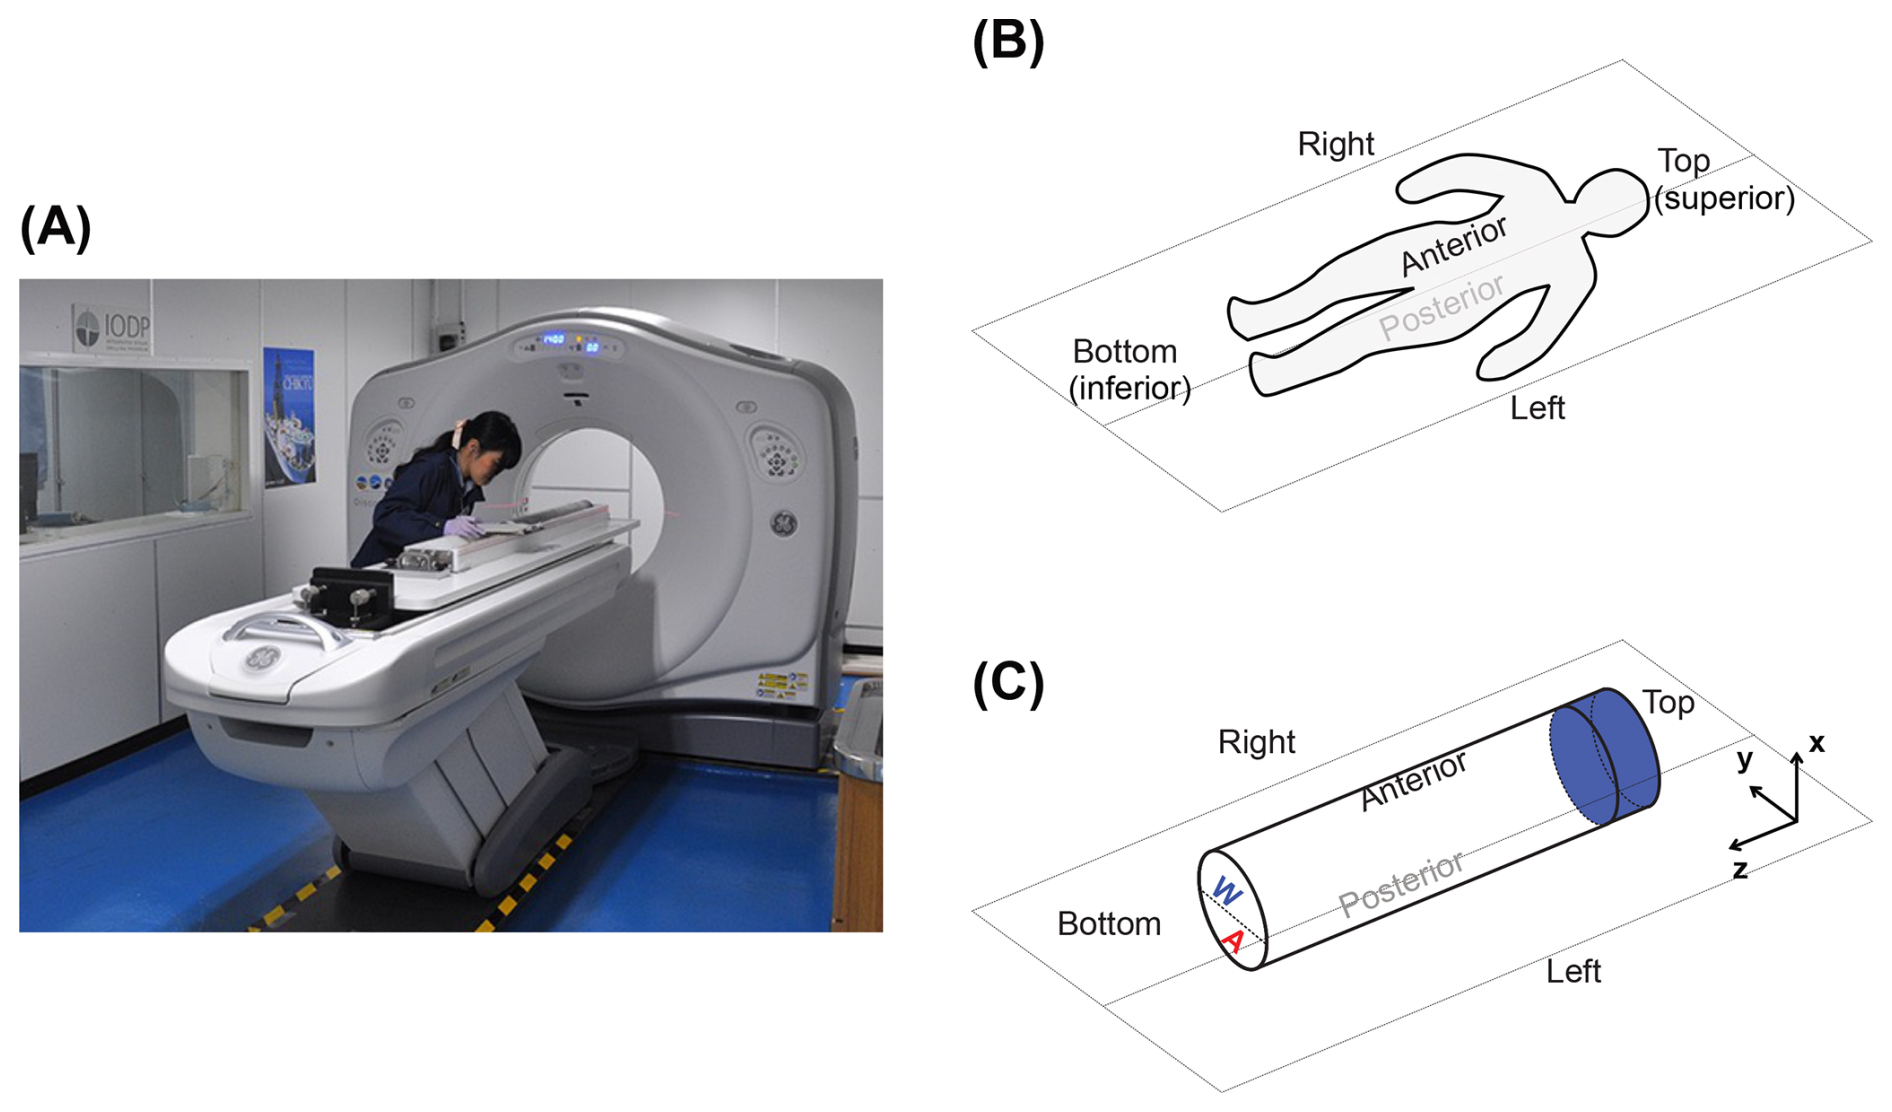
Figure 1(A) XCT scanning of cores on board the drilling vessel Chikyu (© Jamstec). (B) Since a medical scanner is used to perform the scanning, the medical conventions are used. (C) Orientation conventions for the scanning of a core interval on board the drilling vessel Chikyu. W denotes the working half (top half of the core during the scanning), and A denotes the archive half (bottom half during the scan).
As the XCT scanner on board the research vessel Chikyu is a medical device, the orientation of the 3D volume of the core follows medical conventions (Fig. 1B). Each core section is scanned laying along the archive half, as would be the case with a human body, with the “superior” direction corresponding to the top of the core. Hence, the “posterior” direction is on the archive half and the “anterior” direction is on the working half. Once the core is split vertically, the left side of the working half corresponds to the left direction of the XCT scanner. The face of the archive half would be a mirror image of the face of the working half. Figure 1 summarizes the XCT convention for orientations of tomographic volumes and relates them to the classic core orientation conventions of IODP.
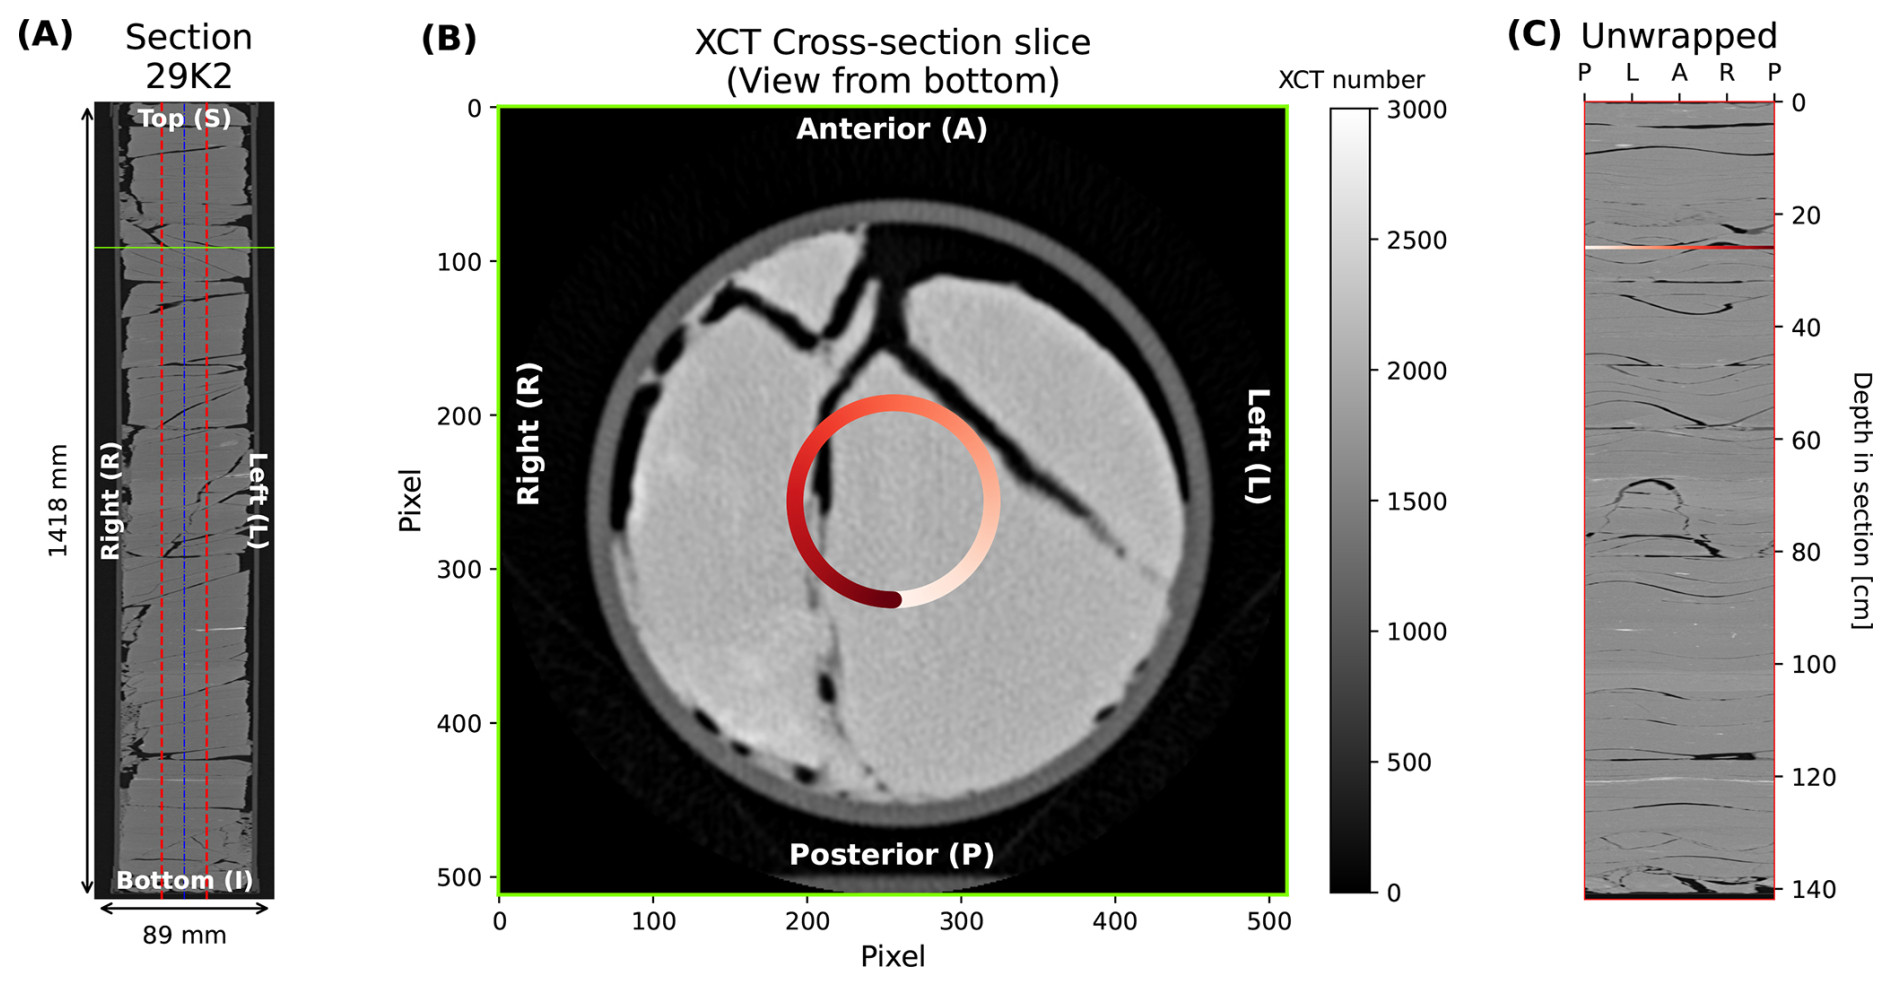
Figure 2Unwrapping of XCT imaging of section C0019J-29K-2 of IODP Expedition 405. (A) Cross-section of the XCT volume, perpendicular to the splitting plane of the core. In this view from the top of the scanner apparatus, the core axis is shown with a blue line. The dotted red lines delineate the outer edge of the cylinder along which the unwrapping is performed. The slice shown in panel (B) is displayed as a green line. (B) Cross-section of the core (green frame) showing the unwrapping procedure. Each cross-section slice is seen from the bottom. Note the flat support piece at the posterior side. A circular path (with shades of red) is delineated for each cross-section. For each angle along the circle delimiting the intersection between the cylinder and the cross-section slice, the corresponding XCT number is recorded and used in the unwrapped image. The saturation of the red color is increased along the circular path, when the parametrization angle increases from 0 to 360°. (C) Unwrapped image of the core (red frame), along the red cylinder shown in panel (A). The line corresponding to the slice shown in panel (B) is color-coded with the angle of the rotation, from white (0°) to red (360°). L: left; A: anterior; R: right; P: posterior.
The XCT scans per core section are stored as large DICOM files, a standard for distribution of medical XCT tomographic data, whose size amounts to several hundred megabytes. The 3D volume data are stored as a collection of slices perpendicular to the long axis of the cores (the z axis described in Fig. 1C, also labeled the “vertical axis” hereafter; Fig. 2B shows an example of a slice). The pixel size of each horizontal slice is typically ∼ 175 µm (Gupta et al., 2019; Tonai et al., 2019; Okazaki et al., 2021), whereas the vertical distance between two slices is 625.0 µm. These high-resolution 3D datasets provide the foundation for our virtual unwrapping method, allowing rapid visualization of fractures, lithological boundaries, and density variations along the core.
XCT 3D volumes are too large for easy integration into the core processing workflow. We therefore propose to make a visual summary (“unwrapping”) of the XCT volume that allows rapid tracking of density variations and visualization of major planar structures. While this “unwrapping” technique has already been used in the late-stage analysis of cores from Phase 1 of the Deep Fault Drilling Project (Williams et al., 2017), we propose to integrate this visualization method at the start of the core processing workflow in a systematic way, enabling real-time decision-making for sampling and analysis.
Unwrapping is performed for each iso-Z slice (Fig. 2). The XCT data are 2D-interpolated and XCT values are computed along a circular path centered on the core (Fig. 2B), which travels counter-clockwise to follow the same conventions as for borehole imaging (Fig. 2C). The circle radius is typically set to 64 pixels to stay within the core and document only the rock material. During IODP Expedition 405, the same color range (0–3000) is applied for all cores to allow visualization of the change in attenuation of XCT rays as density varies with depth. In later expeditions, this range can be modulated to account for the different lithologies to be drilled.
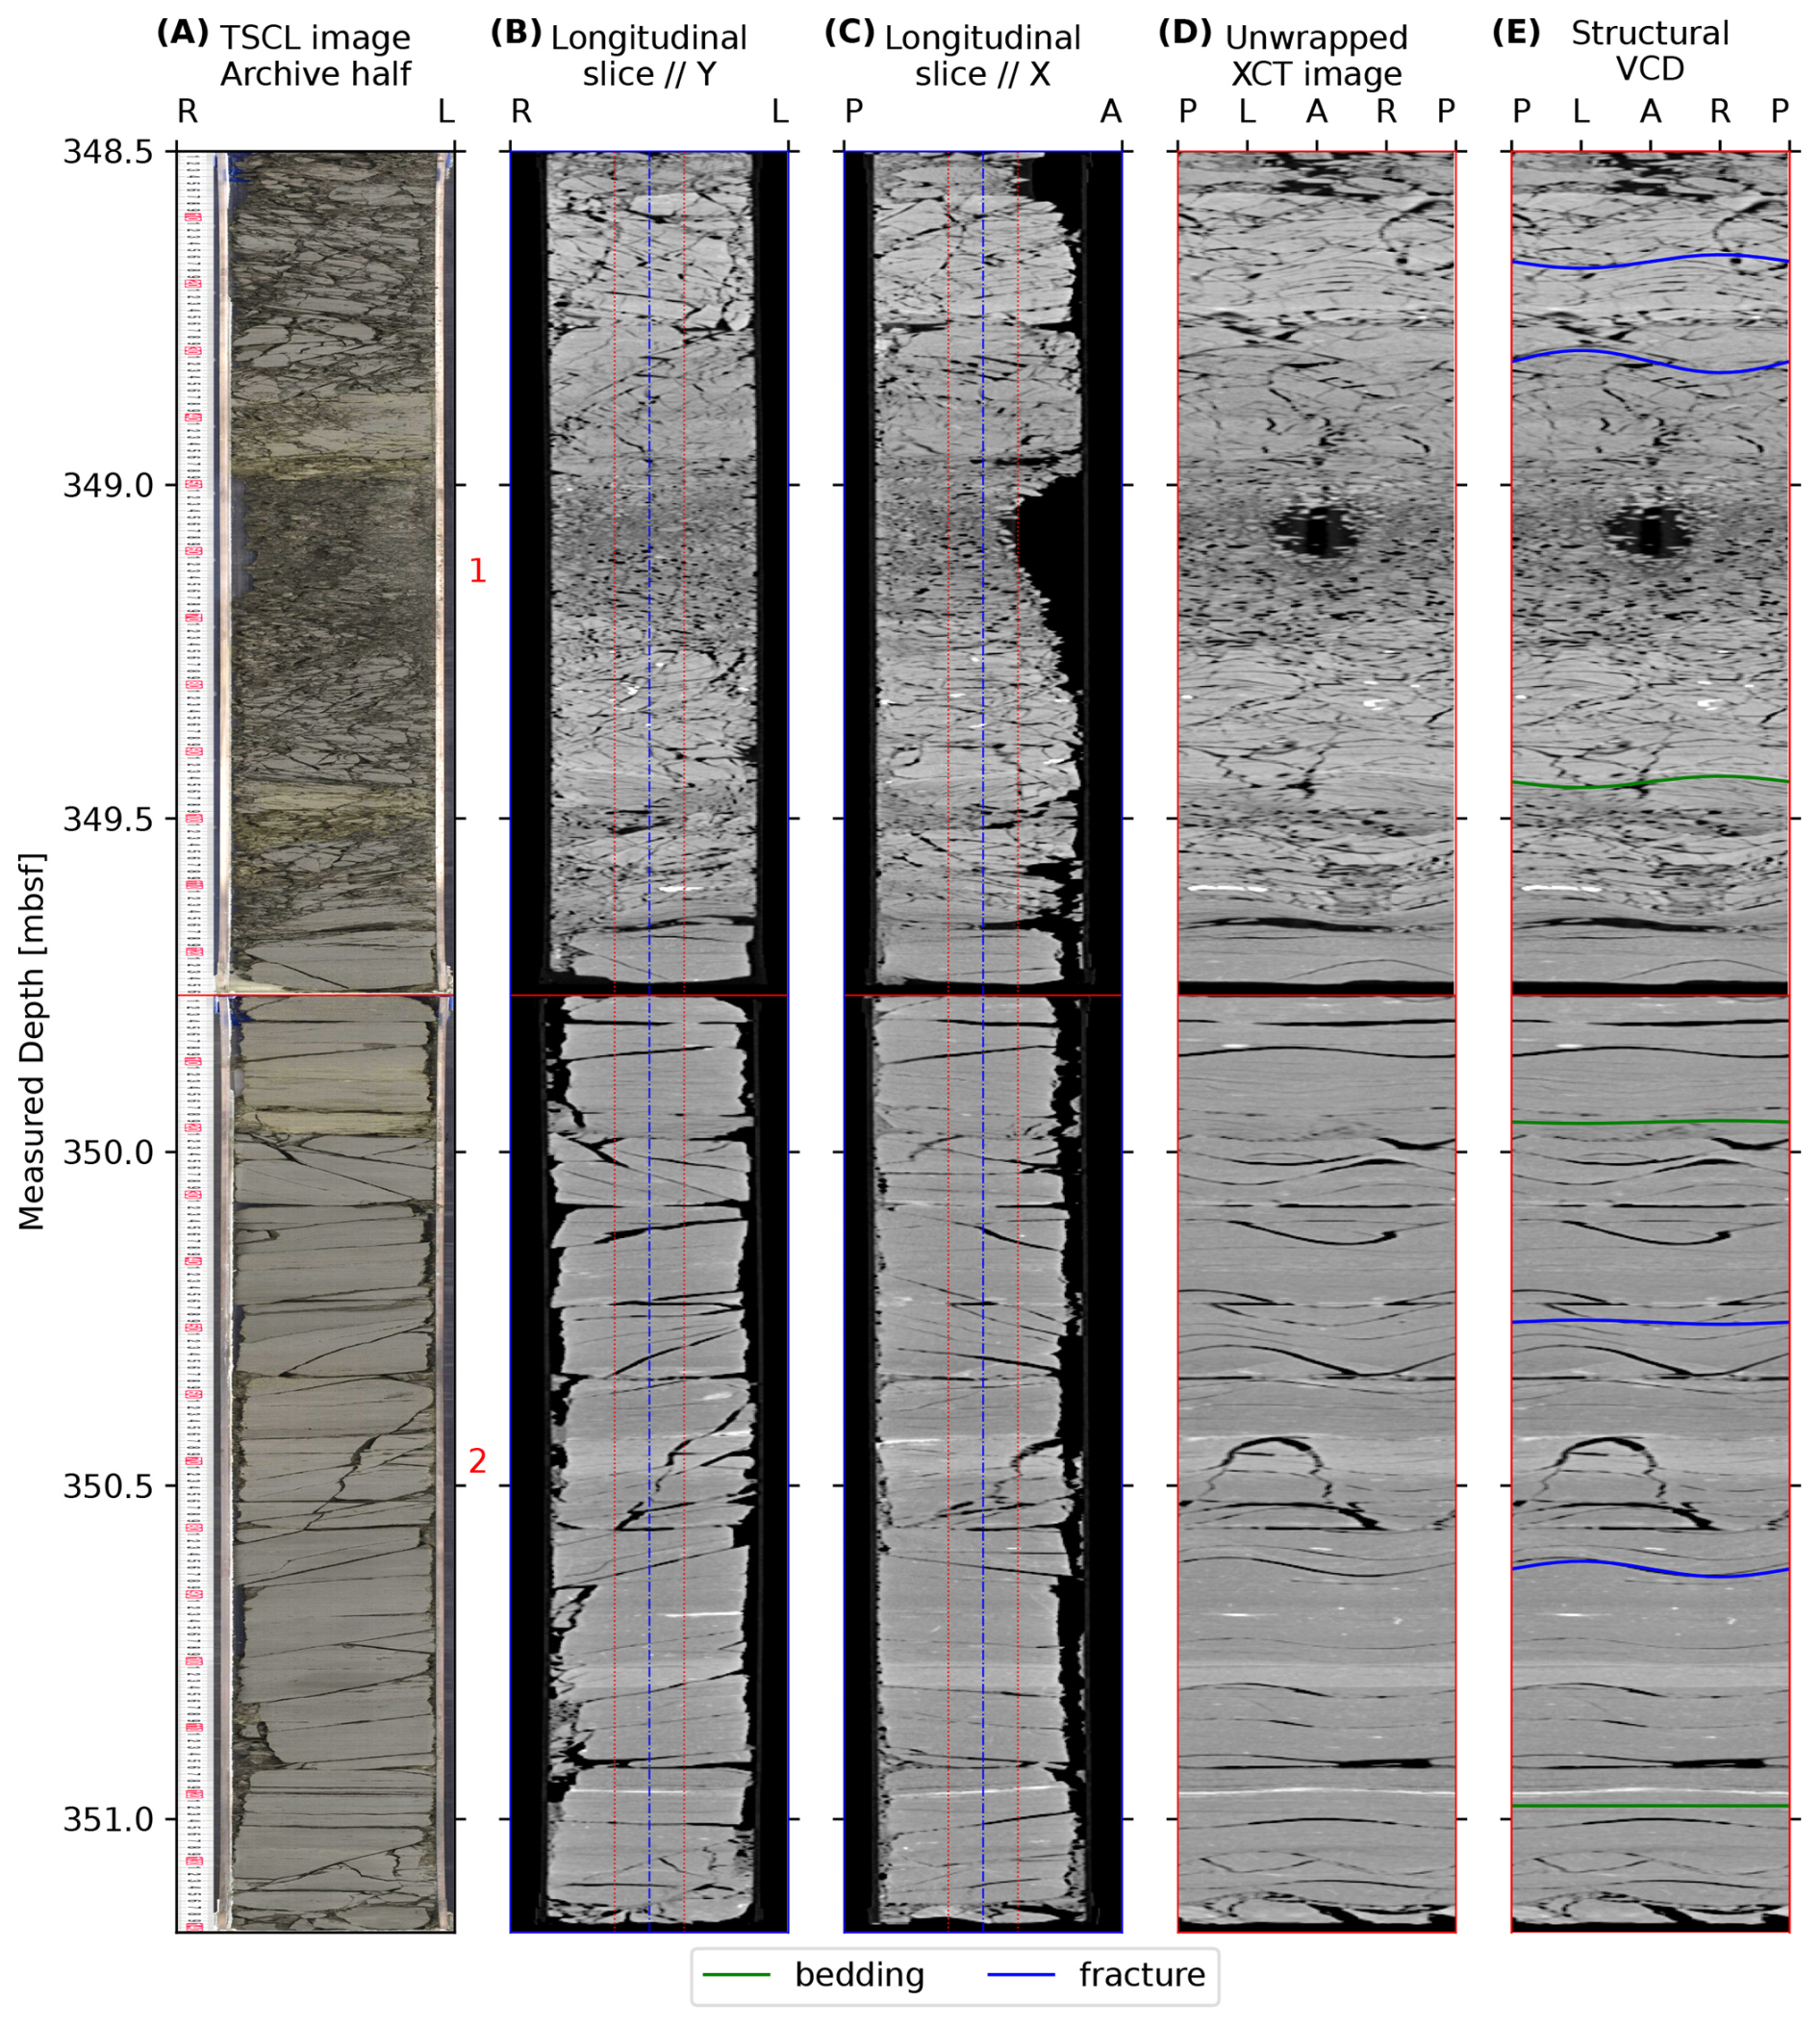
Figure 3Unwrapping of X-ray scans for the first two sections of core 405-C0019J-29K. (A) The Tri-Sensor Core Logger (TSCL) provides an RGB image of the surface of the archive half (here, with an increased brightness for better reading of this image). A ruler has been scanned with the TSCL, with red marks every 10 cm. (B) The XCT longitudinal slice parallel to the y direction matches the TSCL image, proving the great accuracy of the technicians operating the TSCL and XCT equipment. The location of the unwrapping cylinder is shown with dashed red lines. (C) XCT longitudinal slice parallel to the x direction, providing a perpendicular view that would not be accessible to the eyes of the visual core description (VCD) team. This shows, for instance, missing material at the top (anterior side) of the core around 349.1 m b.s.f. (meters below seafloor). (D) Unwrapped XCT image computed for a cylinder of 64 pixels in radius. The cylinder of the unwrapping is shown in panels (B) and (C). (E) The same unwrapped XCT image, overlain with the planar features measured manually by the structural geology team. L: left; A: anterior; R: right; P: posterior (see Figs. 1 and 2). Note that the horizontal and vertical scales are different on this image, since the liner of the core is 7.12 cm in diameter and almost 2.5 m of core is presented in this image (between 348.5 and 351 m b.s.f.).
The iso-X slice can also be extracted along a plane in the middle of the core, corresponding to the surface along which the core is split into working and archive halves. This view also provides a useful quality check to ensure that the core axis is parallel to the z axis of the scanner (Fig. 3).
The implementation of the unwrapping was done using Python scripts during IODP Expedition 405. They were embedded in Jupyter Notebook files that took charge of the reading of the DICOM files and the production of summary figures (see Code and data availability). Creating both the unwrapped and the longitudinal images of Fig. 3 required less than 3 min on a 2020 MacBook Pro laptop computer (running MacOS 14, with a 2 GHz Quad-Core Intel Core i5 processor). These outputs can therefore be rapidly printed on board and provided (1) to the XCT watchdog scientist, who is in charge of the selection of whole-round core intervals, before the cores would be split in working and archive halves, and (2) to the structure and lithology teams prior to conducting visual core description (VCD).
To test the integration of this methodology within the traditional D/V Chikyu core processing workflow, the presented method was implemented during the first leg of IODP Expedition 405 (late 2024). The unwrapping of the XCT data provided several advantages, significantly improving the efficiency and consistency of onboard characterization of 3D core properties.
The early availability of processed XCT data enabled several teams to identify and document subtle sedimentological and structural features without physically disturbing the sediment cores. Printed summaries of XCT scans reduced the need to move back and forth between the core description table and the XCT workstation, allowing a more continuous and integrated workflow. For the structure team, the unwrapped XCT data facilitated the identification and measurement of the orientation of planar features otherwise difficult to distinguish from the surface of the cut core. For the sedimentology team, the unwrapped XCT images provided a continuous reference for revealing fine-scale variations in lithofacies, defining intervals limits, and identifying sampling locations for smear slides during visual core descriptions. In one case, a thick clast of ash lying in the bottom of the archive half and not appearing to the surface would not have been noticed without the XCT summary. For the physical properties team, subtle variations in XCT values are indicative of material heterogeneity throughout the core, guiding sampling for analyses of physical properties. In particular, distinct mineral phases such as pyrite and calcite appeared as bright (absorbing), high-density regions.
Beyond operational benefits, the unwrapped XCT images provided a valuable and useful dataset for the long-term interpretation of the cores. In particular, they showed structural features along the core (Fig. 3E) and could be readily integrated into a software capable of picking sines along the images, as is the case for the TechLog logging software. Unwrapped XCT images could also be used to measure the dip and the relative azimuth of the planar features along the borehole, in a more rapid and precise way than the manual measurements performed on working halves during VCD. Because the XCT scans were collected before core splitting, they preserved the geometry of the structures within the cores with minimal disturbance, yielding more reliable orientation data. However, it is important to note that XCT scans were a useful complement to VCD but that direct observation of core was still a necessity, as fine features such as slickenslides were not visible on X-ray images and different lithologies may have similar XCT values (densities), making them difficult to differentiate.
Finally, unwrapped XCT images were also a tool of choice for core–log integration projects. They were built by unwrapping data along a cylinder, like the borehole images provided by logging, so that they could be compared directly. Both had advantages and disadvantages. The borehole images were oriented and quasi-continuous, but they had lower resolution and could not be compared directly with geological material. In contrast, the cores were not oriented at the time of VCD and the XCT imaging could not provide a complete description of the borehole, since the core recovery was below 100% most of the time. The combination of both datasets could help in the reorientation of cores where bedding could be identified, and it facilitated the correlation of structural features between core and log data – ultimately improving the geological interpretation of the borehole.
The unwrapping of the XCT datasets was not originally part of the workflow during Expedition 405, and their implementation was not optimized during the cruise. In particular, early access to the DICOM files was not planned, and the generation of the unwrapped XCT images required lengthy manual copying operations so that the data could be processed on an external computer disconnected from the onboard laboratory network. Despite the advantages provided by the XCT summary and the unwrapped images during the first window of Expedition 405, their usage tended to be discontinued during the second window, mainly due to the high level of manual maintenance required.
Installing the Python scripts directly on a dedicated computer on board would allow the integration of XCT unwrapping as an almost real-time service between the XCT scanning and the structure and lithology VCD. This system could automatically generate several deliverables: (i) depth-referenced unwrapped images and (ii) XCT summaries combining both unwrapped and longitudinal images. Since VCD is conducted after systematic measurements with the Multi-Sensor Core Logger (MSCL), these data could be further integrated within the XCT summaries to cross-validate the measurements and guide sampling for physical properties. Such an approach would provide the entire scientific party on board the D/V Chikyu with an efficient, standardized tool for visualizing and interpreting XCT data, paving the way for its routine use during future IODP3 expeditions.
The original unwrapping Jupyter notebooks used during IODP Expedition 405, together with a simplified Python script describing the unwrapping technique, are available at https://gricad-gitlab.univ-grenoble-alpes.fr/doanm/xct_unwrapping (last access: 9 February 2026; https://doi.org/10.5281/zenodo.18539012, Doan, 2026).
IODP Expedition 405 Scientists: Shuichi Kodaira, Patrick M. Fulton, Christine Regalla, Kohtaro Ujiie, Piero Bellanova, Cameron Brown, Marissa René Castillo, Nobuhisa Eguchi, Jenna Everard, Alysa Fintel, Jonathan Ford, Amy Gough, Huiyun Guo, Derya Gürer, Ron Hackney, Minori Hagino, Yohei Hamada, Hinako Hosono, Akira Ijiri, Matt J. Ikari, Tsuyoshi Ishikawa, Masao Iwai, Maria Jose Jurado Rodriguez, Nana Kamiya, Toshiya Kanamatsu, Aubrey LaPlante, Weiren Lin, Lena Maeda, Ayumu Miyakawa, Yuki Morono, Yasuyuki Nakamura, Natsumi Okutsu, Pei Pei, E. Troy Rasbury, Rebecca V. M. Robertson, Catherine H. Ross, Heather M. Savage, Kaitlin Schaible, Srisharan Shreedharan, Hiroki Sone, Chijun Sun, Taizo Uchida, Asuka Yamaguchi, Takeru Yoshimoto, and Junli Zhang.
Mai-Linh Doan: conceptualization, implementation, initial writing, final submission. Morgane Brunet, Charlotte Pizer, Hanaya Okuda, Yu-Chun Chang, Sara Satolli, Uisdean Nicholson, Yuzuru Yamamoto, Marianne Conin, Rina Fukuchi, Jamie Kirkpatrick, Sean Toczko: editing. IODP Expedition 405 Scientists: data collection.
The contact author has declared that none of the authors has any competing interests.
Publisher's note: Copernicus Publications remains neutral with regard to jurisdictional claims made in the text, published maps, institutional affiliations, or any other geographical representation in this paper. The authors bear the ultimate responsibility for providing appropriate place names. Views expressed in the text are those of the authors and do not necessarily reflect the views of the publisher.
The authors would like to thank the technicians and engineers from Marine Works Japan for their skilled help. We would like to thank the two reviewers, Satoshi Tonai and Henning Lorenz, for their insightful comments.
Financial support for post-cruise investigation was provided by the CNRS/INSU grant TGIR-IODP-FR-2025#284891.
This paper was edited by Tomoaki Morishita and reviewed by Satoshi Tonai and Henning Lorenz.
Cnudde, V. and Boone, M. N. High-resolution X-ray computed tomography in geosciences: A review of the current technology and applications, Earth-Sci. Rev., 123, 1–17, 2013.
Doan, M. L.: XCT_unwrapping (1.0), Zenodo [code], https://doi.org/10.5281/zenodo.18539012, 2026.
Ellis, D. V. and Singer, J. M.: Well logging for earth scientists, 2nd edn., Springer, Dordrecht, ISBN 978-1-4020-4602-5, https://doi.org/10.1007/978-1-4020-4602-5, 2007.
GE Healthcare: LightSpeed Series Learning and Reference Guide-Multi Slice CT: Waukesha, Wisconsin, GE Healthcare, 936, 2006.
Gupta, L. P., Tanikawa, W., Hamada, Y., Hirose, T., Ahagon, N., Sugihara, T., Abe, A., Nomura, S., Masaki, Y., Wy, H. Y., Lin, W., Kinoshita, M., Yamada, Y., and the NGHP Expedition 02 JAMSTEC Science Team: Examination of gas hydrate-bearing deep ocean sediments by X-ray Computed Tomography and verification of physical property measurements of sediments, Marine and Petroleum Geology, 108, 239–248, https://doi.org/10.1016/j.marpetgeo.2018.05.033. 2019.
Kirkpatrick, J., Fulton, P., Ujiie, K., Conin, M., Regalla, C., Kodaira, S., Okutsu, N., Maeda, L., Toczko, S., Eguchi, N., Bellanova, P., Brown, C., Brunet, M., Castillo, M., Chang, Y.-C., Doan, M.-L., Everard, J., Fintel, A., Ford, J., Fukuchi, R., Gough, A., Guo, H., Gürer, D., Hackney, R., Hagino, M., Hamada, Y., Hosono, H., Ijiri, A., Ikari, M., Ishikawa, T., Iwai, M., Jeppson, T., Jurado, M.-J., Kamiya, N., Kanamatsu, T., LaPlante, A., Lin, W., Miyakawa, A., Morono, Y., Nakamura, Y., Nicholson, U., Okuda, H., Pei, P., Pizer, C., Rasbury, T., Robertson, R. V. M., Ross, C., Satolli, S., Savage, H., Schaible, K., Shreedharan, S., Sone, H., Sun, C., Turel, C., Uchida, T., Yamaguchi, A., Yamamoto, Y., Yoshimoto, T., Zhang, J., Wspanialy, A., Le Ber, E., Rydzy, M. B., and Schuba, N.: Expedition 405 methods, in: Tracking Tsunamigenic Slip Across the Japan Trench (JTRACK), edited by: Kodaira, S., Conin, M., Fulton, P., Kirkpatrick, J., Regalla, C., Ujiie, K., Okutsu, N., Maeda, L., Toczko, S., Eguchi, N., and the Expedition 405 Scientists, Proceedings of the International Ocean Discovery Program, 405, International Ocean Discovery Program, College Station, TX, https://doi.org/10.14379/iodp.proc.405.102.2025, 2025.
Kodaira, S., Conin, M., Fulton, P., Kirkpatrick, J., Regalla, C., Ujiie, K., Okutsu, N., Maeda, L., Toczko, S., Eguchi, N., and the Expedition 405 Scientists: Tracking Tsunamigenic Slip Across the Japan Trench (JTRACK), Proceedings of the International Ocean Discovery Program, 405, International Ocean Discovery Program, College Station, TX, https://doi.org/10.14379/iodp.proc.405.2025, 2025.
Mees, F., Swennen, R., Van Geet, M., and Jacobs, P.,Applications of X-ray computed tomography in the geosciences, Geol. Soc. Spec. Publ., 215, 1–6, https://doi.org/10.1144/GSL.SP.2003.215.01.01, 2003.
Nakano, T., Nakashima, Y., Nakamura, K., and Ikeda, S.: Observation and analysis of internal structure of rock using X-ray CT, Chishitsugaku Zasshi, 106, 363–378, 2000.
Okazaki, K., Michibayashi, K., Hatakeyama, K., Abe, N., Johnson, K. T. M., and Kelemen, P. B.: Major mineral fraction and physical properties of carbonated peridotite (listvenite) from ICDP Oman Drilling Project Hole BT1B inferred from X-ray CT core images, J. Geophys. Res.: Solid Earth, 26, https://doi.org/10.1029/2021jb022719, 2021.
Phillips, D. H. and Lannutti, J. J.: Measuring physical density with X-ray computed tomography, NDT & E International, 30, 339–350, https://doi.org/10.1016/S0963-8695(97)00020-0, 1997.
Tonai, S., Kubo, Y., Tsang, M.-Y., Bowden, S., Ide, K., Hirose, T., Kamiya, N., Yamamoto, Y., Yang, K., Yamada, Y., Morono, Y., Heuer, V. B., Inagaki, F., and Expedition 370 Scientists: A New Method for Quality Control of Geological Cores by X-Ray Computed Tomography: Application in IODP Expedition 370, Front. Earth Sci., 7, https://doi.org/10.3389/feart.2019.00117, 2019.
Williams, J. N., Bevitt, J. J., and Toy, V. G.: A comparison of the use of X-ray and neutron tomographic core scanning techniques for drilling projects: insights from scanning core recovered during the Alpine Fault Deep Fault Drilling Project, Sci. Dril., 22, 35–42, https://doi.org/10.5194/sd-22-35-2017, 2017.
- Abstract
- Introduction
- X-ray imaging on board the drilling vessel Chikyu
- Unwrapping methodology
- Integration into the core processing workflow during IODP Expedition 405
- Perspectives to integrate the unwrapping of XCT scans to the core processing workflow
- Code and data availability
- Team list
- Author contributions
- Competing interests
- Disclaimer
- Acknowledgements
- Financial support
- Review statement
- References