 | 01 Dec 2020
Geohazard detection using 3D seismic data to enhance offshore scientific drilling site selection
Paul C. Knutz
D. Calvin Campbell
John R. Hopper
Andrew M. W. Newton
Mads Huuse
Karsten Gohl
A geohazard assessment workflow is presented that maximizes the use of 3D seismic reflection data to improve the safety and success of offshore scientific drilling. This workflow has been implemented for International Ocean Discovery Program (IODP) Proposal 909 that aims to core seven sites with targets between 300 and 1000 m below seabed across the north-western Greenland continental shelf. This glaciated margin is a frontier petroleum province containing potential drilling hazards that must be avoided during drilling. Modern seismic interpretation techniques are used to identify, map and spatially analyse seismic features that may represent subsurface drilling hazards, such as seabed structures, faults, fluids and challenging lithologies. These hazards are compared against the spatial distribution of stratigraphic targets to guide site selection and minimize risk. The 3D seismic geohazard assessment specifically advanced the proposal by providing a more detailed and spatially extensive understanding of hazard distribution that was used to confidently select eight new site locations, abandon four others and fine-tune sites originally selected using 2D seismic data. Had several of the more challenging areas targeted by this proposal only been covered by 2D seismic data, it is likely that they would have been abandoned, restricting access to stratigraphic targets. The results informed the targeted location of an ultra-high-resolution 2D seismic survey by minimizing acquisition in unnecessary areas, saving valuable resources. With future IODP missions targeting similarly challenging frontier environments where 3D seismic data are available, this workflow provides a template for geohazard assessments that will enhance the success of future scientific drilling.
- Article
(43116 KB) - Full-text XML
-
Supplement
(1718 KB) - BibTeX
- EndNote


When planning an offshore drilling campaign, one of the primary technical concerns that governs site selection is safety (Jeanjean et al., 2005; Mearns and Flin, 1995). The subsurface can be hazardous and is full of unknowns; therefore, it requires the full interrogation of all available data to reduce risks during drilling. Common subsurface geohazards include phenomena related to excess pore pressure such as shallow hydrocarbons, shallow water flows, faulting to shallow depths, mud volcanoes, and pockmarks, all of which can lead to incompetent sediments and seabed instability (Aird, 2010; Jensen and Cauquil, 2013; Ruppelt and West, 2004; Wood and Hamilton, 2002). Identifying these hazards prior to drilling allows for decisions to be made during site selection to either avoid the hazard completely, mitigate it or select the lowest risk option (Aird, 2010; Jensen and Cauquil, 2013). This process, often termed a geohazard assessment, is integral to drilling success and safety, with its effectiveness often relying on the availability of high-quality data coverage such as seismic reflection, bathymetry and well data.
The importance of geohazard identification is amplified in environments such as deep water, high pressure/high temperature, glaciated margins and frontier petroleum provinces where there is little prior drilling experience (Galavazi et al., 2006; Moore et al., 2007; Weimer and Pettingill, 2007). Within these locations, the frequency and significance of geohazards are often increased, as well as the consequences of accidents (Eriksen et al., 2014; Li et al., 2016). Furthermore, it is often these locations where data coverage and quality are poorest, resulting in a limited subsurface understanding and higher risk to drilling. In the last few decades, exploration for subsurface resources has expanded into more challenging environments due to increased global demand for petroleum products (Mitchell et al., 2012; Poppel, 2018; Suicmez, 2016). This has led to the acquisition of extensive 2D and 3D seismic reflection datasets and industry drilling in frontier areas. The expansion, especially with regards to new 3D seismic reflection data coverage, provides an opportunity to use these data for reasons beyond their original commercial purpose. This includes regional geological mapping and geohazard assessments allowing site identification and de-risking for scientific boreholes (Dutta et al., 2010; Selvage et al., 2012; Hovland et al., 1998).
A geohazard assessment involves the geospatial quantification of drilling hazards, ideally through the use of densely sampled 2D or 3D reflection seismic data (Aird, 2010; Khan et al., 2018; Selvage et al., 2012; Heggland et al., 1996). In the past, the required resolution to detect small but potentially hazardous features could only be provided through dedicated high-resolution site surveys across potential drill sites using such tools as sub-bottom profilers, small-volume airguns, or sparker reflection systems (Jensen and Cauquil, 2013; Parkinson, 2000). Today, the acquisition of large-scale 3D seismic reflection datasets in frontier basins provides spatial coverage that far exceeds most conventional site surveys (Games and Self, 2017). The processing of these datasets has improved sufficiently to provide a vertical resolution that approaches that of a traditional site survey and often provides a horizontal resolution exceeding that of even closely spaced 2D seismic site surveys (Games and Self, 2017; Oukili et al., 2019). Three-dimensional seismic surveys thus minimize the need for additional data, except for particularly complicated areas (Hill, 1996; Selvage et al., 2012; Sharp and Badalini, 2013; Williams and Andresen, 1996; Roberts et al., 1996).
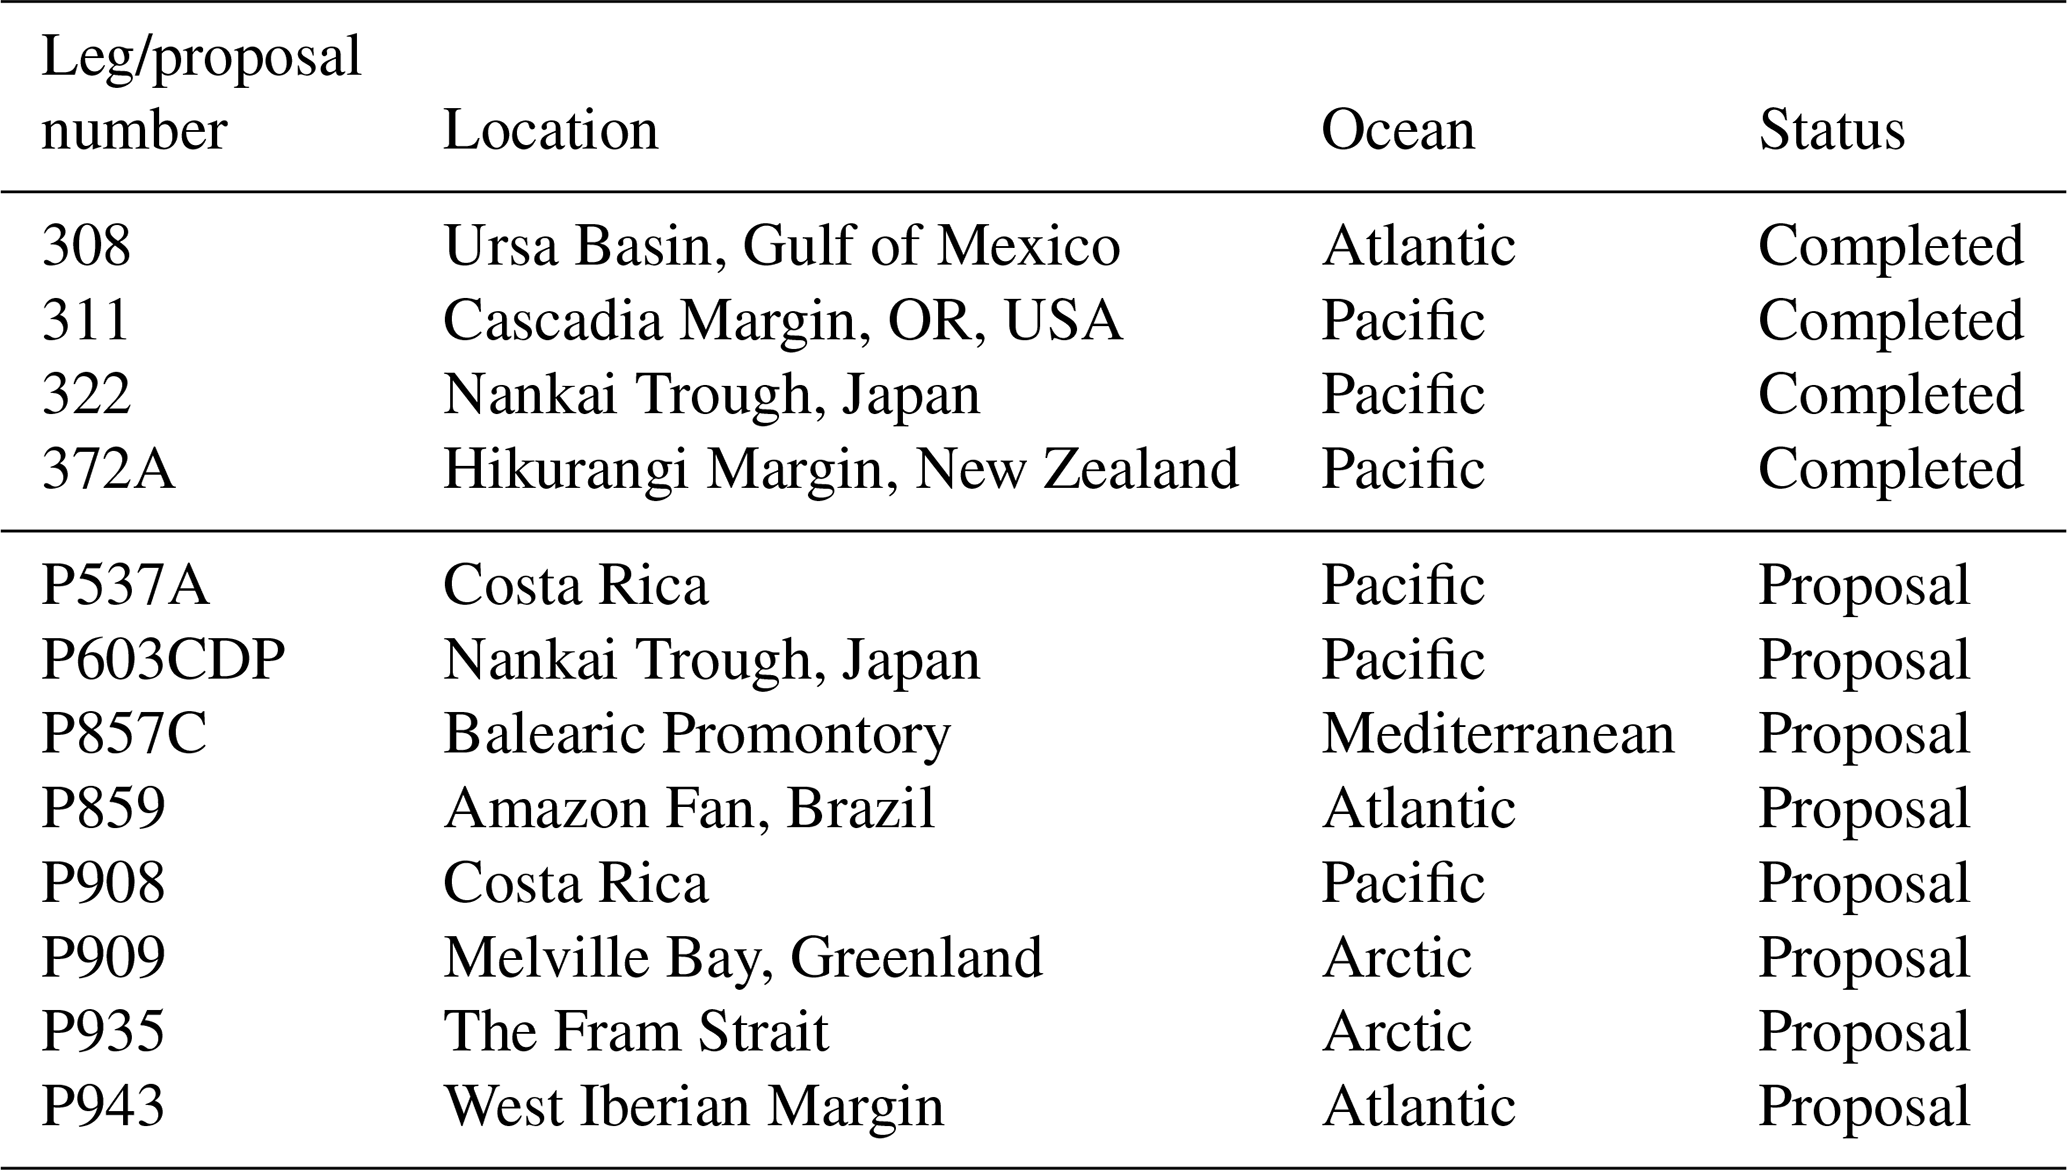
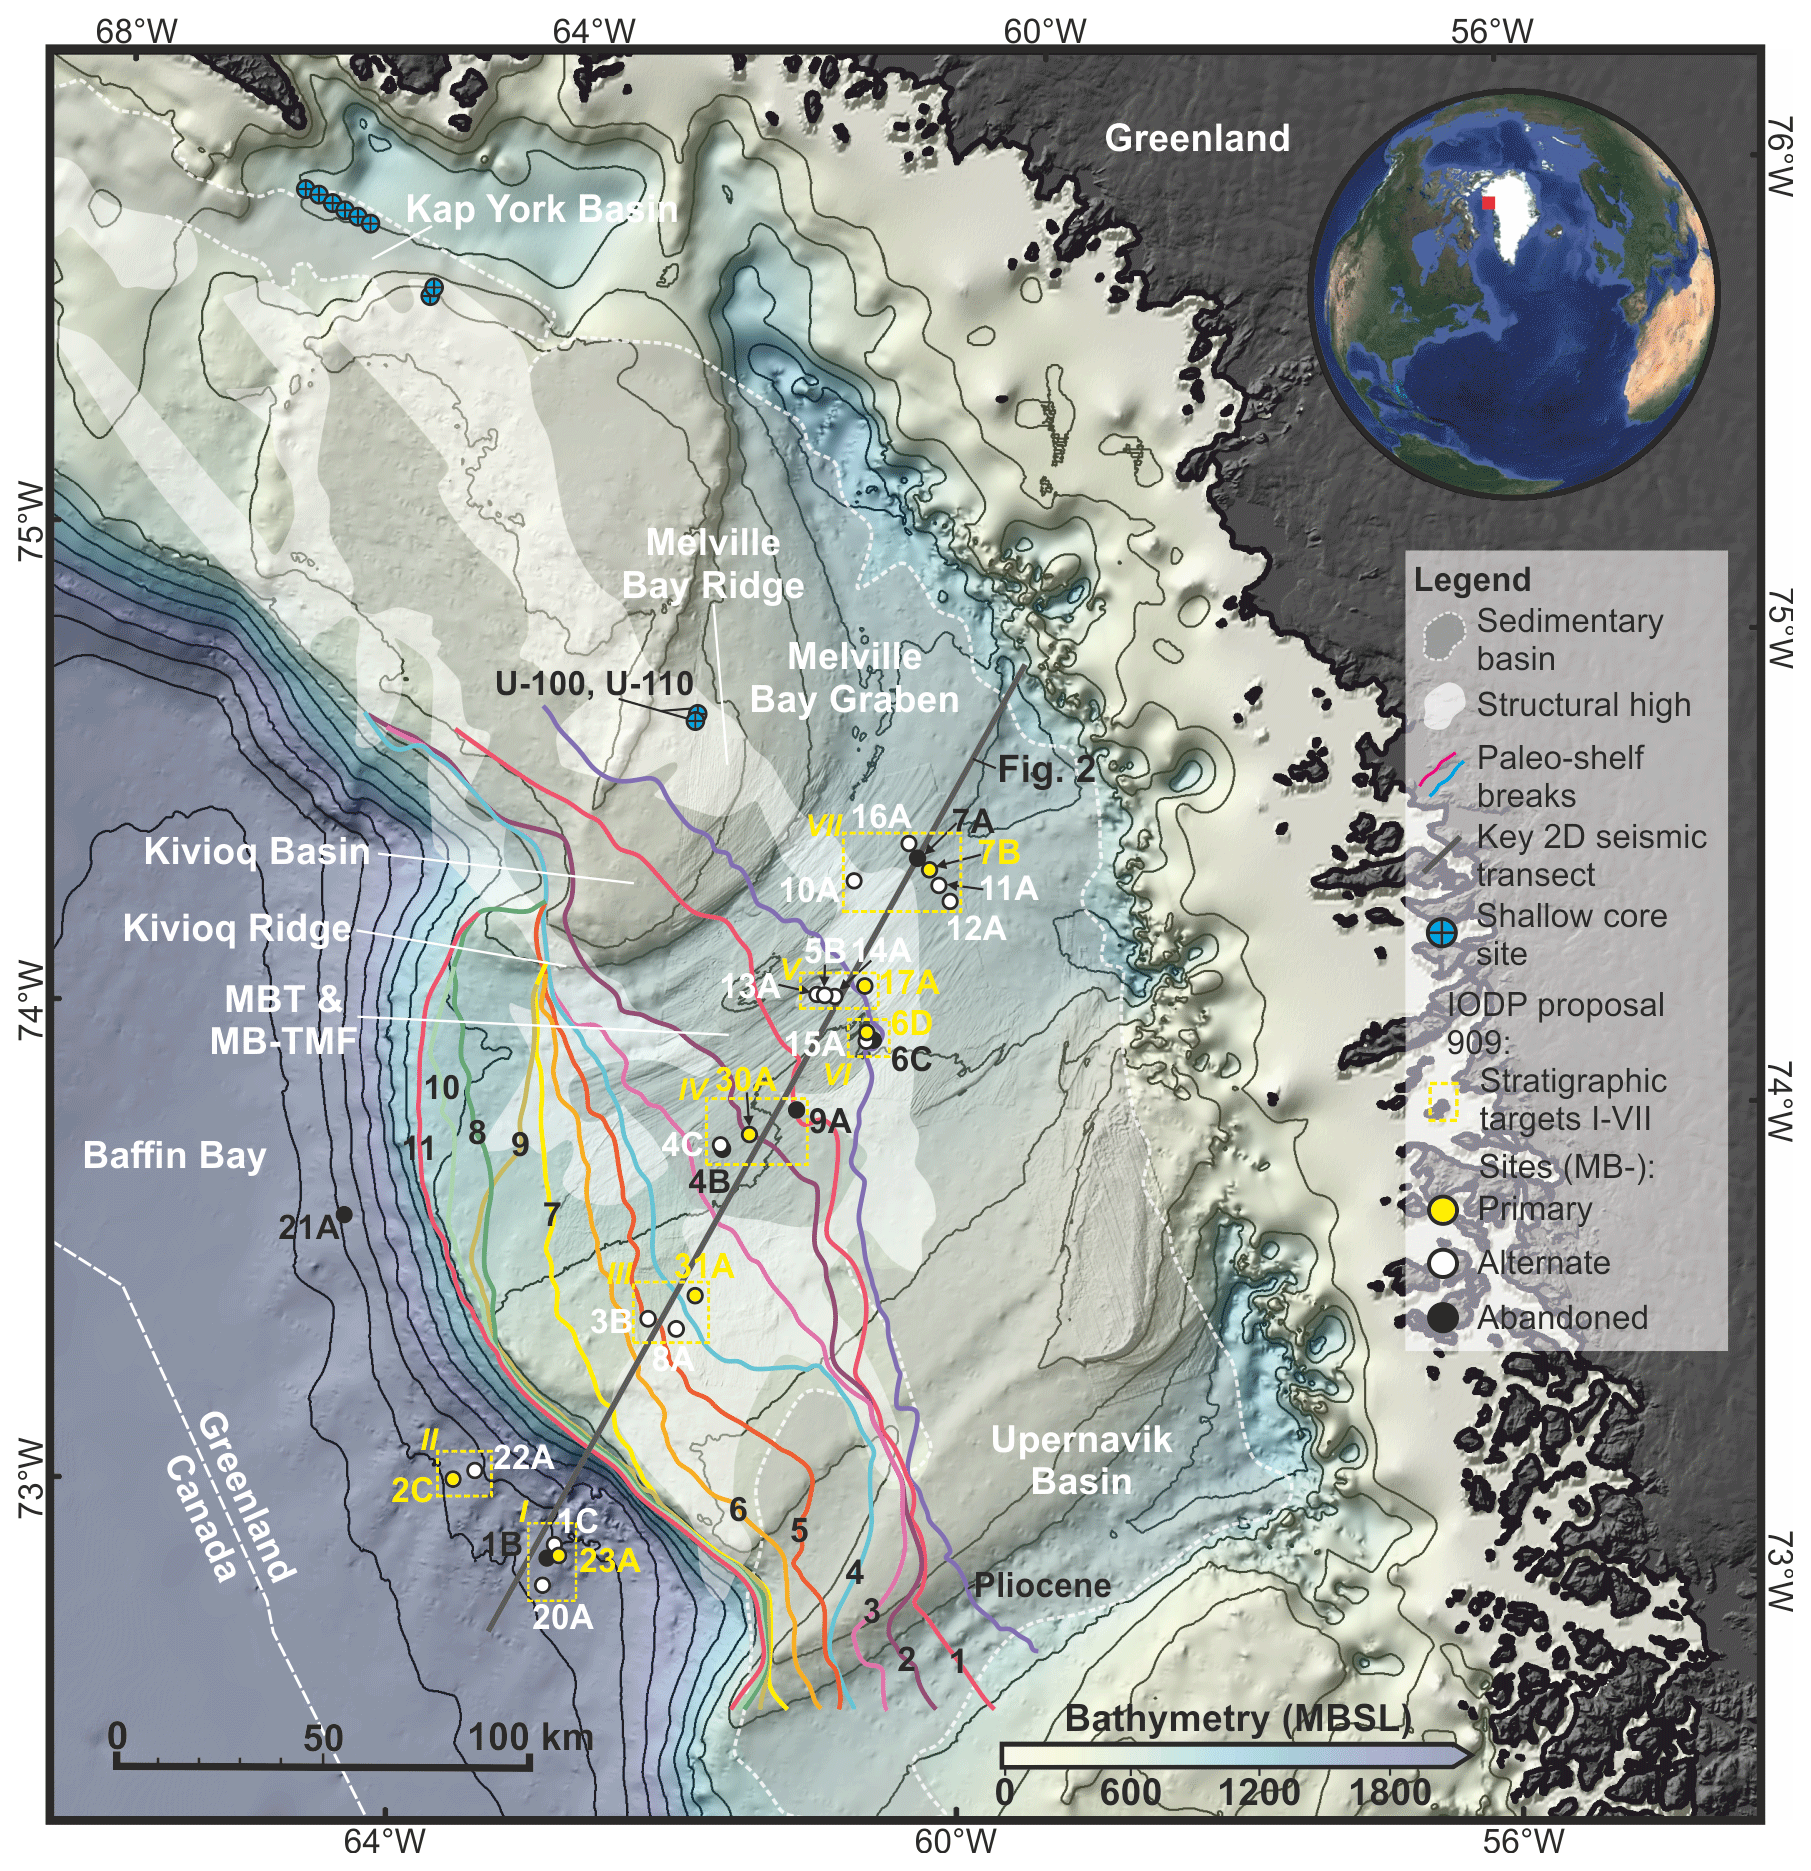
Figure 1Location map. A bathymetric map of the Melville Bay area in north-western Greenland from Newton et al. (2017), showing the extensive influence of glaciation on the seabed including the Melville Bay Trough (MBT) and Melville Bay Trough Mouth Fan (MB-TMF). The red square on the inset map shows the global location of the bathymetry. Annotations on the map include the distribution of regional rift elements, including sedimentary basins and structural ridges, as well as the location of paleo-shelf break positions of glacigenic prograding units from Knutz et al. (2019). IODP Proposal 909 site locations are shown as well as the associated stratigraphic targets of each site (I–VII). Shallow cores that were drilled by a consortium led by Shell that provide stratigraphic information used within the proposal are also shown (Acton, 2012; Nøhr-Hansen et al., 2018). The location of the key regional 2D seismic transect used for original site selection is also shown and represents the location of Fig. 2.
The increased availability of 3D seismic volumes in continental shelf areas often coincides with areas targeted by scientific drilling programmes. These include the International Ocean Discovery Program (IODP) that operates the drilling vessels Joides Resolution and Chikyu but also national facilities such as the Meeresboden-Bohrgerät (MeBO) of the Alfred Wegener Institute (AWI) and the British Geological Survey (BGS) Rock Drill. For this study, we present data from an Arctic frontier basin that support site selection for a proposed scientific drilling leg under the IODP. IODP has an excellent safety record, achieved through review of proposed sites by panels of international experts, and has drilled within frontier petroleum provinces in the past, with examples such as the early passive margin drilling along the western Atlantic margin (e.g. DSDP Legs 11 and 41; Ewing and Hollister, 1972; Lancelot and Seibold, 1977) and more recently in areas such as the Demerara Rise, offshore Suriname (Leg 207) and the Great Australian Bight (Leg 182) (National Research National Research Council, 2011). Several completed and proposed IODP expeditions report the availability of 3D seismic data within the study area, and it is possible that several others had undocumented access (Table 1). As commercial 3D seismic reflection datasets become more widely available for academic research, there is an opportunity to optimize both the scientific benefits and safety of proposed drilling sites by conducting more comprehensive geological and geohazard assessments. This study, whilst focussed on the hazards associated with IODP Proposal 909 within the north-western Greenland glaciated margin (Fig. 1), provides a geohazard assessment workflow that optimizes drill site selection through the use of 3D seismic data and serves as a template for the improved safety and success of future scientific drilling campaigns using 3D seismic data in frontier areas.
2.1 Setting
IODP Proposal 909 aims to drill a transect of seven sites across Melville Bay offshore north-western Greenland at water depths ranging from 0.5 to 1.9 km (Fig. 1). Here, a thick (> 2 km) Cenozoic sedimentary succession overlies a rift basin topography that formed during several stages of Early Cretaceous to Early Paleogene rifting between Greenland and Canada (Altenbernd et al., 2015; Gregersen et al., 2013, 2017; Oakey and Chalmers, 2012). This includes the extensive, elongate inversion structures of the Melville Bay and Kivioq ridges. These ridges separate the deep sedimentary basins of the Melville Bay Graben and Kivioq Basin and contain up to 9 km thick successions of syn-rift (seismic mega-units (mu) mu-G, -F and the lowermost -E) and post-rift (mu-E, -D, -C, -B and -A) sediments (Figs. 1 and 2) (Altenbernd et al., 2015; Gregersen et al., 2013, 2017; Knutz et al., 2015; Whittaker et al., 1997). Mu-E is attributed to the continental drift phase as seafloor spreading commenced in Baffin Bay. The lower part of mu-D is considered to have formed during the final syn-drift stage influenced by compressional tectonics as a consequence of Greenland converging with the North American Plate (Knutz et al., 2020). Deposition of the upper part of mu-D, representing a hemipelagic succession, was presumably deposited during a phase of post-drift tectonic relaxation. The mega-units are separated by seismic horizons (hz) e1, d1, c1 and b1 that are generally expressed as regional unconformities.
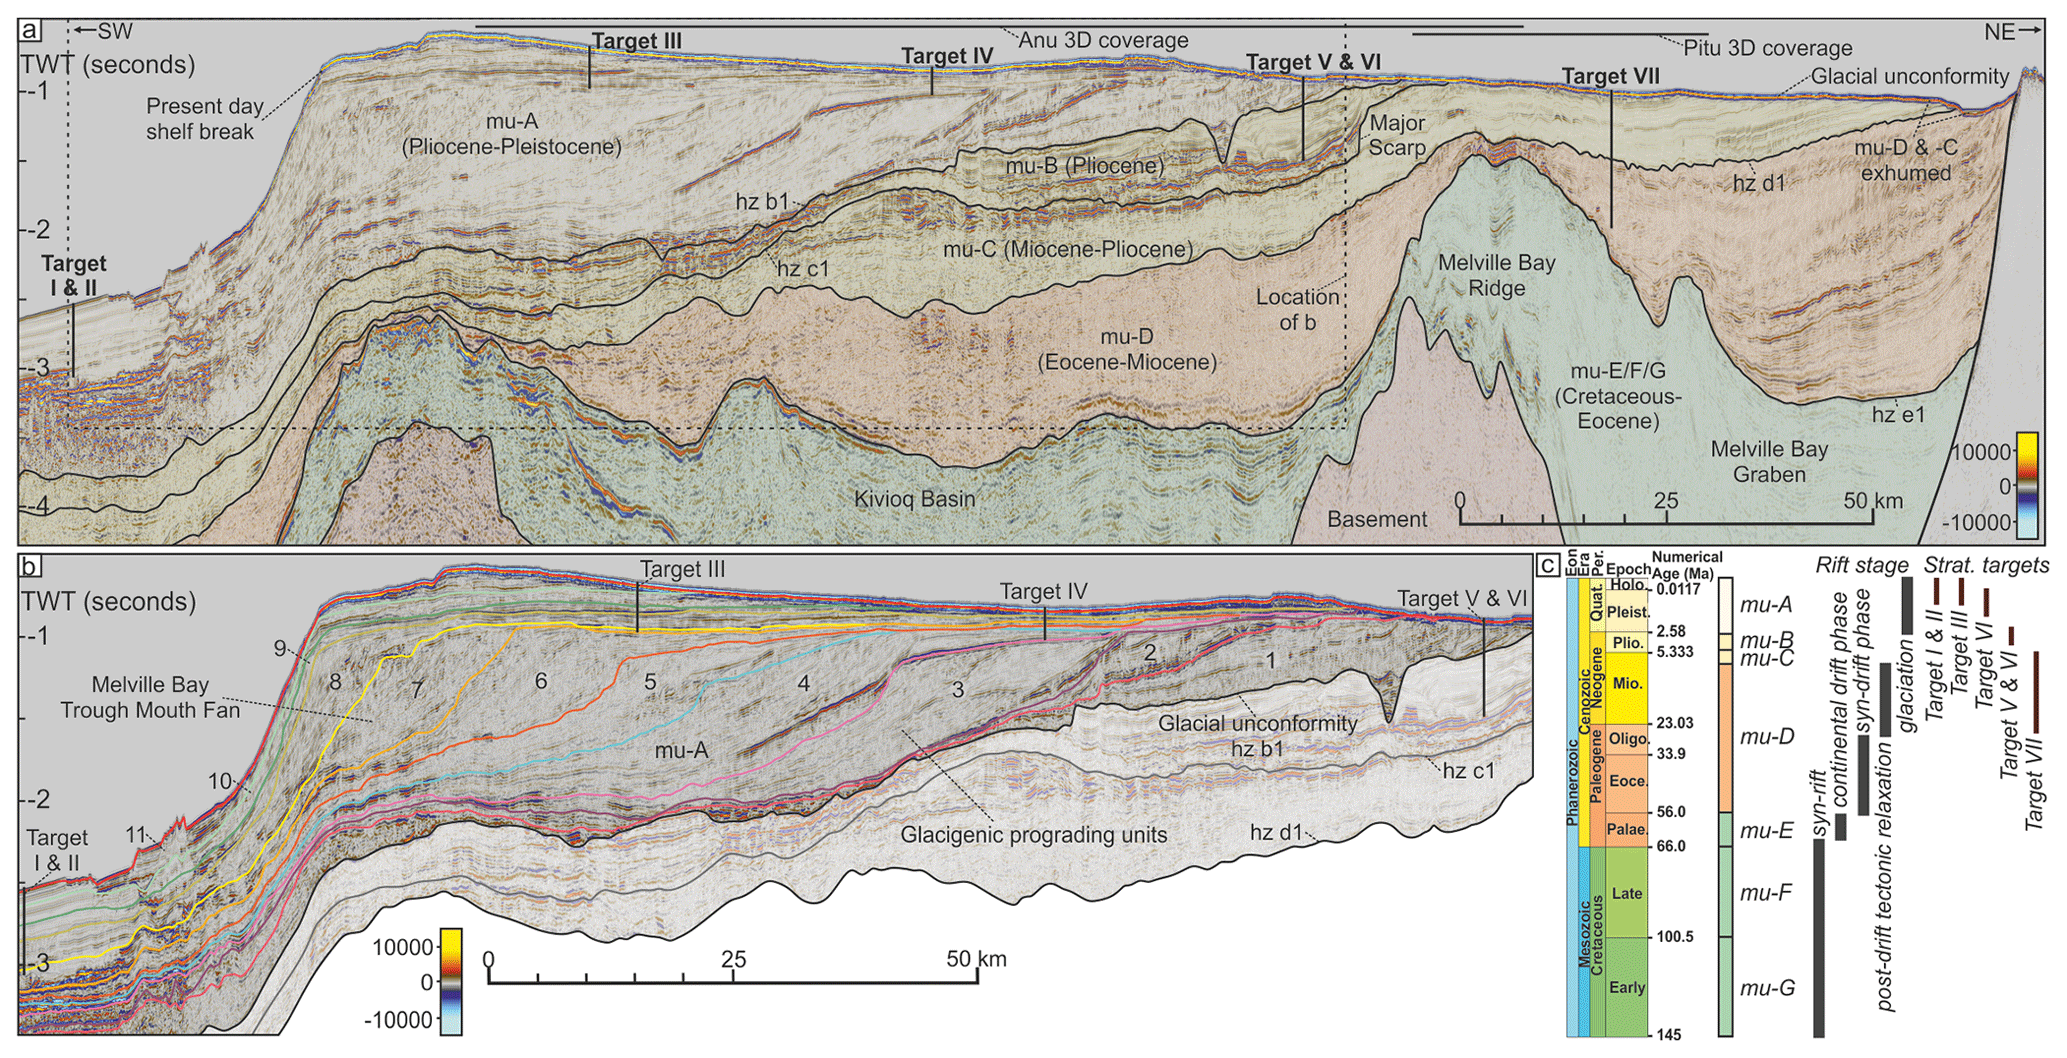
Figure 2Regional geology. (a) A 2D regional seismic reflection line showing the stratigraphy and structure across the shelf. Regionally mapped seismic mega-unit interpretations from Gregersen et al. (2013, 2017) and Knutz et al. (2015) are shown as well as the projected locations of the seven IODP Proposal 909 stratigraphic targets and the comparative coverage of 3D seismic data. (b) An enlarged section of the seismic line from A that focusses on the glacigenic wedge that represents the Melville Bay Trough Mouth Fan system, showing the 11 interpreted sub-units of mega-unit (mu)-A from Knutz et al. (2019) as well as the projected location and depth of the IODP Proposal 909 sites. The location of the seismic line is shown in Fig. 1. (c) A stratigraphic column displaying seven seismic mega-units and their associated rift stages, as well as the expected age of the stratigraphy that comprises each of the stratigraphic targets (I–VII).
On the inner shelf margin, thick late Miocene and Pliocene (mu-C and mu-B) marine sediments constitute the uppermost post-rift sequence (Knutz et al., 2015). This includes widespread, late Neogene contourites and their correlative mass transport deposits, down-slope from a major erosional scarp above the Melville Bay Ridge (Figs. 1 and 2). The Neogene sediments are exposed at the seabed on the inner shelf and are progressively buried towards the basin by thick glacigenic packages forming part of mu-A (Fig. 2) (Knutz et al., 2019). The exposure and burial of the Neogene marine successions occurred due to multiple phases of ice sheet expansion since the late Pliocene. Through these glaciations, material was eroded and redistributed, leading to over ∼ 100 km of shelf edge progradation and accumulation of the Melville Bay Trough Mouth Fan (MB-TMF) (Figs. 1 and 2) (Knutz et al., 2019; Newton et al., 2017). These glacigenic progradational units likely consist of highly variable sediment lithologies and grain size compositions (Christ et al., 2020; Knutz et al., 2019). The prograding units are separated by unconformities that generate distinct unconformable seismic reflections that express detailed morphologies formed by sub-glacial erosion and deposition, similar to the features observed on the present seabed (Newton et al., 2020, 2017).
The glacigenic succession (mu-A) has been subdivided into progradational units that suggest a minimum of 11 major phases of ice advance and retreat across the shelf since ∼ 2.7 Ma. These sub-units (1–11), proposed by Knutz et al. (2019), are used throughout this study (Fig. 2b). Furthermore, the regional stratigraphic framework consisting of seven seismic mega-unit subdivisions (mu-G to -A) (Fig. 2) was proposed after extensive regional mapping of the north-western Greenland continental margin by Gregersen et al. (2013, 2017) and Knutz et al. (2015).
2.2 Scientific drilling objectives
IODP Proposal 909 aims to illuminate the late Cenozoic history of the northern Greenland Ice Sheet (GrIS) and specifically to ascertain the paleo-ice sheet dynamics during past warm climates (Knutz et al., 2018). This will be achieved by recovering drill cores at seven sites along a transect crossing the north-western Greenland margin (Figs. 1 and 2), each recovering key stratigraphic targets (Targets I–VII) to obtain a composite stratigraphic succession from Oligocene/Early Miocene to Holocene (Fig. 2). The overall objective is to examine the range of feedback and forcing mechanisms (oceanic, atmospheric, orbital, tectonic) impacting the GrIS through time – addressing several current themes of the IODP Science Plan (Bickle et al., 2011).
2.3 Site-selection requirements
The seven stratigraphic targets (Targets I–VII) were selected along the south-west–north-east trending regional 2D seismic transect (Figs. 1 and 2) and represent high accumulation rate deposits within the hemipelagic sequence of mu-D, contourite drifts of mu-B and -C, as well as potential interglacial and proximal shelf deposits within the trough mouth fan system of mu-A (Fig. 2). Once stratigraphic targets were defined, specific drill sites were selected. The strategy for site selection was to maximize both the chance of reaching the stratigraphic target and the chance of good core recovery whilst avoiding all identified potential drilling hazards. Additionally, the selection of several alternate sites was required in preparation for unexpected drilling issues or iceberg mitigation management.
2.4 Regional geohazard considerations
The north-western Greenland margin is a frontier petroleum province, with potential Cretaceous source rocks identified across the region in shallow cores and outcrop (Fig. 1) (Acton, 2012; Bojesen-Koefoed et al., 2004; Nøhr-Hansen et al., 2018; Núñez-Betelu, 1993) as well as deep unexplored sedimentary rift basins (Henriksen et al., 2009). The area experienced a surge in oil and gas exploration activity between 2007 and 2014, resulting in five exploration licenses being awarded within Melville Bay and the acquisition of extensive 2D and 3D seismic datasets. A shallow coring program was carried out in 2012, but no exploration wells have been drilled. Since then, the identification of a large potential gas reservoir (Cox et al., 2020a) and widespread evidence for shallow gas and gas hydrates (Cox et al., 2020b) further support an active petroleum system, thus underscoring the need for a geohazard assessment study prior to drilling.
Today, marine-terminating glacial outlets do not expand much beyond the coastline, and Melville Bay is generally free of sea ice cover during the summer, allowing access to industry and research vessels (Saini et al., 2020). However, Arctic weather conditions and the potential for icebergs carried northward by the West Greenland coastal current present a challenge to any logistical operations in the area. The environmental factors, considered alongside the possibility of shallow hydrocarbon occurrence and coarse-grained Quaternary sediments indurated by ice loading, makes drilling complicated and highly reliant on site survey data. To evaluate and select coring sites for Proposal 909, available 2D and 3D seismic reflection data were used to conduct a comprehensive geohazard assessment that maximized the chance of safe drilling and successful core recovery.
The seismic data used within this study include four separate surveys that were acquired between 2007 and 2019 (Table 2). All data used were provided in SEG normal polarity with a downward increase in acoustic impedance represented by a red positive peak and a downward decrease in acoustic impedance represented by a blue negative trough (Fig. 2). The regional 2D data used in this study form part of four surveys that were acquired by the geophysical company TGS (2007–2010) as part of the Baffin Bay 2D regional dataset. The dataset was used to help understand the regional geology and map the spatial distribution of stratigraphic packages that represent drilling targets (full extent of the regional 2D survey shown by Gregersen et al., 2019 – Fig. 1). From the TGS 2D data, a subset of seven lines crossing the Melville Bay shelf was used directly within the site-selection process (Fig. 3, Table 2).
Table 2Acquisition parameters and survey statistics for the four seismic surveys used within this study. A dash (–) represents a parameter that is not applicable for that survey. The Pitu HR parameters can be read from the Pitu survey. Abbreviations used within the table include two-dimensional (2D), three-dimensional (3D), ultra-high-resolution (UHR), reprocessed (repro.), number (No.), average (Avg) and two-way time (TWT). Units used include metres (m), kilometres (km), milliseconds (ms), seconds (s) and hertz (Hz).

∗ The dominant wavelength was calculated using an average velocity of 2000 m s−1.
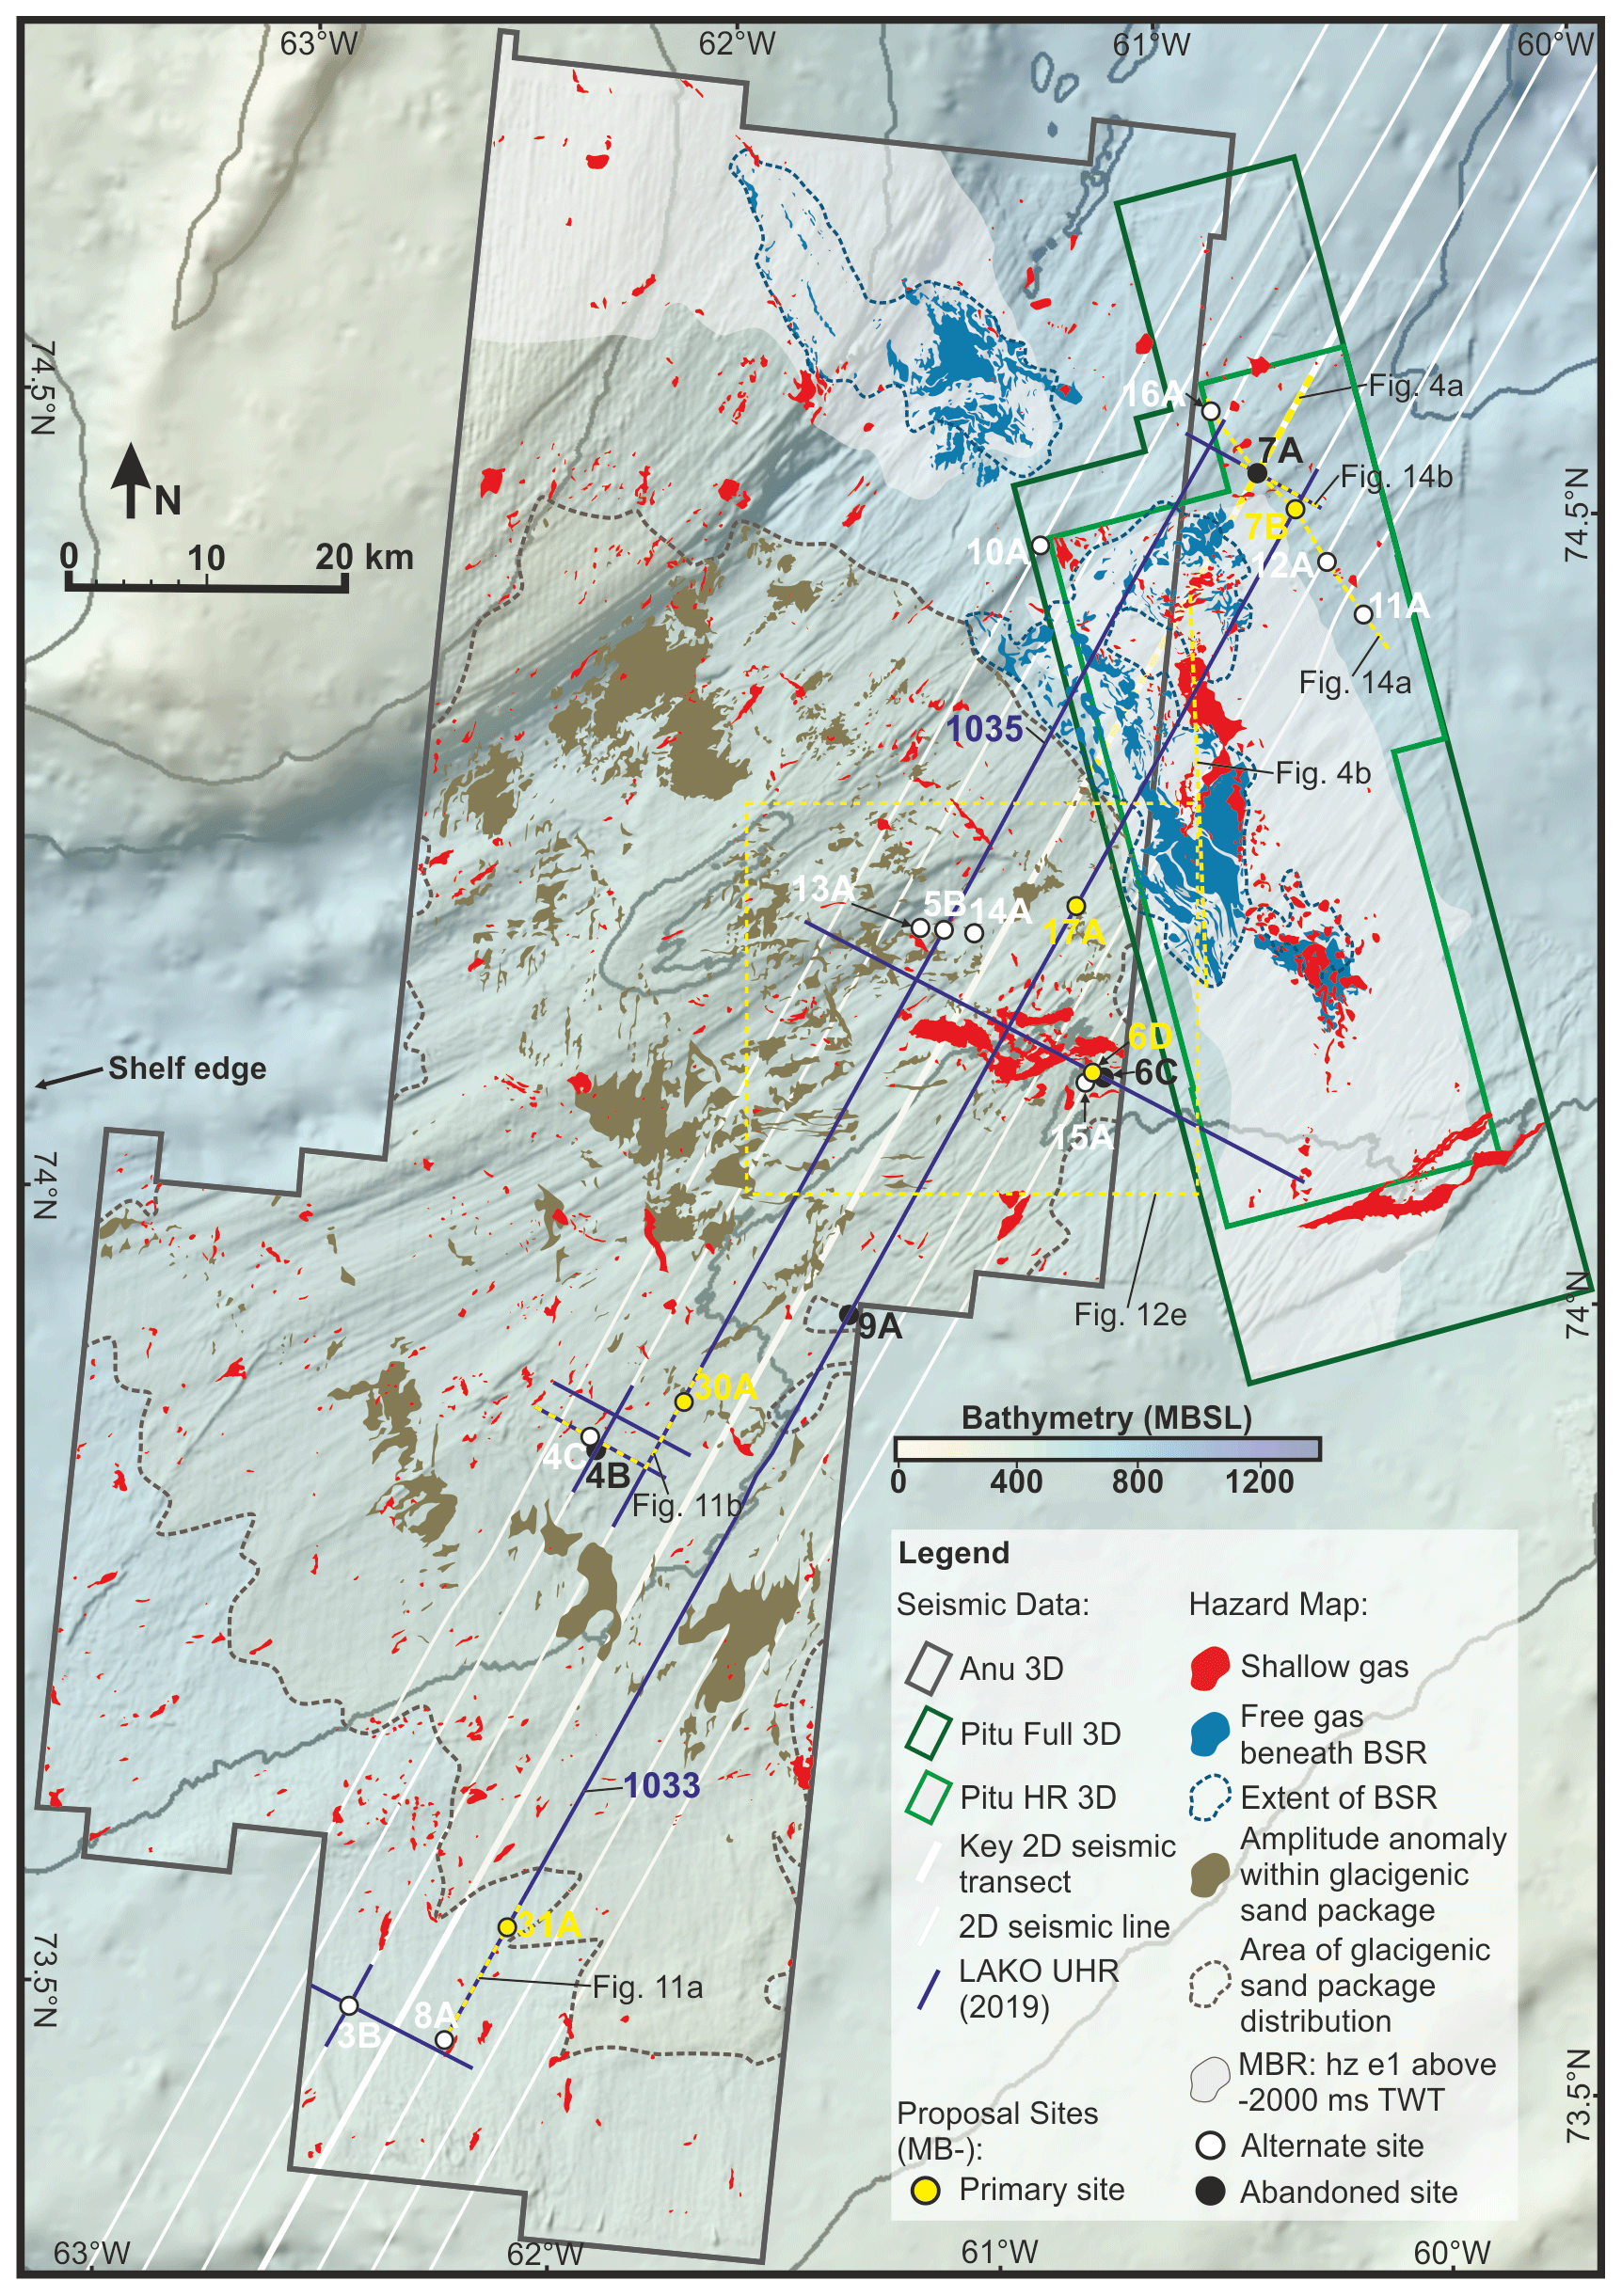
Figure 3A fluid hazard and data map of the study area displaying the regional bathymetry from Newton et al. (2017) as well as the location of all seismic data used within the Proposal 909 study. The locations of potential fluid anomalies were identified and mapped via the shallow gas detection process within the geohazard assessment workflow. Active and abandoned IODP Proposal 909 sites that exist within the 3D seismic extent are shown as well as the location of the Melville Bay Ridge (MBR) and Figs. 4a, b, 11a, b, 12e, 14a and b.
Two 3D seismic surveys represent the principle data used for geohazard detection within this study (Fig. 3). The first is the Pitu survey that was acquired by Cairn Energy PLC in 2011 (Table 2). This survey was also provided as a pre-stack depth migration (PSDM) volume. The survey was reprocessed by CGG in 2013 to provide the Pitu HR (high-resolution) survey, which is a subset of the full volume with increased spatial and vertical resolution (Table 2). The second 3D survey, the Anu survey, provides extensive 3D coverage towards the shelf edge and was acquired by Shell in 2013 (Fig. 3). In 2019, a new ultra-high-resolution (UHR) survey, the LAKO UHR survey (LAKO is an acronym for the research vessel HDMS Lauge Koch), was acquired across several preliminary site locations through collaboration between the Geological Survey of Denmark and Greenland and Aarhus University (Pearce et al., 2019) (Table 2 and Fig. 3). The aim was to provide UHR imaging of the upper 500 ms below the seabed in order to supplement the existing industry seismic data within the pre-defined target areas. In addition, several longer transects were obtained that could provide additional seismic–stratigraphic information and add to the reconnaissance of additional sites. Eight lines from the UHR survey were used to characterize drill sites located within the areas of 3D seismic coverage (Fig. 3).
Depth conversion
Depth conversion was required to provide accurate estimates of seismically defined drill target depths in metres. Velocity information was provided from industry wells drilled by Cairn Energy PLC ≳ 300 km south of the transect (location shown in Gregersen et al., 2019 – Fig. 1), from shallow core sites U0100/110 (Fig. 1) and from an interval velocity cube that was provided over the Pitu survey area (Figs. 3 and 4). The interval velocity cube was created from seismic velocities during seismic processing through the application of a Kirchhoff pre-stack TTI depth migration (PSDM) that used a bin size of 12.5 × 25 m and a migration half aperture of 4500 m (Fig. 4). This process produced a depth-converted version of the Pitu 3D survey. The interval velocities and the depth cube, however, have not been calibrated to measured depth data, due to large distances to the closest well (≳ 300 km), and likely contain some error.
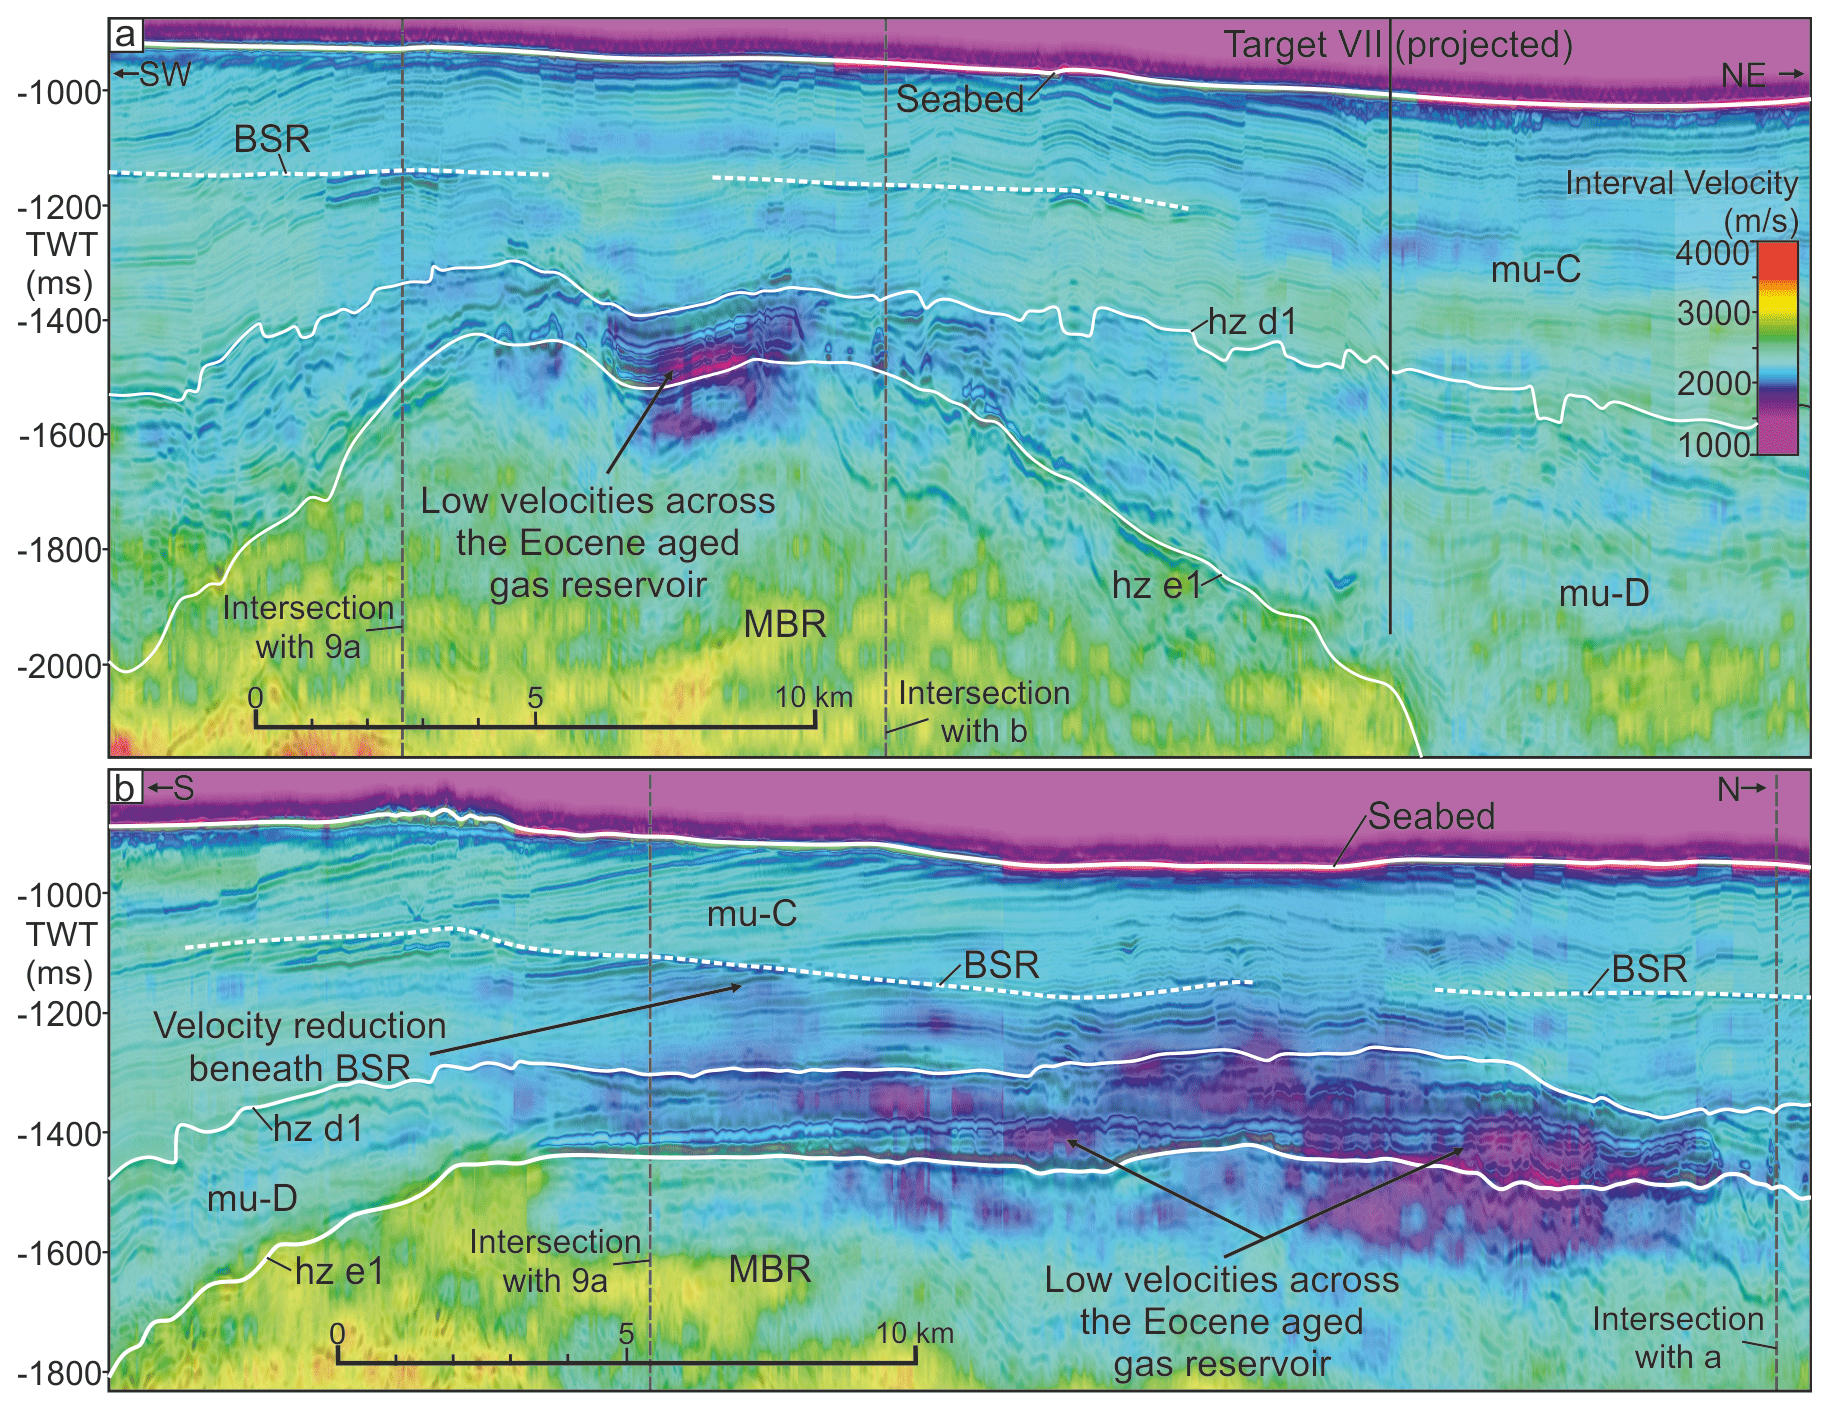
Figure 4Interval velocities created through Kirchhoff pre-stack TTI depth migration (PSDM) for the Pitu survey overlaid on seismic reflection dip (a) and strike lines (b) in two-way time across the Melville Bay Ridge structure. Velocity reduction likely due to the presence of gas can be observed in the location of the Eocene-aged reservoir on top of the ridge as well as beneath a bottom-simulating reflector (BSR) within the free gas zone. The locations of panels (a) and (b) are shown in Figs. 3 and 9.
Therefore, average velocities were determined using all of the velocity data available (mentioned above) and were then extrapolated across the study area using a comparison of the potential lithology and depositional setting of the sediments as well as their general depth. Linear time–depth equations were also generated for sites within the glacigenic wedge to consider elevated compaction and velocity due to ice loading. Velocities from this linear trend were then compared against the original estimated average velocities and interval velocities from the velocity cube to calculate the potential error (often ∼ 100 m). This error was used to adjust the final metric depth targets to minimize overestimation and avoid drilling into deeper, potentially hazardous intervals.
The following geohazard assessment workflow was used to select drill sites that represent the lowest possible risk whilst meeting the scientific objectives (Fig. 5). The workflow considers the increasing availability of data that are typical through a project's progression, starting with regional 2D seismic data to understand the regional geology and pick initial stratigraphic targets and sites. Three-dimensional seismic data are then used to conduct a more detailed interrogation of the subsurface in order to delimit geohazards within the proposal area and guide site selection and minimize risk. Finally, additional data, in this case 2D UHR seismic data, are used in collaboration with the 3D seismic to fine-tune the selected sites to ensure they represent the most suitable and safest locations possible.
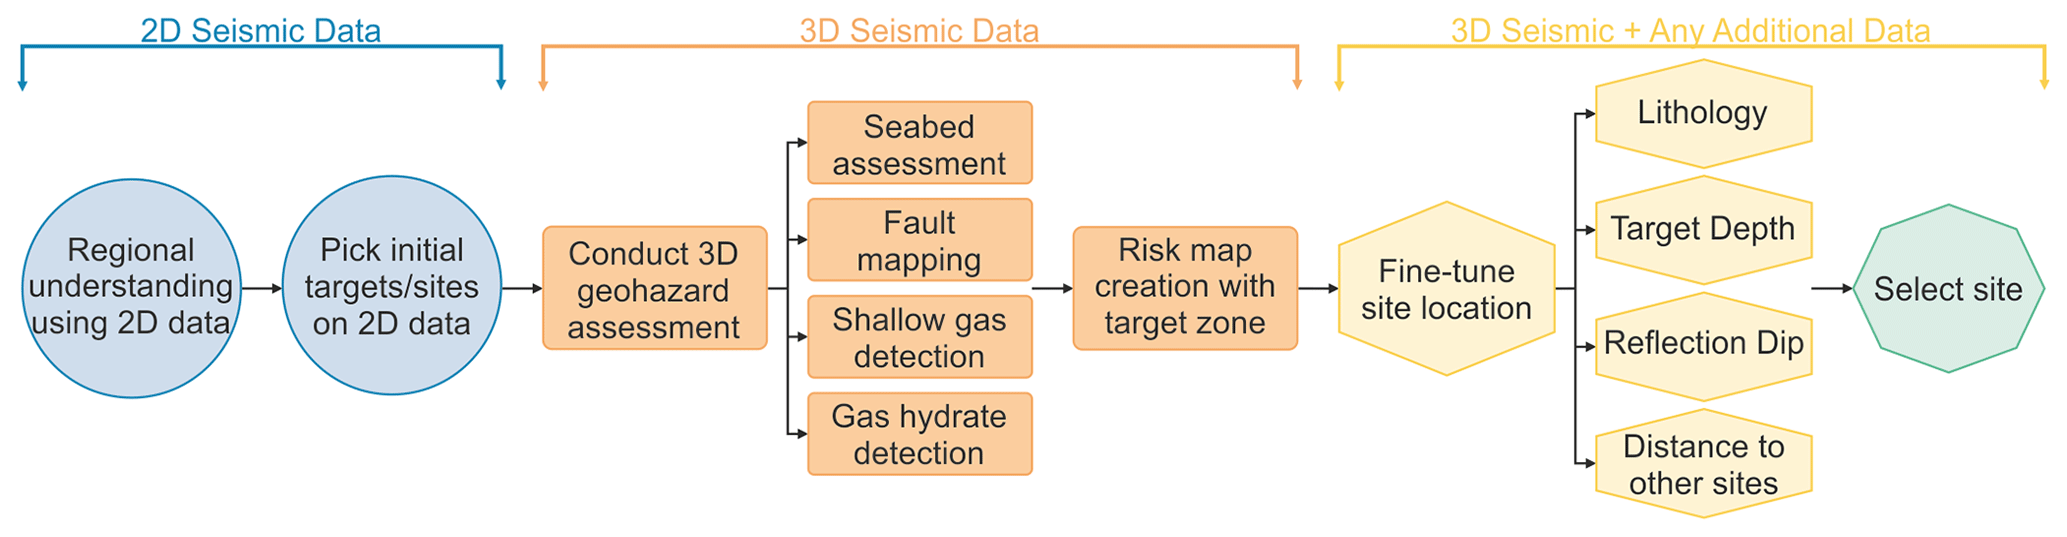
Figure 5A workflow diagram that outlines both the steps conducted within the geohazard assessment leading to site selection and how the differing seismic data types were used throughout the process. This workflow should be used as a guide for future geohazard assessments using 3D seismic data but is not fully exhaustive and can be amended to fit different datasets and locations through the addition of extra steps that fulfil the requirements of future projects.
4.1 Seabed
The first step of the 3D seismic geohazard assessment is to map the strong, positive amplitude event that represents the seabed across the area of 3D coverage (Fig. 6). This provided the seabed depth, firstly in TWT and subsequently in metric depth, after a conversion using a typical seawater velocity of 1480 m s−1 (based on the Pitu interval velocity cube) (Fig. 6a). A bathymetric compilation from Newton et al. (2017) provided an additional high-resolution image of the seabed morphology. The mapping, supported by the bathymetry data, identified a wide range of seabed features that have been interpreted as being of glacial origin, created by recent shelf glaciations, including lineations, ridges, iceberg scours and near-circular depressions interpreted as iceberg pits (Fig. 6; Newton et al., 2017). These features can create localized areas of high-dip and highly compacted sediment and should be avoided to prevent instability of the coring equipment on the seabed (Bennett et al., 2014).
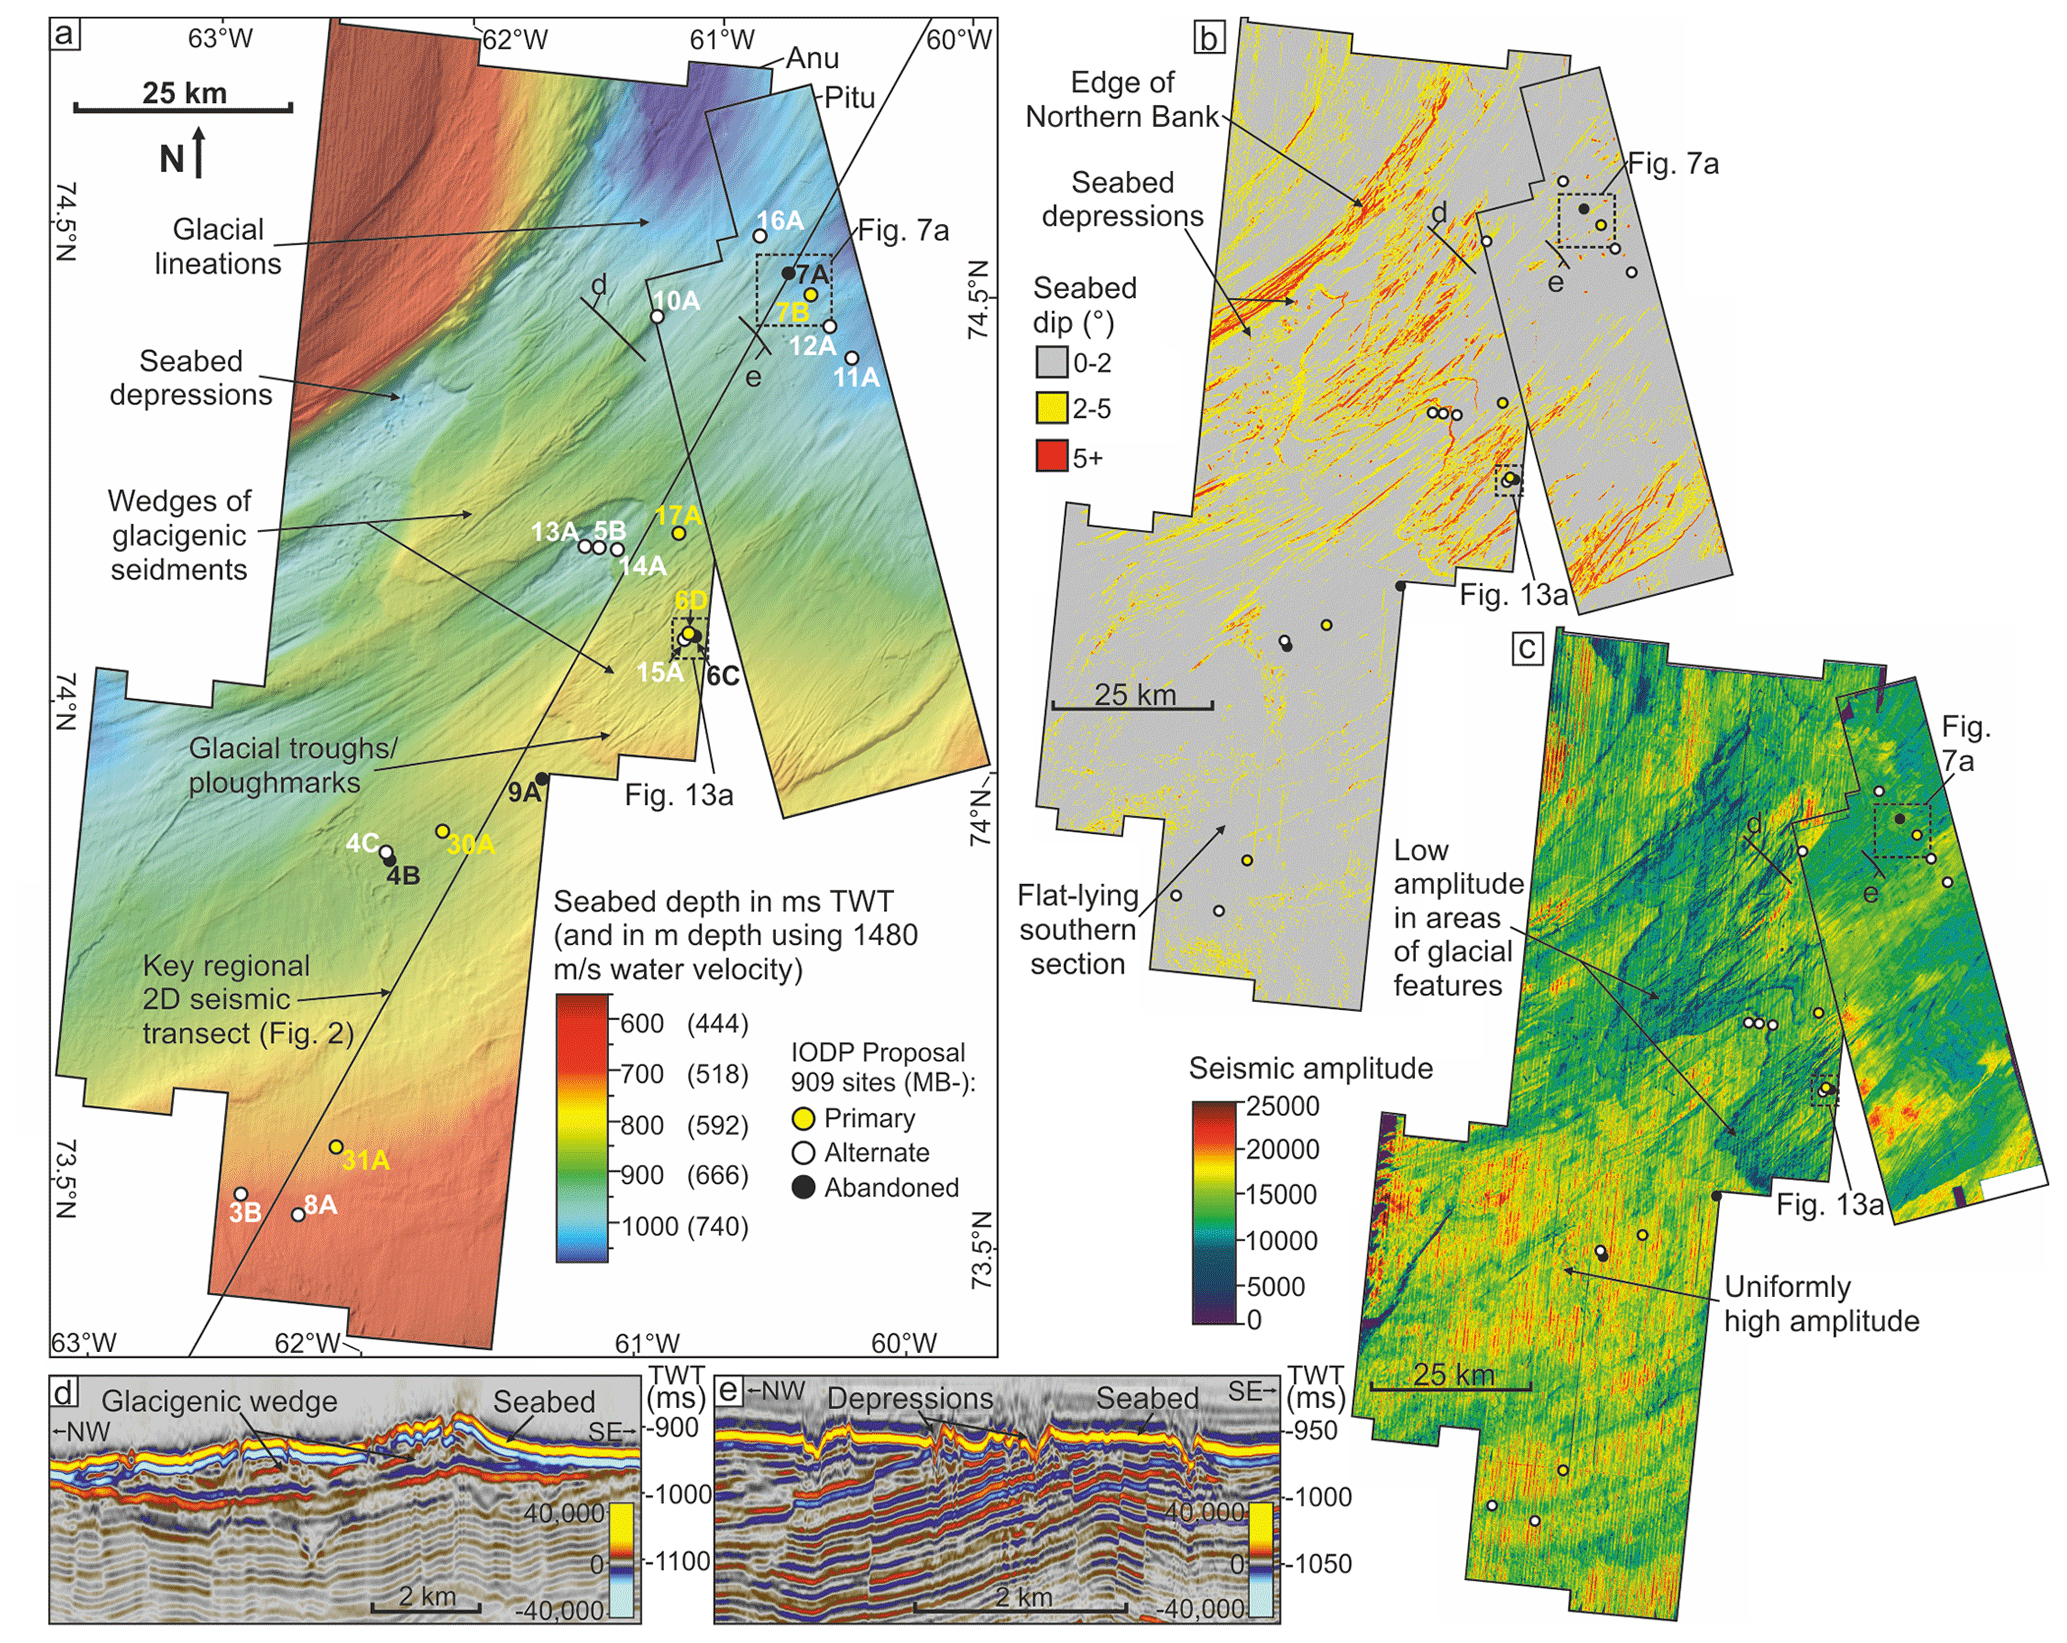
Figure 6Seabed mapping. (a) A seabed structure map across the 3D seismic coverage shown in both two-way time and converted metric depth, with the bathymetry data from Newton et al. (2017) shown beneath. (b) A dip attribute map across the 3D seismic coverage that has been filtered to display features by dip severity, with colours amber and red relating to moderate (2–5∘) and high (5+∘) risk respectively. (c) An amplitude attribute extraction map at the seabed surface across the 3D seismic extent showing the variation in amplitude between areas dominated by or free from glacigenic features. The locations of both active and abandoned IODP Proposal 909 sites are shown in panels (a)–(c) along with the locations of panels (d) and (e), Figs. 7a and 13a. (d) A seismic cross section from the Anu survey showing an example of a glacigenic wedge which is topped by glacial lineations. (e) A seismic cross section from the Pitu HR survey showing the unconformable nature of the seabed as well as seabed depressions that likely represent iceberg pit marks (cf. Brown et al., 2017).
A structural dip attribute was extracted onto the mapped seabed surface to identify areas of high seabed dip (Fig. 6b). Filtering of the attribute allowed the severity of dip to be separated into areas of low (0–2∘), medium (2–5∘) and high (5∘+) dip, which relates to areas of low, medium and high risk respectively. The seabed dip–risk cut-offs are used here primarily to help avoid glacial geomorphological features on the seabed, but this technique is applied in commercial geohazard assessments to consider the effect of the seabed structure on the critical failure of slope sediments as well as seafloor infrastructure tension and strength (Dan et al., 2014; Vanneste et al., 2014). The cut-offs selected are relatively low compared to other studies (e.g. Haneberg et al., 2015), but these were chosen to remain cautious and decrease potential risk, as much of the study area is relatively flat lying and therefore remains classified as low risk (Fig. 6b). Applying a cautious approach allows for steeper-dipping sections to be documented for further analysis should the underlying stratigraphy be potentially suitable for drilling – e.g. steep dip does not necessarily preclude drilling, but these bins allow for areas requiring greater consideration to be highlighted. Seismic amplitudes were also extracted onto the seabed surface (Fig. 6c). Extreme high or low amplitudes were shown to coincide with either glacial depositional features (such as Fig. 6d) (low amplitudes) or iceberg pit marks/depressions (high amplitudes) (Fig. 6e), supporting the inferred composition of elements represented by areas of high dip. Away from these features, the seabed amplitude is relatively uniform.
4.2 Faults
Fault mapping within the 3D survey area involved the use of the variance seismic volume attribute (coherency within other software packages) to image discontinuities, viewed mainly through time-slice intersections (z slice) (Fig. 7). Faults in the immediate area of the drill sites were manually mapped, including small faults belonging to a dense polygonal fault system within the post-rift stratigraphy of mu-D and -C (mainly within the Pitu area) (Cox et al., 2020a). Several deep-seated faults are observed extending close to the seabed (Fig. 7b), potentially connecting deeper fluid pressures to the shallow stratigraphy, which would represent a significant drilling hazard. Therefore, in areas close to a proposed site, fault characteristics were assessed based on their vertical extents, offsets and possible connections to deeper seismic anomalies (as shown in Fig. 7). High risks were associated with faults displaying connections to deeper anomalies; however, it was recommended to avoid all fault penetrations where possible to maximize the chance of good and stratigraphically continuous core recovery.
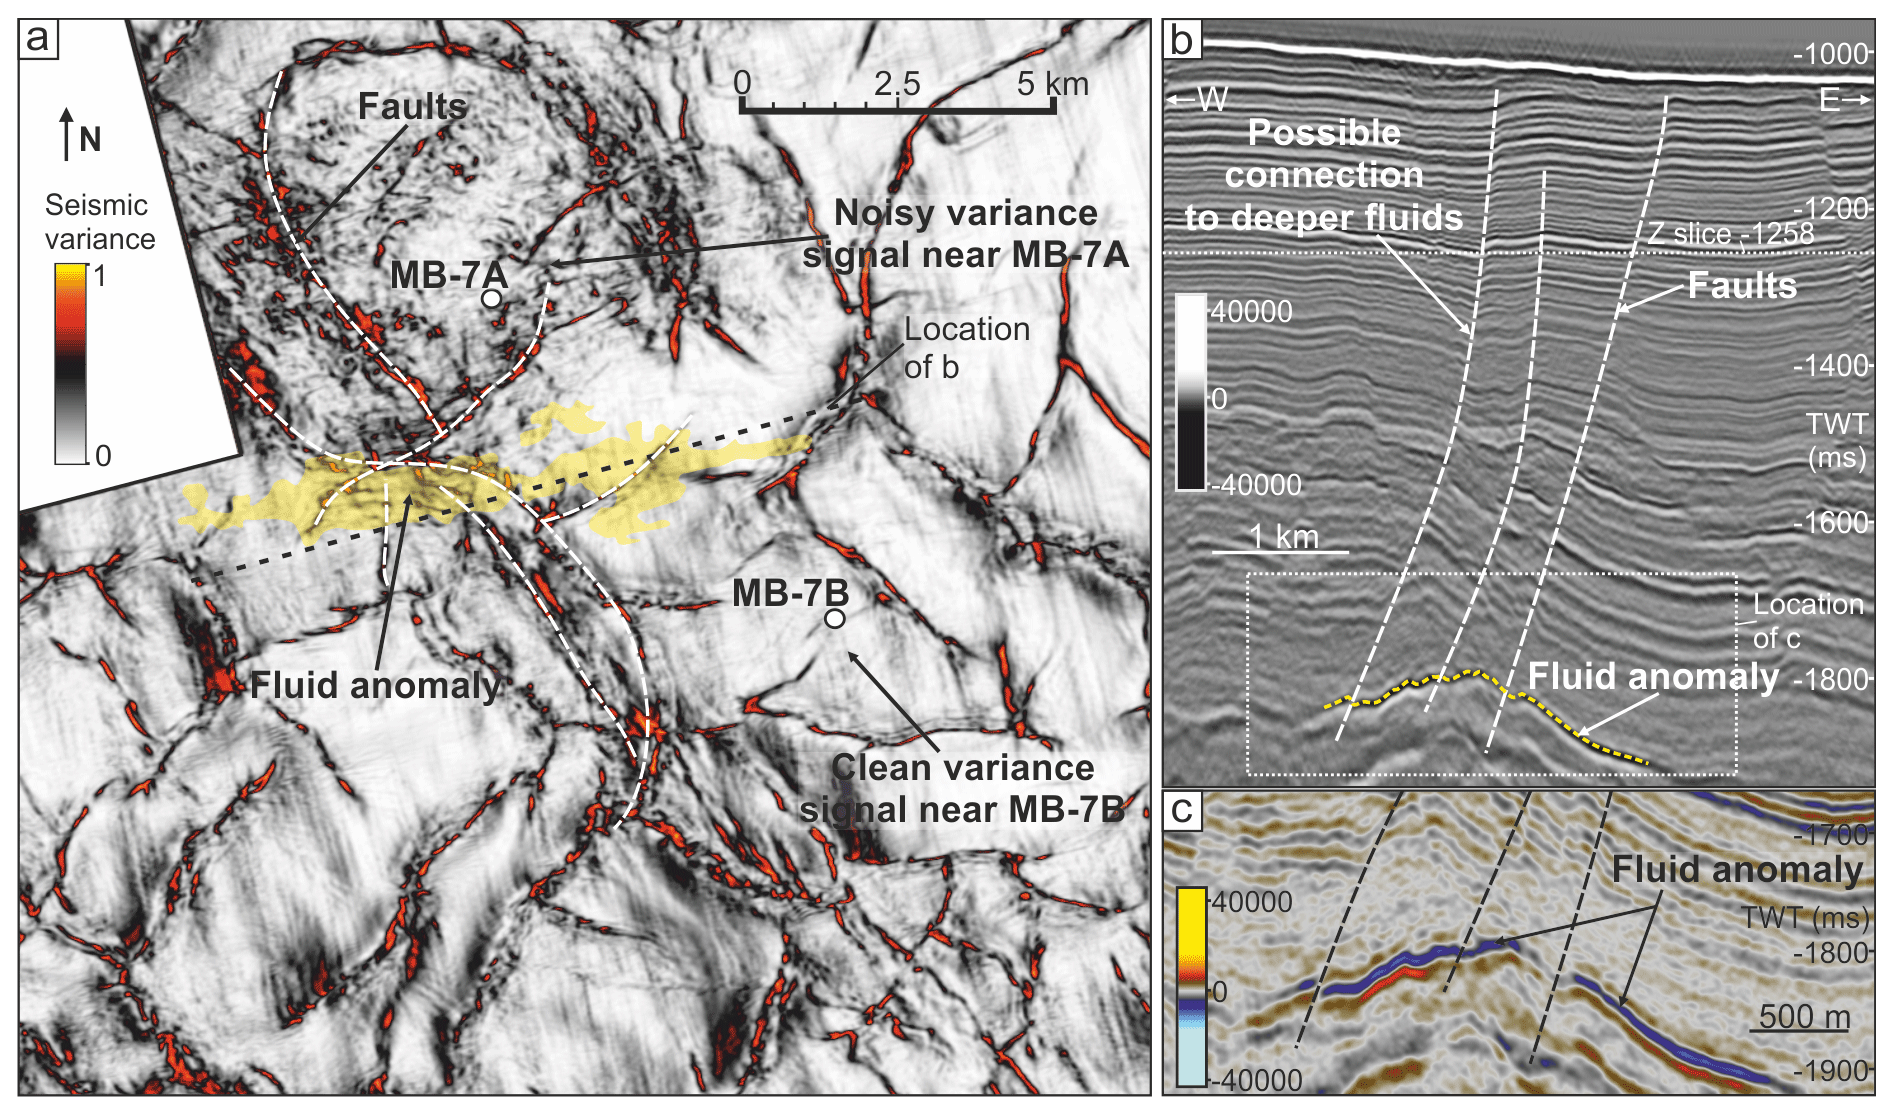
Figure 7Fault mapping. (a) A time-slice intersection (z slice) through the Pitu HR survey displaying the variance structural attribute to highlight fault locations at a depth of −1258 ms two-way time. Interpreted fault planes (white dashed lines) are shown as well as the spatial distribution of a potential hydrocarbon fluid anomaly that may be in pressure communication to shallower depths due to the intersection with fault planes. IODP Proposal 909 sites MB-7A (abandoned) and MB-7B (primary) are also shown as well as the location of panel (b). The location of panel (a) is shown in Fig. 6a. (b) A seismic cross section from the Pitu HR survey in black and white to emphasize faults, which displays interpreted fault planes and the location of a deeper fluid anomaly as well as the location of panel (c). (c) An enlarged seismic cross section from the Pitu HR survey that shows the seismic character of the deeper fluid anomaly.
4.3 Shallow gas detection
Gas-related seismic anomalies are expected to display “bright”, anomalously high negative amplitudes due to gas fluids causing a reduction of the bulk modulus (due to the extremely low density of gas) causing a significantly negative acoustic impedance contrast across the boundary at the top of the gas-bearing reservoir (Cox et al., 2020c; Hilterman, 2001; Nanda, 2016). A positive seismic amplitude, often of comparable amplitude, is often associated with the gas–oil–water contact or the base of the reservoir if it contains anomalous fluids across its entire vertical extent. For thin reservoirs filled with gas, the response is often a highly asymmetric high negative to high positive doublet (Cox et al., 2020c; Raef et al., 2017). The presence of oil can cause a similar but often much reduced seismic anomaly. Due to these phenomena, the 3D seismic data were investigated to understand the seismic character of fluid-related anomalies within the study area. This included the physical character of anomalies, which were often isolated bright spots or brightening along single horizons (Fig. 8), as well as their spatial and stratigraphic distribution, which was widespread within all levels of the post-rift stratigraphy (mu-D to -A) and focussed around the Melville Bay Ridge (Cox et al., 2020b). The seismic amplitude range of the bright anomalies was also analysed to aid amplitude extractions. The analysis identified that an amplitude of negative (–) 10 000 or above likely represented a fluid anomaly, although some dim anomalies can occur beneath this limit, and this was considered during the filtering of results (Fig. 8c). Dimmer anomalies can be attributed to poorer reservoir quality or thin bed tuning effects, whereas amplitude is expected to be insensitive to gas saturation when this exceeds 10 % of the pore volume (e.g. Hilterman, 2001).
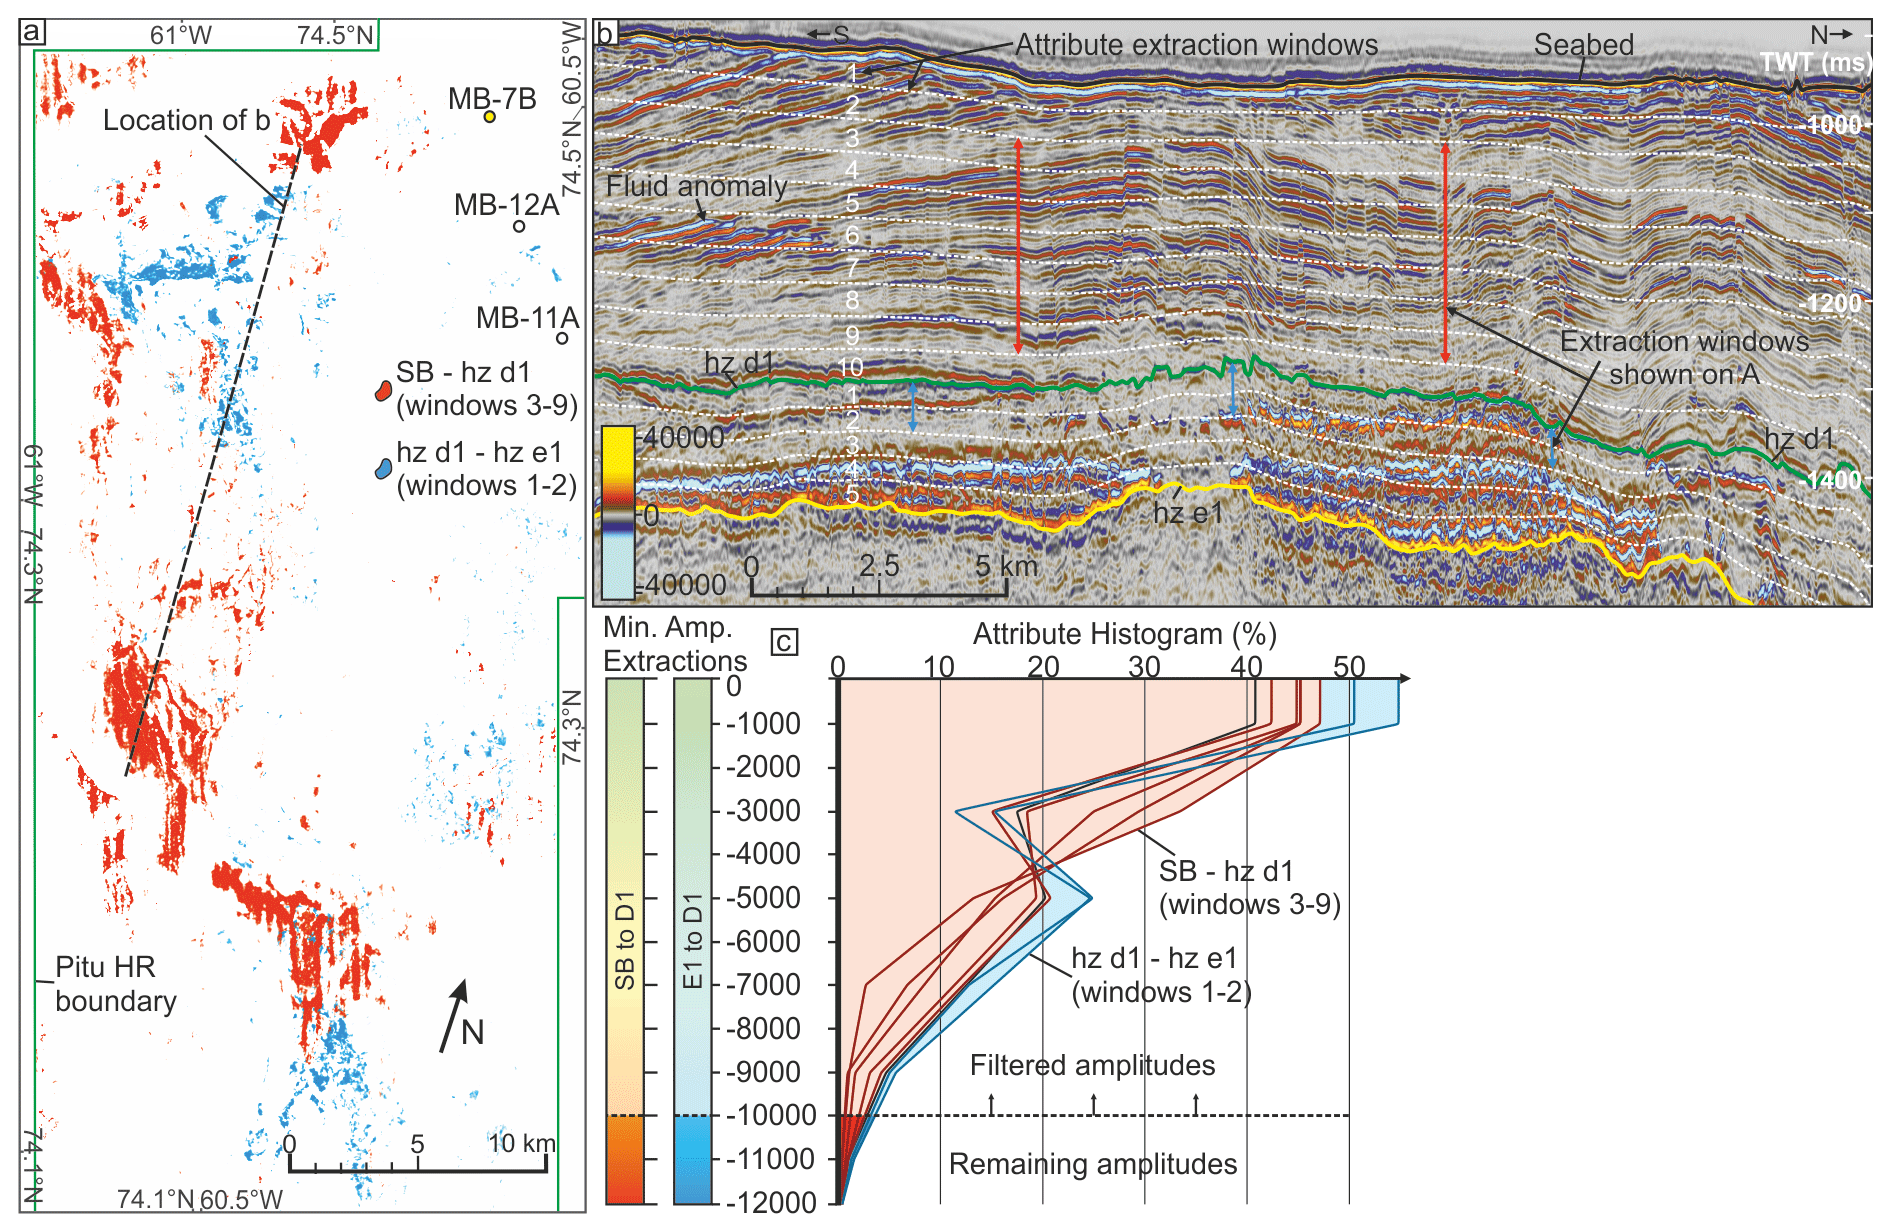
Figure 8Shallow gas detection. (a) A 2D map view of several overlaid windowed minimum amplitude extractions from the Pitu HR survey that have been filtered to only display amplitudes that are greater than −10 000 and likely represent fluid anomalies. The extracted amplitudes have been colour coded to distinguish between windows from different mega-unit packages, giving a sense of anomaly depth, a technique which can also be applied to individual windows. The windows displayed are shown in both panels (a) and (b). The IODP Proposal 909 sites in this area are also shown in locations that avoid the potential fluid anomalies as well as the location of the seismic line used in panel (b). (b) A seismic cross section from the Pitu HR survey that highlights the main horizons used to create the proportionally distributed extraction windows. Several seismic anomalies that will be identified within the extractions are also shown along with the specific windows displayed in panel (a). (c) A histogram that shows the distribution of amplitudes from the selected extraction windows shown in panels (a) and (b). The histogram and the colour bars show how the amplitudes have been filtered to only show the extreme values which are more likely to represent fluid anomalies. These amplitude cut-offs can be altered for specific windows to either display or hide certain amplitude ranges.
Once this initial analysis was complete, the information was used to automatically extract amplitude anomalies from the 3D seismic data above the defined threshold that likely represents hydrocarbon occurrences. This process used a series of minimum amplitude extraction windows that cut proportionally through the stratigraphy, extracting the most negative amplitude at every seismic trace (Fig. 8). The amplitude extraction result was then filtered to remove the majority of data and highlight just the most negative amplitudes (those that likely represent fluid anomalies) (Fig. 8c).
The stratigraphy was split into two units for the extractions, the first between the seabed and seismic horizon (hz) d1 with 10 proportional extraction windows (each ∼ 50 ms TWT thick) and the second between hz d1 and hz e1 with 5 windows (each ∼ 35 ms TWT thick) (Fig. 8). Using relatively narrow windows provided some depth control for each anomaly, which can be displayed through colour coding (Fig. 8a), instead of having a wide depth estimate that is as thick as the seismic mega-unit. This was important when selecting a shallow drill site where many of the deeper anomalies well below the target are less relevant. It also allowed the windows to be displayed separately, i.e. just for a particular depth zone. Furthermore, the resulting amplitudes for each window were often filtered differently (often using opacity rendering) in an attempt to highlight the anomalies at that level and also to try and remove unwanted amplitudes that may mask fluid events, such as naturally bright horizons, data acquisition footprints (near the seabed) and amplitudes interpreted as not representing fluid anomalies.
Once the data had been filtered, the individual scrutiny of each anomaly was conducted to determine whether that anomaly was in fact fluid-related or whether the anomalous amplitude may instead represent something else (such as the high amplitude causing features mentioned above). This evaluation is subjective to some degree, and this should be considered in the final result. Nonetheless, this evaluation was important as it stops potentially credible locations from being ruled out due to non-fluid-related anomalies and may also highlight other dimmer amplitude anomalies that were missed. This whole process was iterative and involved returning to the attribute extraction or filtering stage to adjust the parameters when required to ensure all potential anomalies were considered.
Once the result was finalized, the locations of the remaining amplitudes were used both within the interpretation software directly and within GIS software for spatial analysis. The remaining amplitudes were either converted into 2D automatic boundary polygons or extracted as 3D geobodies to allow efficient visualization and to aid the creation of multi-layer hazard maps used within the site-selection process (Fig. 3).
4.4 Gas hydrate detection
Bright fluid anomalies were identified hosted within inclined, likely sandy, strata that terminate abruptly at a certain depth beneath the seabed (Fig. 9) (Cox et al., 2020b). This level, characterized by a dim, negative amplitude reflection that cuts across the stratigraphic layering in a manner that mirrors the seabed topography, represents a bottom-simulating reflector (BSR). Such cross-cutting features have been interpreted as representing the base of a zone containing stable gas hydrates, below which free gas can become trapped, resulting in a bright negative cross-cutting reflection that may be discontinuous or continuous depending on the degree of porosity and permeability variations of the host strata (Fig. 9) (Berndt et al., 2004; Kvenvolden, 1993).
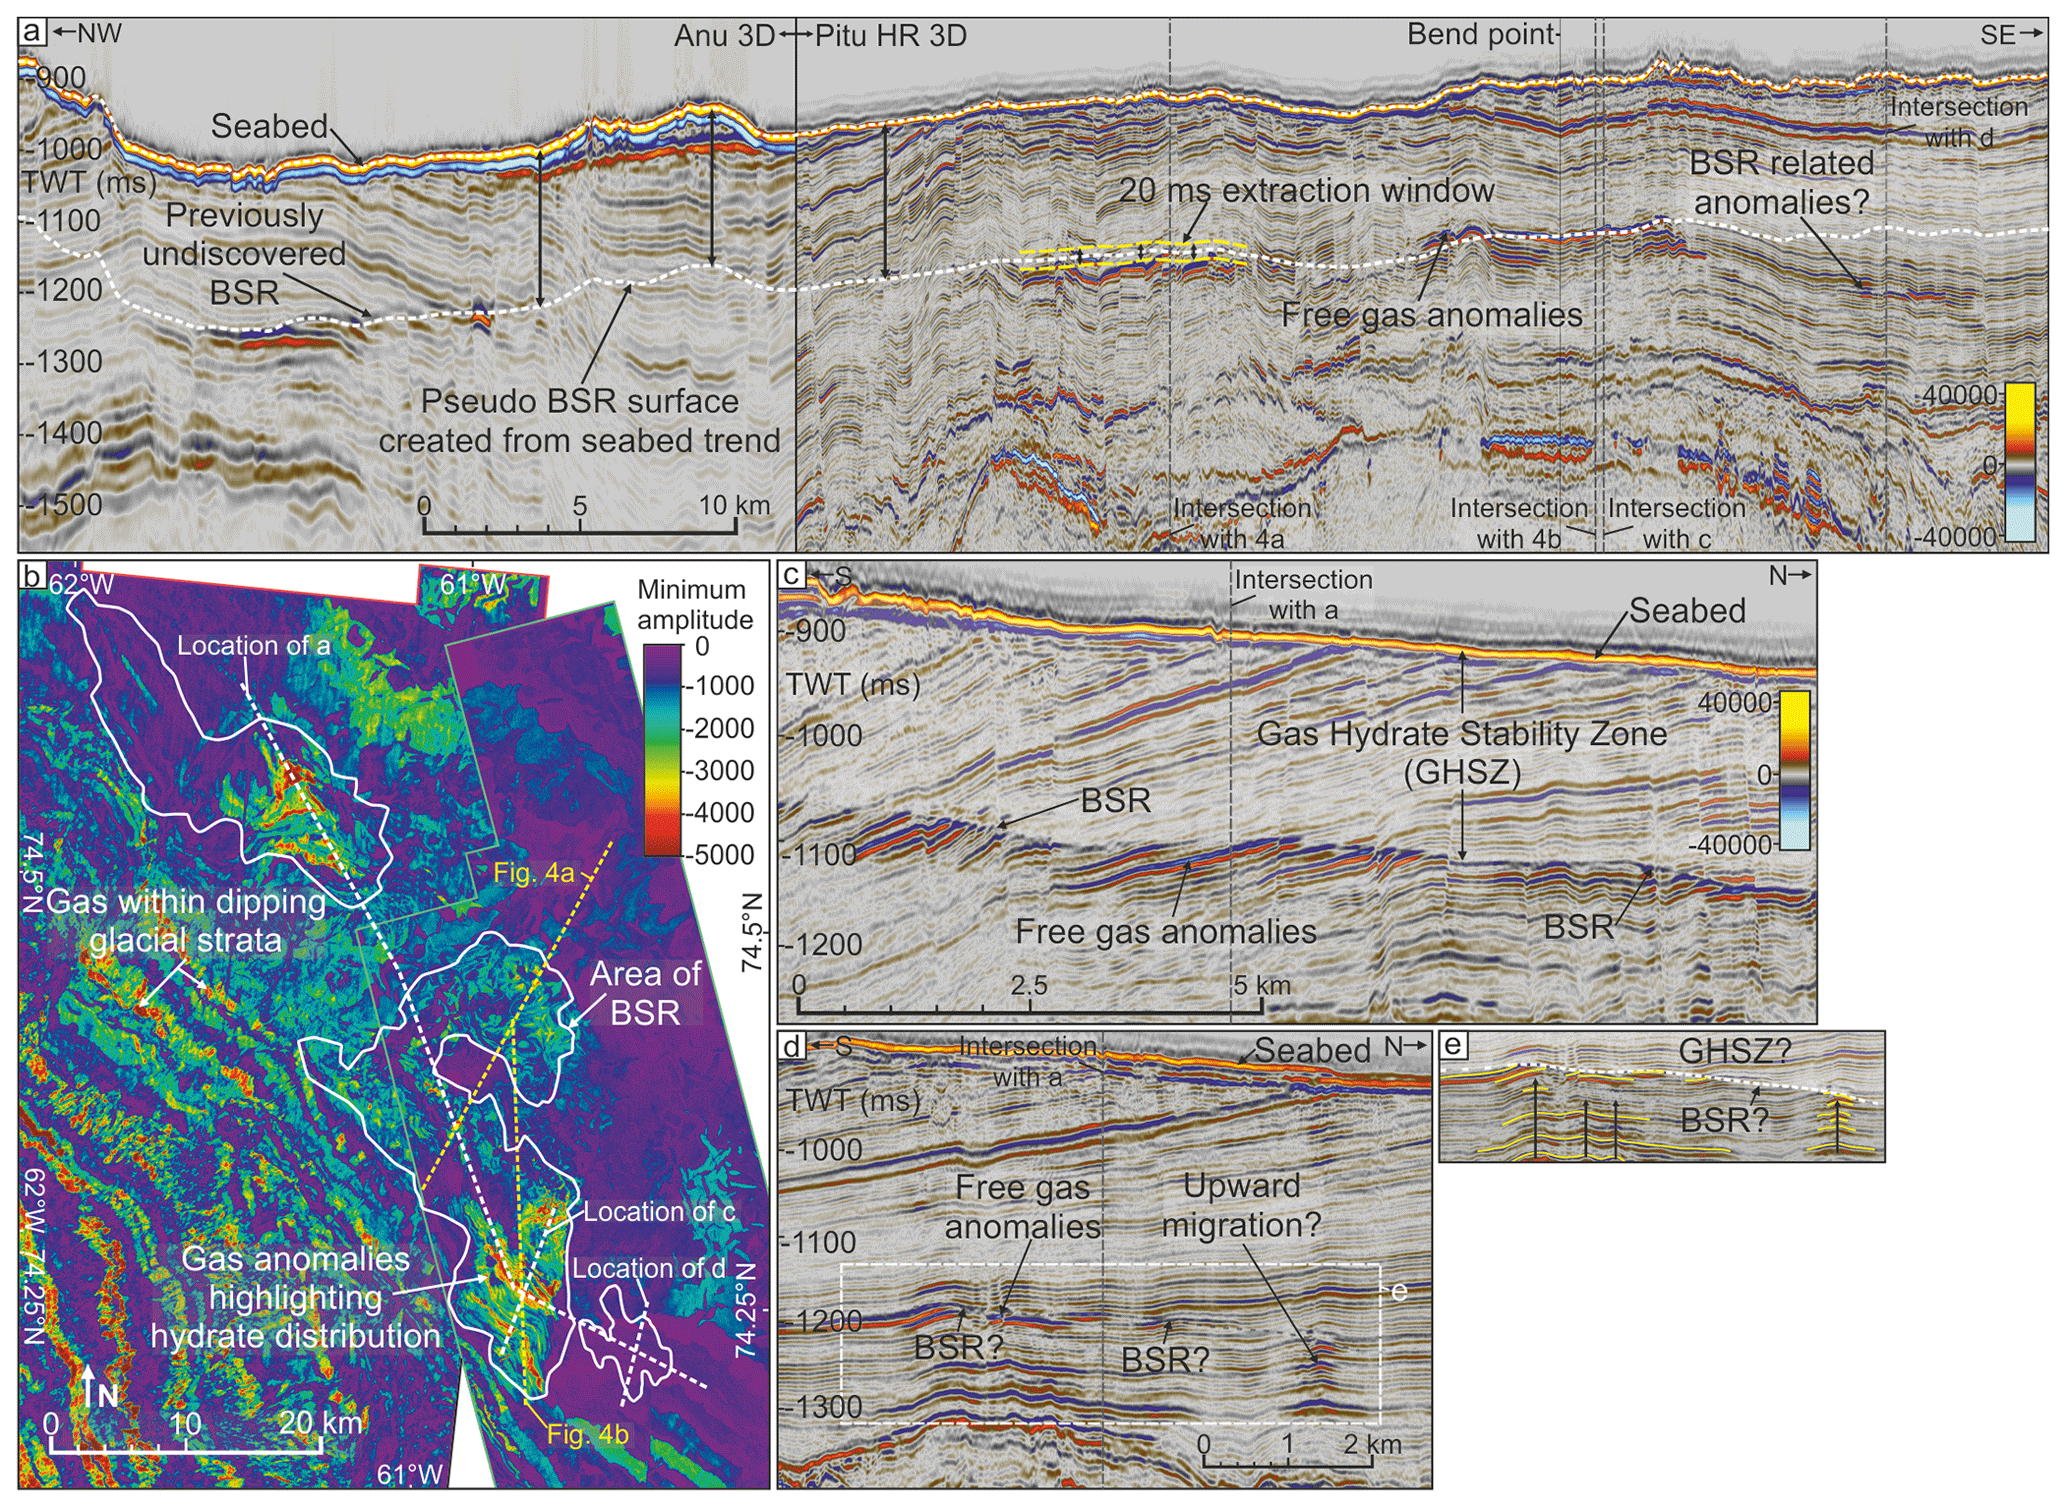
Figure 9Gas hydrate detection. (a) A composite seismic cross section through the Anu and Pitu HR surveys showing the distribution and seismic character of the identified BSR in the study area. The white dashed line (ca. 200 ms below seabed) at the BSR represents the pseudo BSR surface. (b) A 2D map view of a minimum amplitude extraction across the pseudo BSR surface showing the distribution of bright negative amplitudes that likely represent trapped free gas. The mapped area of the BSR is shown as well as the locations of the seismic lines used in panels (a), (c), and (d), Fig. 4a and b. (c) A seismic cross section from the Pitu HR survey confirming the presence of the BSR along with multiple free gas anomalies trapped beneath it. (d) A seismic cross section from the Pitu HR survey across the area containing a potential deeper BSR (ca. 300 ms below seabed). The location of panel (e) is also shown. (e) A zoom-in of a section of panel (d) showing the location of fluid anomalies (yellow lines) beneath the potential deeper BSR and much thicker gas hydrate stability zone (GHSZ).
BSR features were mapped within the 3D seismic surveys to identify an area of 537 km2 that likely contains gas hydrates (Figs. 3 and 9). Bright, negative amplitude free gas anomalies are observed trapped beneath the BSR boundary and suggest a free gas column of up to 50 m thick (Fig. 9c). However, away from the bright free gas anomalies, mapping of the BSR became difficult due to an intermittent and dim BSR reflection. Therefore, due to the relationship between the BSR and the seabed, a pseudo BSR surface was created to aid the identification of this boundary in other areas of the survey (Fig. 9). This pseudo surface was based on empirical evidence from obvious BSRs in the data (Fig. 9c) and was created by cross-plotting the thickness of the GHSZ in areas containing these BSRs against the seabed depth. The best fit line between these two data was then used to create a surface at the expected BSR depth across the entire 3D survey extent, a surface that tolerates variations in stability zone thickness in response to changes in seabed depth.
This guide surface was used to focus BSR reconnaissance throughout the 3D seismic data. It was also used to identify additional areas of free gas (a much higher risk) that may be trapped at the base of the gas hydrates (Figs. 3 and 9). This involved combining the extensive pseudo surface with the BSR map and producing a minimum amplitude extraction for a 20 ms window across this surface (Fig. 9b). This technique, along with the manual reconnaissance of the seismic character at the pseudo surface depth, resulted in the identification of a previously undiscovered BSR as well as trapped free gas in the north of the Anu survey (Fig. 9a and b).
South of the Pitu survey, a cross-cutting negative amplitude reflection has also been interpreted as potentially representing a BSR; however, this feature exists ∼ 100 ms TWT deeper than the guide surface (Fig. 9a, d and e). This potential BSR is not as obvious as in other areas, but multiple stacked bright anticlinal anomalies exist within the underlying stratigraphy that may represent the upward flow of hydrocarbon fluids that are subsequently trapped beneath the BSR boundary (Fig. 9d and e). Rapid changes in BSR depth over short distances can occur and have been observed in other areas, e.g. the Lower Congo Basin (Andresen et al., 2011). However, as the seabed depth and shallow sediments are relatively consistent with the main BSR area a short distance away (< 5 km) (Fig. 9a), a significant variation in the phase boundary depth is unlikely. Therefore, these deeper anomalies could instead represent more traditionally trapped gas unrelated to hydrates (Fig. 9d and e).
4.5 Risking
Once the main geohazards described above were analysed, the individual results were combined to create a composite hazard map that was used directly for site selection (often known as a common risk segment – CRS – map) (Hill et al., 2015) (Fig. 10). The hazards considered within this process (seabed features, shallow gas and gas hydrates) were rated as either moderate risk, such as low dip glacial seabed features or areas containing gas hydrate (without free gas), or as high risk, such as seabed depressions or shallow gas occurrences. These features were then colour coded using a traffic light system, with red representing high risk, amber representing moderate risk, and green representing low risk. After initial site locations were proposed, significant faults were mapped in more detail around the site and subsequently added to the map to assess whether alterations were required.
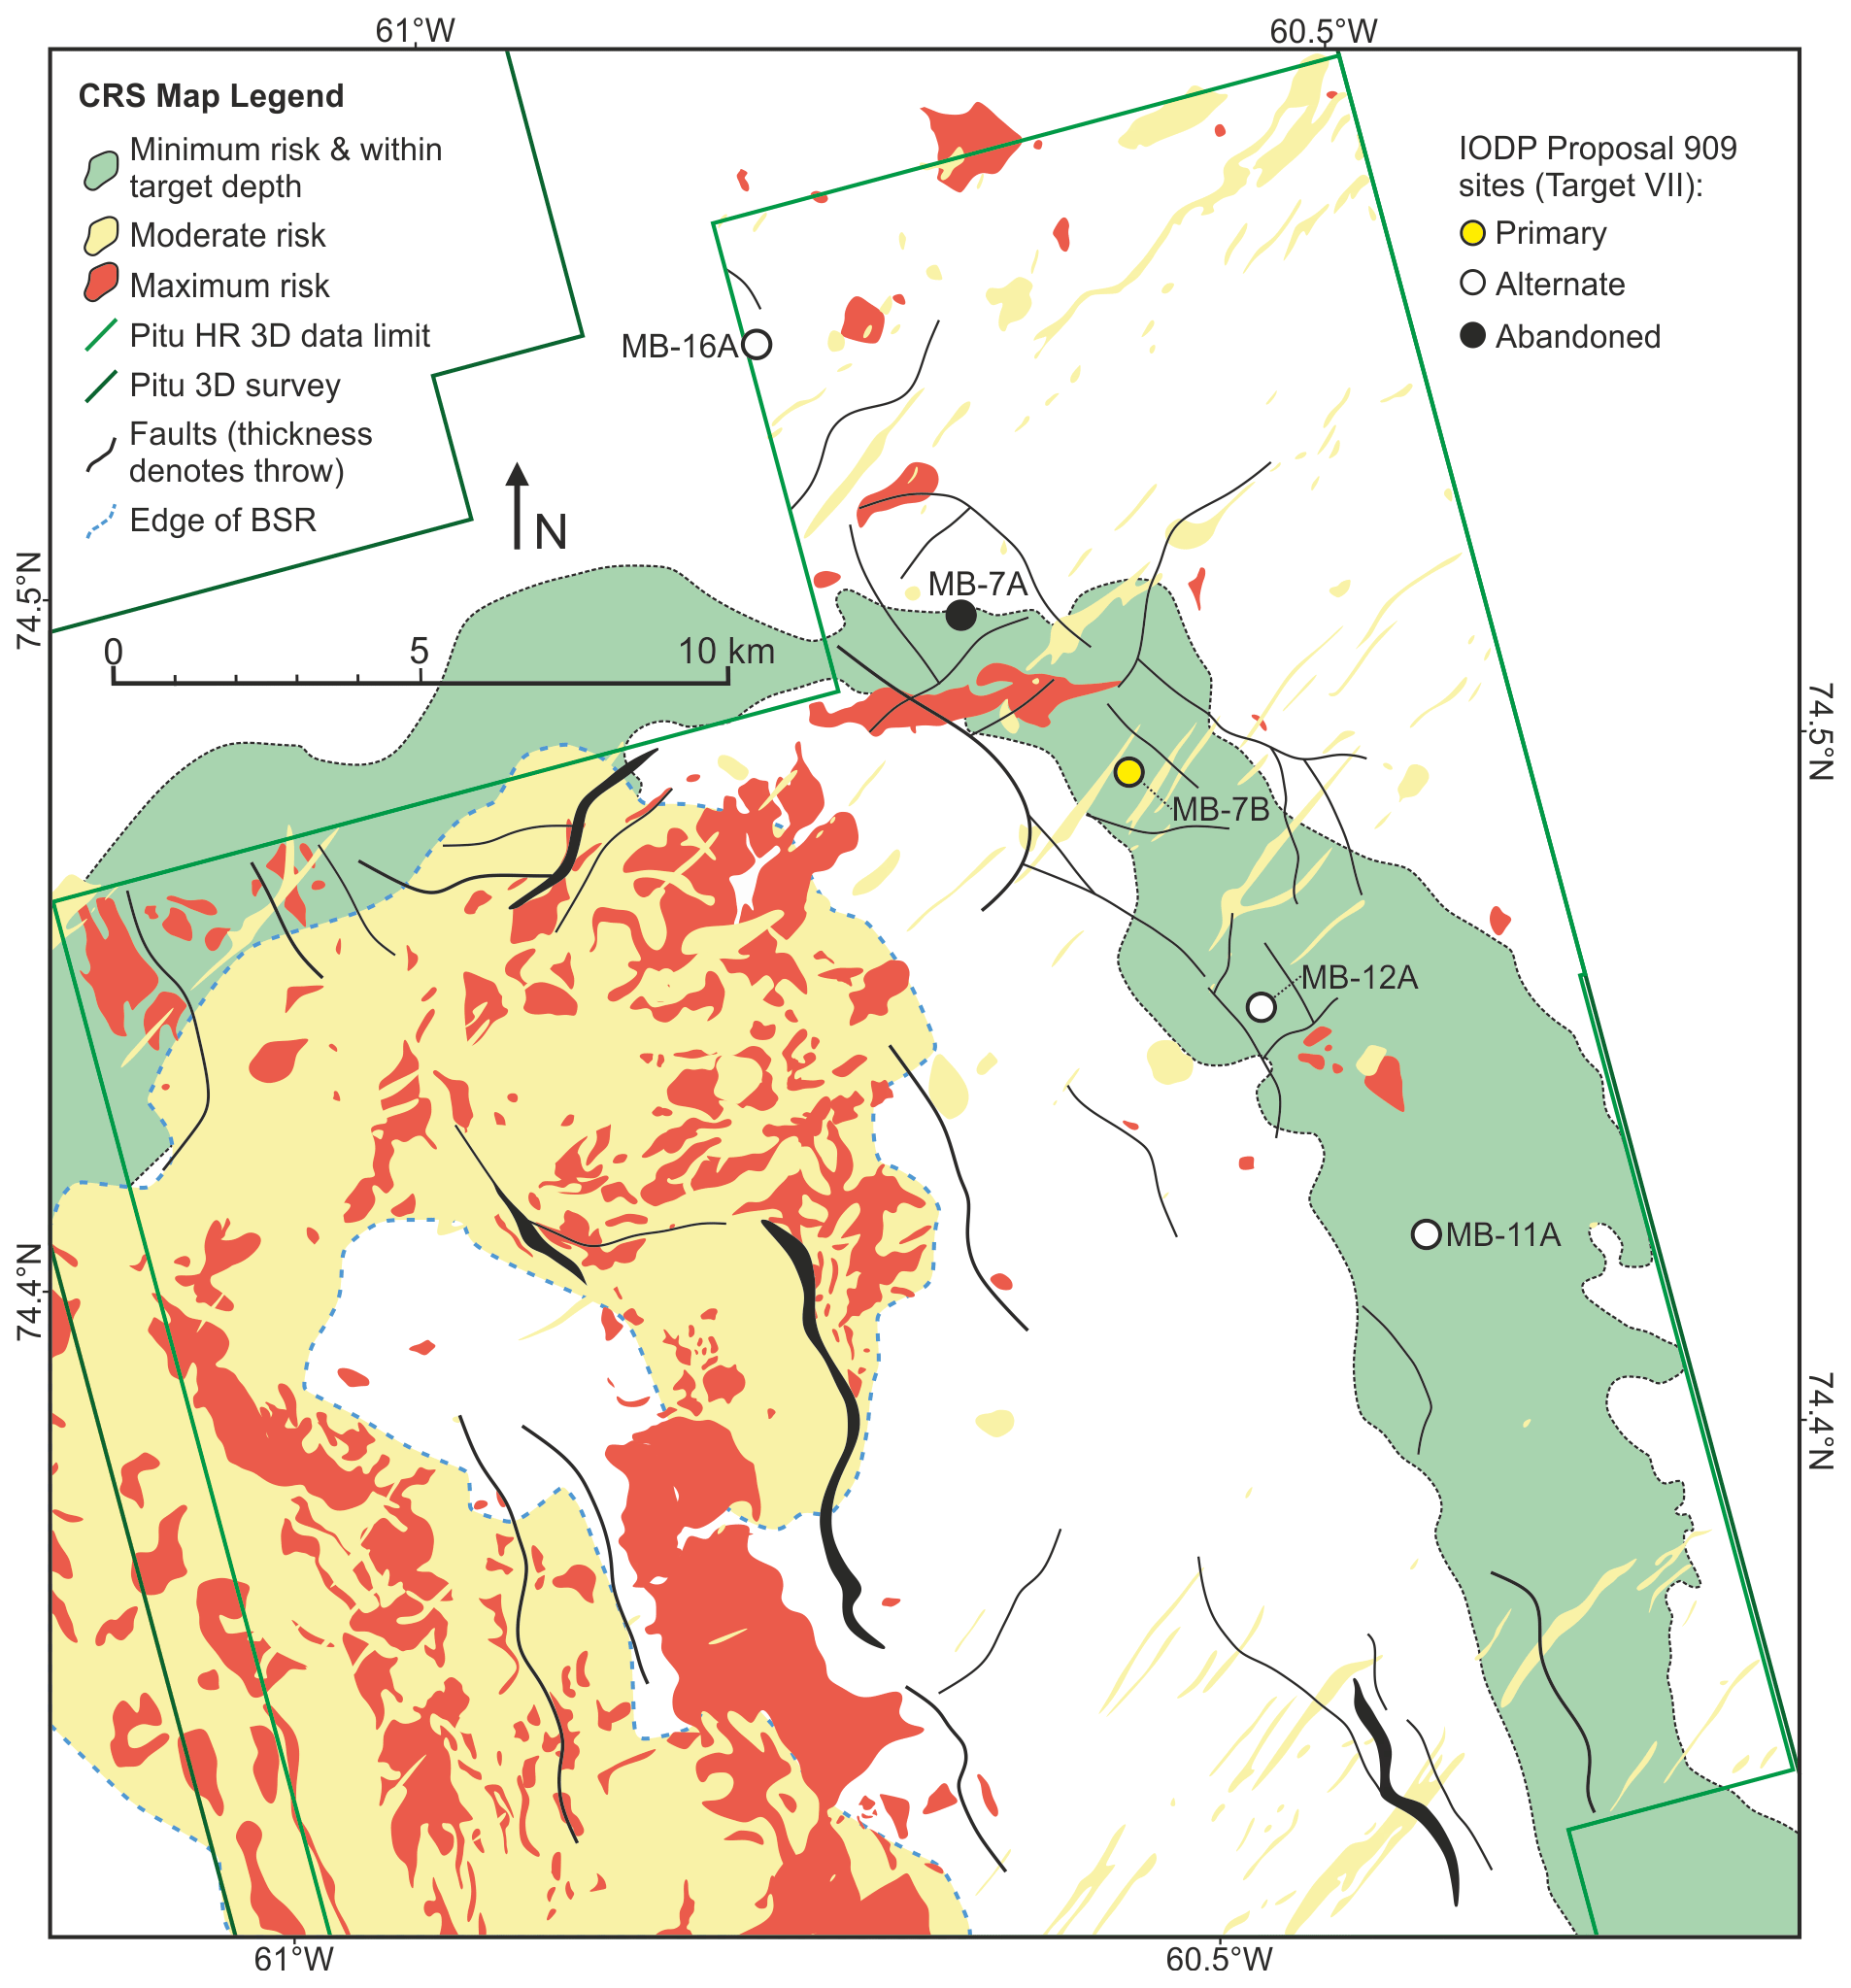
Figure 10A common risk segment (CRS) map showing the green, minimum risk, depth target zone for Target VII where sites can be located safely whilst meeting the stratigraphic objectives. This CRS map was used to guide the site selection and abandonment of the shown Target VII sites. Similar CRS maps were also created to guide site selection and abandonment for the other stratigraphic targets within 3D seismic coverage (Targets III–VI).
All areas surrounding the moderate and high risk features could be considered minimum risk (green), but an attempt was made to maintain a minimum radius from each site location of 500 m to the nearest identified hazard. For each stratigraphic target (I–VII), a target seismic horizon and the maximum tolerable drilling depth to reach that horizon were defined, creating a more localized target zone where the site had to be located. These target zones were overlaid on the CRS maps to create the green, minimum risk zone, which highlighted the area that could be drilled safely and still reach the desired stratigraphic target within the tolerated depth (Fig. 10).
4.6 Site selection: geohazards and lithology
The geohazard assessment and CRS map creation provided a minimum risk target zone to guide safe site selection. However, several other logistical and geological factors had to then be considered whilst fine-tuning the final location of each site.
This included an assessment and interpretation of the seismic character to give an idea of the potential lithology of the sediments (following work by several authors on lithology interpretations from seismic data, e.g. Sangree and Widmier, 1979; Frey-Martínez, 2010; Hilterman, 2001; Badley, 1985; Stewart and Stoker, 1990). An attempt was made to avoid certain seismic features, such as (1) chaotic packages of reflections, often down-slope from erosional scarps, that likely represent mass transport deposits; (2) structureless to chaotic, near-surface packages that may represent boulder-prone glacigenic tills or debris flows; (3) high, positive amplitude reflections at the top of glacigenic progradational units that may represent paleo-seabeds that have been indurated due to ice loading during the following glacial period; and (4) relatively high, negative amplitude reflections that are often wavy (within mu-B or -C) or laterally continuous within mu-D that may represent the top of sand packages. These seismically inferred lithologies were considered risks and avoided due to the likelihood of poor core recovery and the possibility of the coring equipment becoming stuck in the hole.
The stratigraphic dip (on seismic) was also considered in an attempt to try and target flat horizons to maximize the chance of good core recovery. Finally, the site priority (either primary or alternate) had an influence on location, as alternate sites attempting to reach the same stratigraphic target as the primary one were required to be sited a minimum of 5–10 km away from the next nearest site (primary or alternate) if possible to manage the iceberg risk. After considering these additional factors within the low-risk zone provided by the CRS map, a suitable drilling location was selected.
Seven primary and 15 alternate sites have been identified for the 909-Full2 proposal (Figs. 1 and 3) (Knutz et al., 2018). These sites cover the seven stratigraphic targets (Targets I–VII) that have been identified in order to meet the scientific objectives of the drilling proposal (Figs. 1 and 2). The selection of these sites was based on multiple data that have become available as the proposal developed since its inception in 2016. Initially, the regional 2D seismic data represented the principle source of information for identifying drilling targets along the key seismic transect (Fig. 2). Since then, the majority of site selections have been refined based on industry 3D seismic volumes and the LAKO UHR seismic data that were collected in 2019 (Table 2). In the final iteration of the proposal, none of the proposed sites exists in an area only covered by regional 2D seismic reflection data (Table 3). The final review resulted in several site alterations and additions as part of Proposal 909-Full2 to accommodate alternate site requirements for iceberg-prone waters. This version was subsequently accepted by the Scientific Evaluation Panel and by the Environmental Protection and Survey Panel of IODP.
Table 3A site information table for the active and abandoned sites of IODP Proposal 909. Seismo-stratigraphic units are from Gregersen et al. (2013, 2017) and Knutz et al. (2015) and are shown in Fig. 2. The ticks indicate the seismic data coverage at each site, while the red coloured ticks denote which data were used primarily for initial site selection. The result of the geohazard assessment column signifies the impact the assessment had on that site and includes confirm (site approved after being initially selected on a form of 2D seismic data), amended (site was moved to this location from an abandoned site), select (site was chosen as an initial location) and abandon (site was deemed an unfit location). Abbreviations used include stratigraphy (Strat), sub-unit (su), primary (Prim), alternate (Alt), abandoned (Ab), seabed (sb), metres below sea surface (mbss), metres below seafloor (mbsf), ultra-high-resolution (UHR), geohazard assessment (GHA), lithology (lith) and total depth (TD). All site locations are shown in Fig. 1.
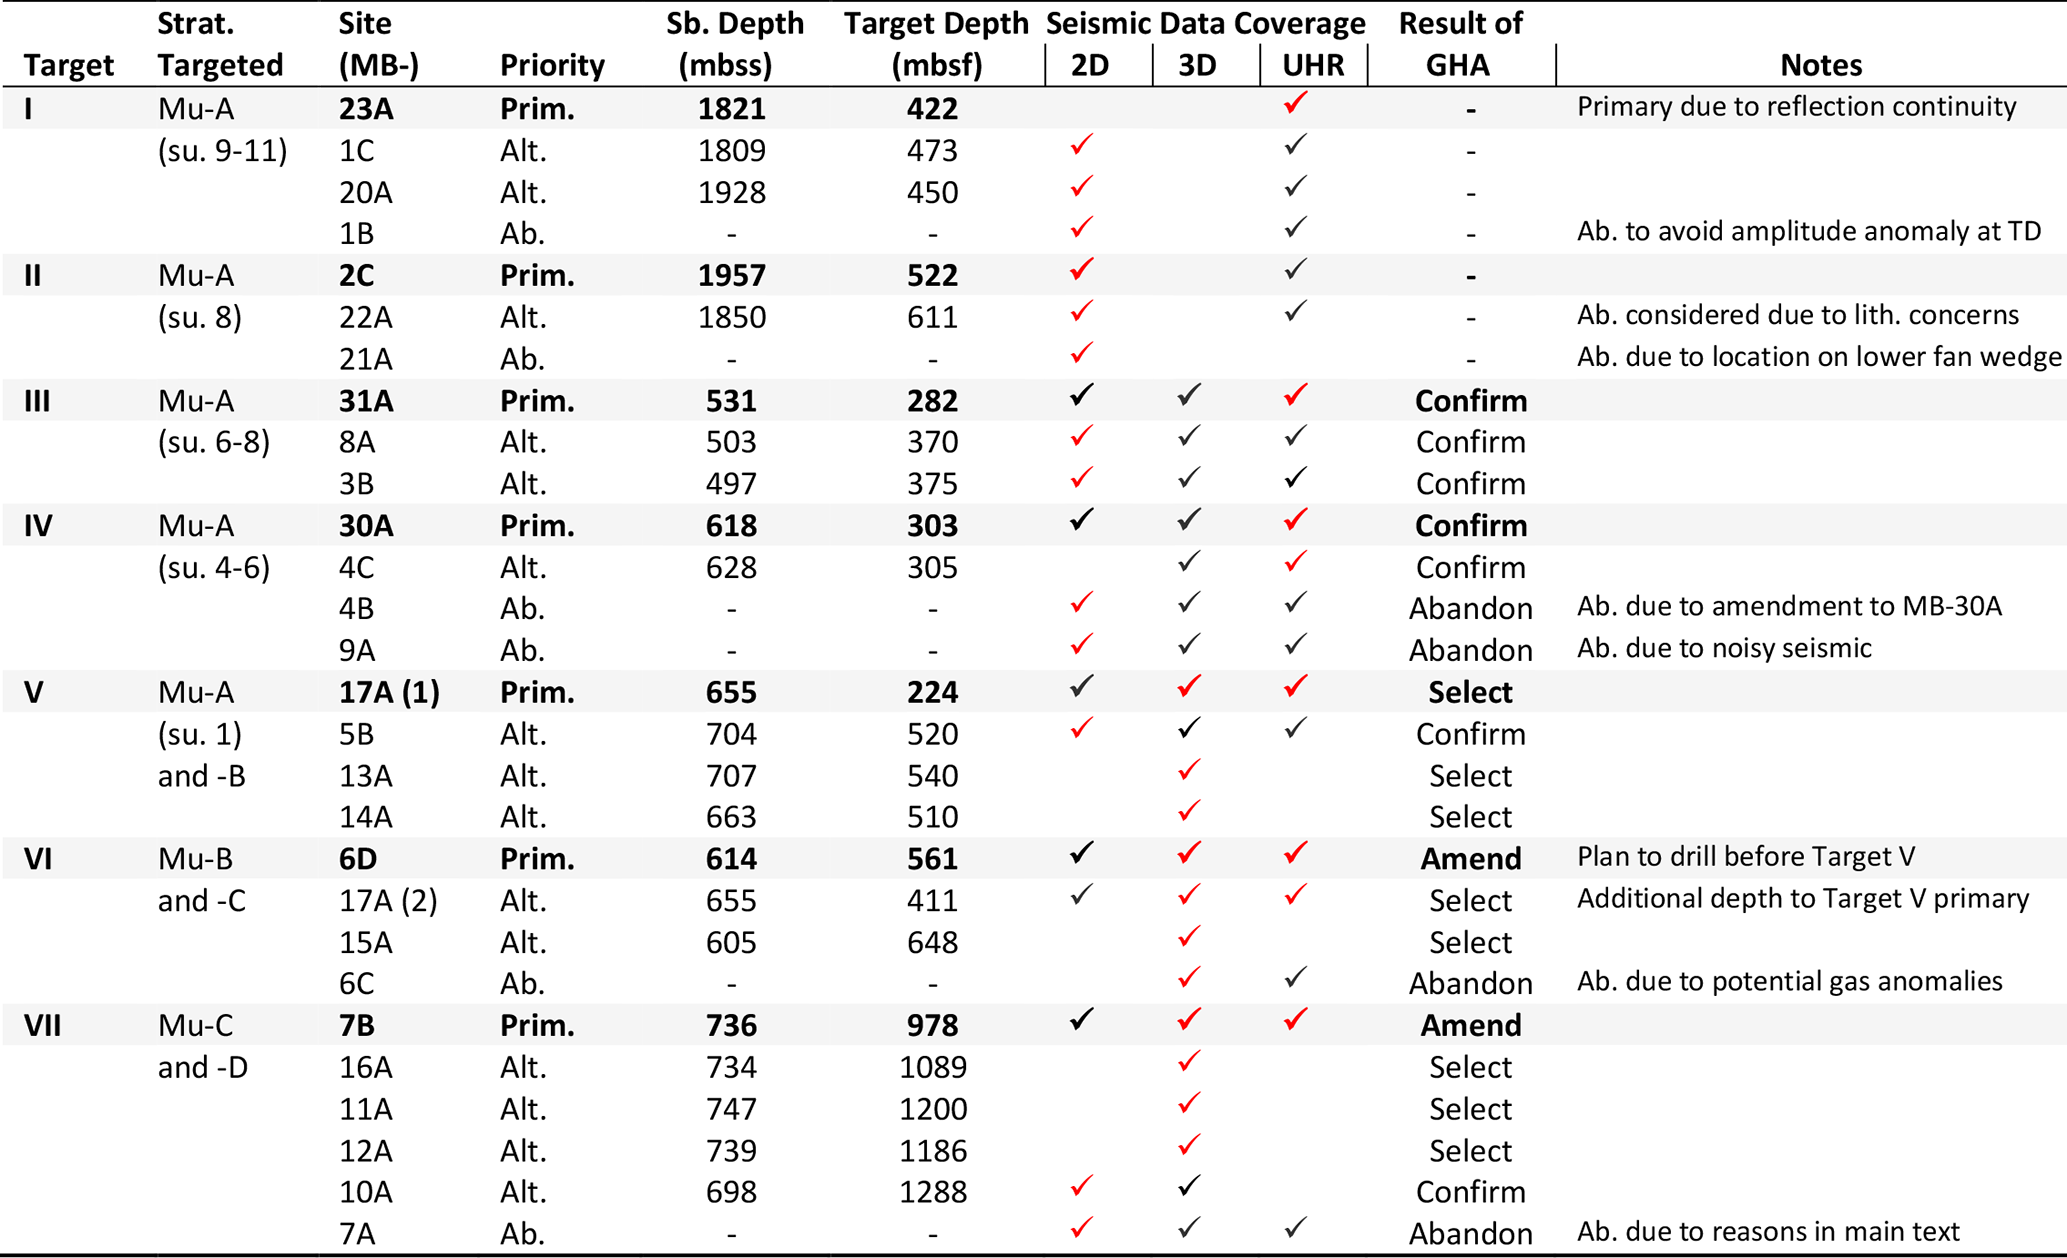
The coverage of the three seismic data types (2D, 3D and UHR) varies across the sites, and their availability restricts which data can be used within the site-selection process (e.g. Target I and II sites which are outside of 3D seismic coverage; Fig. 1 and Table 3). However, for all sites located within the 3D seismic extent, these data and the geohazard assessment were considered the principle data that either guided the selection of new sites or were used to amend and confirm the suitability of locations that were previously selected on 2D data (Table 3). This led to several sites being abandoned (Figs. 1 and 3 and Table 3). In cases where the UHR seismic data were used to select a new site (such as MB-17A or MB-7B), the spatial analysis of drill targets and hazards from the 3D seismic reflection data were still the primary method used for final site approval.
5.1 Targets I and II
The deep water sites for Targets I and II (ca. 1950–1800 m water depth) are located beyond the present-day shelf break and aim to recover a paleoceanographic record of a Pleistocene drift system associated with the MB-TMF (Fig. 1 and Table 3). Target I represents mu-A subunits 9, 10 and 11, with Target II comprising an expanded section of the stratigraphically underlying subunit 8 (Fig. 2). These two sites were initially selected using regional 2D seismic data, with the majority having been subsequently refined by LAKO UHR data, apart from site MB-23A, which was selected directly on the LAKO UHR data. For the remaining sites, an assessment for potential drilling hazards was conducted using the 2D datasets (regional and UHR) which confirmed their suitability, but as these sites exist outside of the 3D seismic coverage, the full geohazard assessment could not be applied during the site-selection process.
5.2 Targets III and IV
Target III sites on the southern flank of the Melville Bay Trough (ca. 500 m water depth) aim to recover potential glacial and interglacial intervals expected to be of Early–Middle Pleistocene age within top-set strata of the MB-TMF that onlap onto glacial unconformities within mu-A subunits 6, 7 and 8 (Figs. 1, 2, and 11 and Table 3). Target IV sites in the southern central part of the Melville Bay Trough (MBT) (ca. 600 m water depth) focus on similar top-set strata covering a stratigraphic interval of likely Early Pleistocene age corresponding to mu-A subunits 3–6.
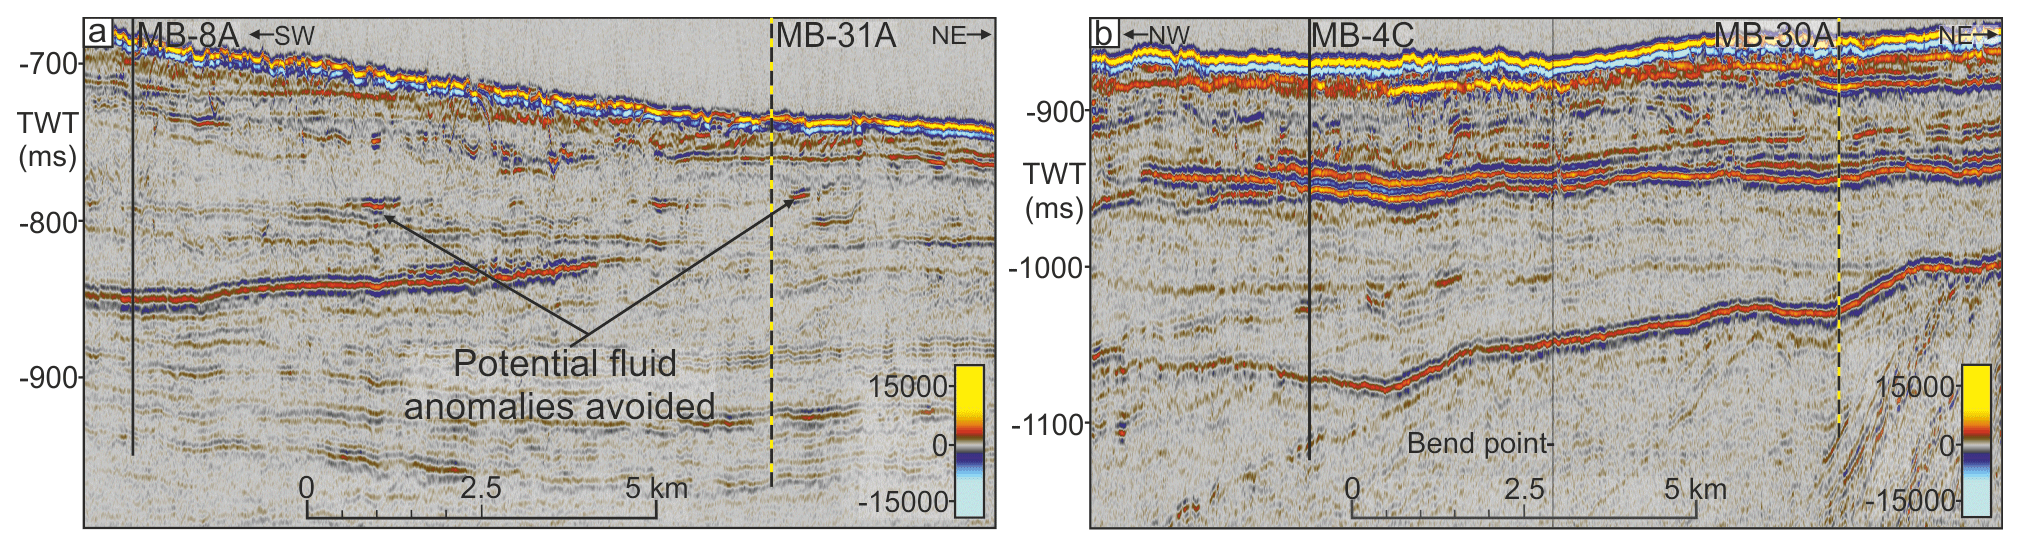
Figure 11Targets III and IV. Seismic cross sections from the LAKO UHR survey that highlight the glacigenic stratigraphy of Targets III (a) and IV (b) as well as the locations of potential fluid anomalies and sites MB-31A (primary), MB-8A, MB-30A (primary) and MB-4C (alternate). The locations of both panels (a) and (b) are shown in Fig. 3, and uninterpreted versions are provided in Fig. S3.
Three of the sites, including both primaries, have been selected predominantly using the LAKO UHR seismic, with the remaining two alternate sites using the regional 2D survey (Table 3). During this selection, potential hazards observed in the 2D surveys, including amplitude anomalies, were identified and avoided. All of the selected sites, however, exist within the 3D seismic coverage (Fig. 3) and therefore have been analysed as part of the geohazard assessment. Each site location and the depth of the target seismic horizon were assessed against each step of the geohazard assessment workflow through the process of CRS map creation. In this case, no site alterations were required, and all sites selected existed within the green, low-risk zone (Fig. 10), avoiding all identified hazards, for example the potential fluid anomalies shown in Fig. 11, by an acceptable radius (usually > 500 m).
5.3 Targets V and VI
Target V and VI sites, located in the central MBT (ca. 600–700 m water depth), aim to recover pre-glacial Neogene contourite drifts of presumed Early Pliocene age (Figs. 2, 3 and 12) and a limited portion of the overlying prograding sediments, which may reflect the earliest marine-based glaciations in north-western Greenland (mu-A subunit 1).
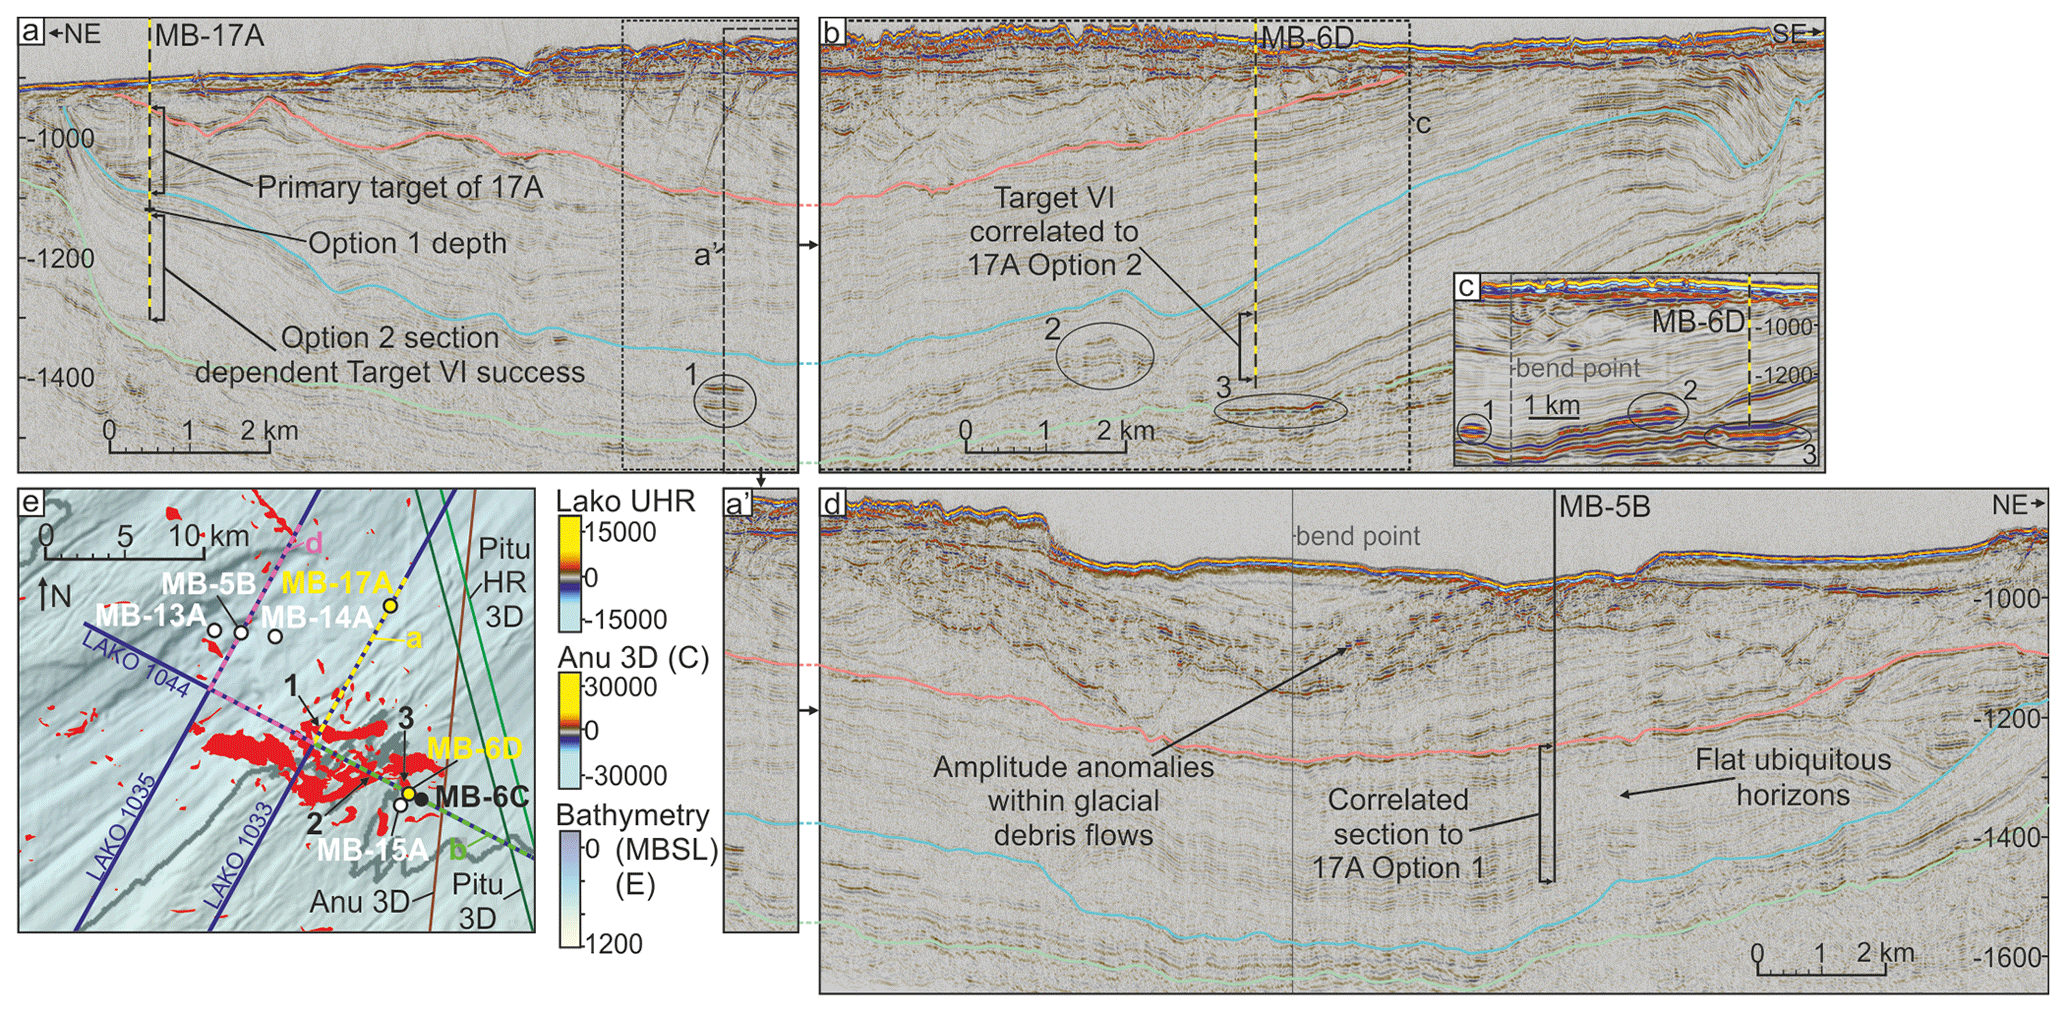
Figure 12Target V. (a) A seismic cross section from the LAKO UHR survey showing the location of primary site MB-17A. Both depth options for this site are shown along with horizon interpretations (coloured) that were mapped throughout the area to allow the correlation of target stratigraphy with the other sites. The section of seismic that represents panel (a') is also shown, with panel (a') displayed beneath, next to panel (d), to show how both the seismic lines in panels (b) and (d) are connected to the seismic line of panel (a). (b) A LAKO UHR seismic cross section displaying the stratigraphic correlation between sites MB-17A and MB-6D. (c) A seismic cross section from the Anu survey shown for comparison between the two surveys. Fluid anomalies are shown and numbered and their appearance can be compared with the associated anomalies displayed in the LAKO UHR survey in both panels (a) and (b). The location of panel (c) is also shown in both panels (a) and (b). (d) A LAKO UHR seismic cross section displaying the stratigraphic correlation between sites MB-17A and MB-5B. (e) A location map for the seismic lines used in panels (a), (b) and (d) that represents an enlarged section of Fig. 3 displaying the regional bathymetry from Newton et al. (2017) as well as the location of seismic data and mapped seismic fluid anomalies (red). The locations of the seismic anomalies that are highlighted and numbered in panel (c) are also shown. The location of panel (e) is shown in Fig. 3. Uninterpreted versions of panels (a), (b) and (d) are provided in Fig. S2.
Analysis of both the new LAKO UHR data and the geohazard assessment from the 3D seismic reflection data led to the selection of a new primary site (MB-17A) that compared favourably to the originally proposed site (MB-5B). Site MB-17A fulfils the Target V criteria whilst avoiding several potential fluid anomalies and minimizes drilling through potentially boulder-prone glacial debris flow sediments (Fig. 12d). The new site also allows operational flexibility, providing an alternate site for Target VI by sampling both Target V and VI sediments (e.g. Option 1 and Option 2) (Fig. 12 and Table 3). The recovery of the youngest drift sediments has been optimized by targeting a sequence of evenly layered strata that are located less than ∼ 60 m below the seabed (Fig. 12a).
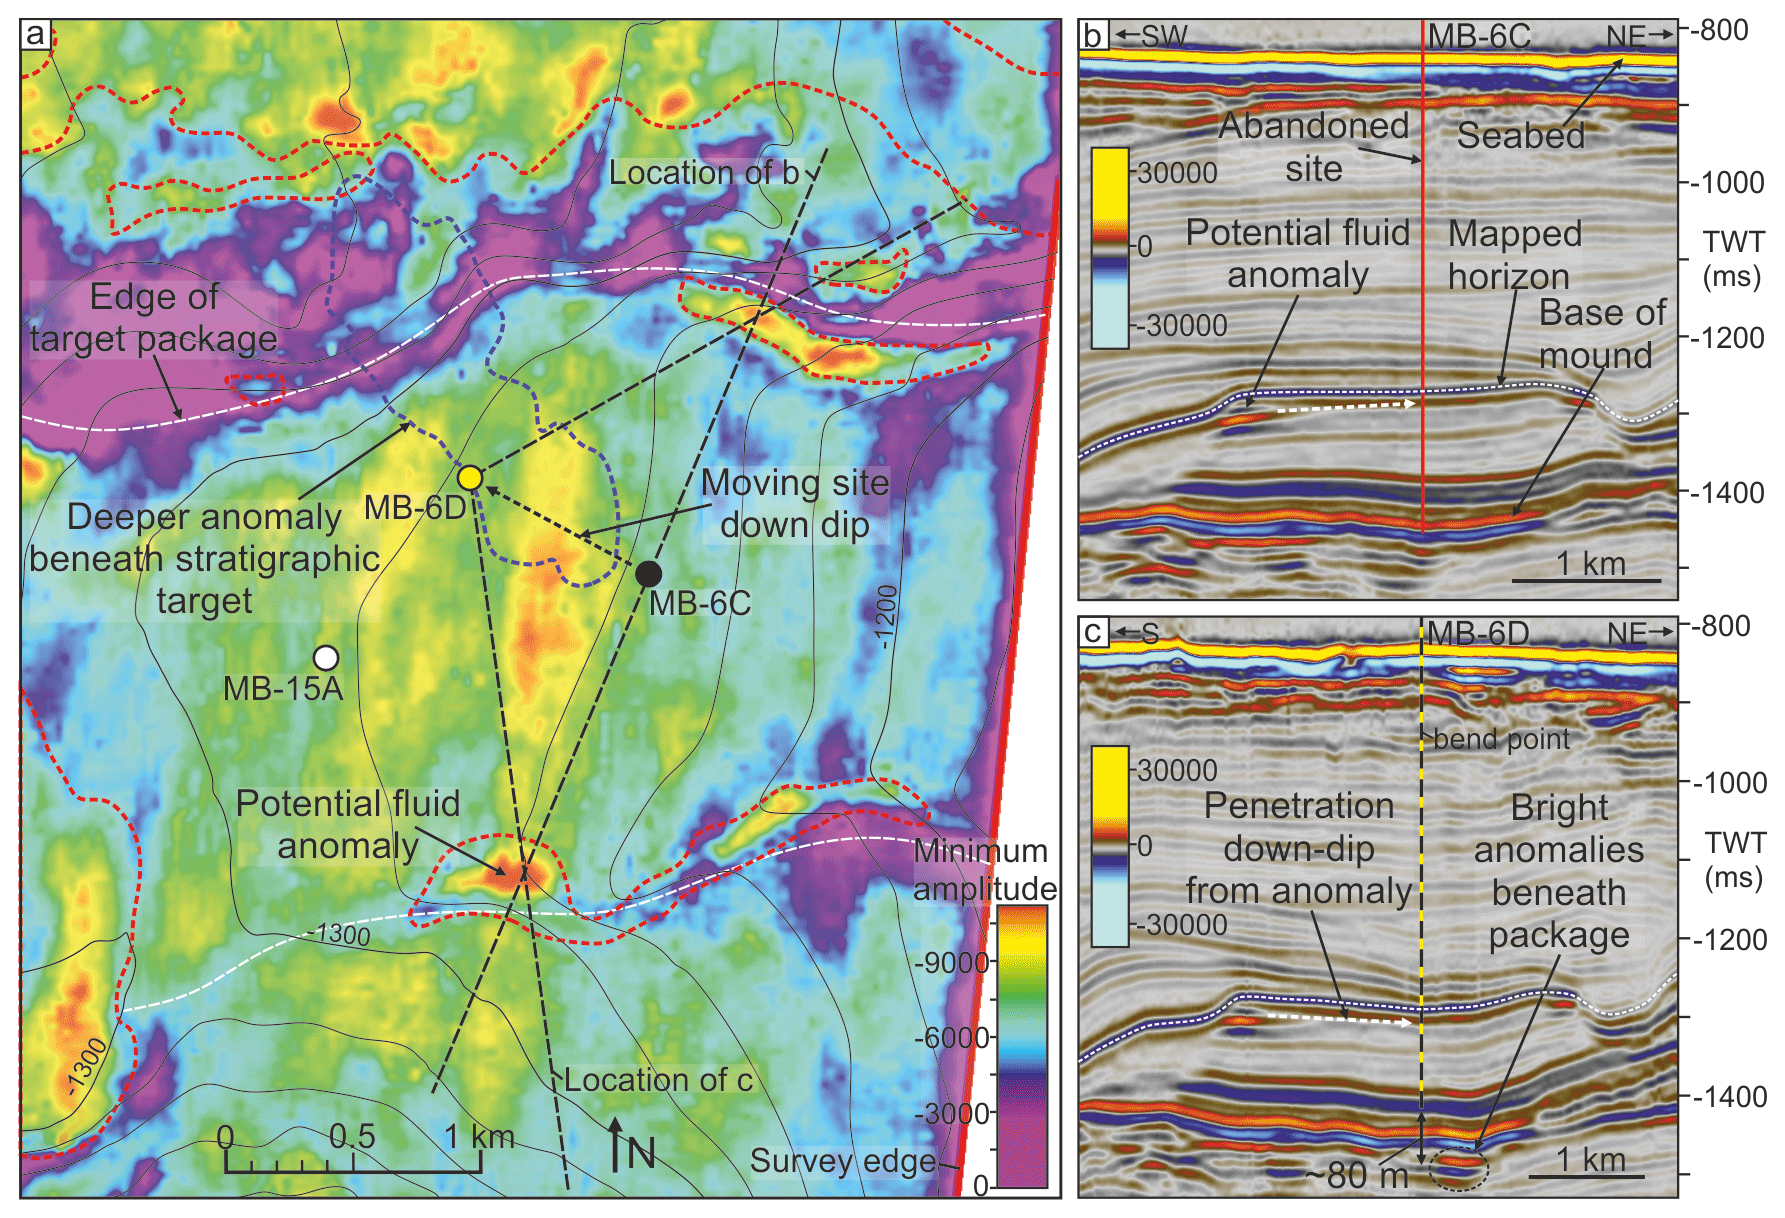
Figure 13Target VI. (a) A minimum amplitude attribute extraction along a mapped horizon representing the top of the contourite mound package that constitutes Target VI (horizon shown in panels b and c). The attribute extraction highlights bright amplitudes that may represent either tuning or fluid anomalies. The spatial relationship between these bright anomalies and fluid anomalies extracted through the shallow gas detection process (red dashed polygons) (displayed in Fig. 3) is highlighted. The Target VI site locations are shown as well as the locations of panels (b) and (c). The location of panel (a) is shown in Fig. 6. (b) A seismic cross section from the Anu survey showing the contourite mound that comprises Target VI. The occurrences of the potential fluid anomalies are also displayed along with the location of abandoned site MB-6C. (c) A seismic cross section from the Anu survey showing the location of the Target VI primary site MB-6D. The site location is shown to penetrate the top mound horizon down dip from the potential fluid anomalies on the packages' flanks.
Target VI sites aim to recover the oldest stratigraphic section of the Neogene contourite drift within mu-B. For Target VI, in combination with Target V, the overall strategy is to obtain a composite, high-resolution record containing the Early Pliocene warm phase to the Late Pliocene cooling (Table 3). The main drilling target is an expanded section of the wavy-mounded contourite drift that accumulated over an underlying erosional unconformity (hz c1) (Figs. 2, 12 and 13). Both the primary and alternate sites were picked directly on the 3D seismic data using the geohazard assessment as a guide. Primary site MB-6D is also covered by LAKO UHR data which were used to confirm the site (Table 3).
Initially, the primary for Target VI was selected using regional 2D data but was located in an area just beyond the limit of the 3D seismic coverage (between the Anu and Pitu surveys – Fig. 3). Therefore, it was decided to relocate the site to within the 3D seismic extent to allow a more detailed site analysis using the geohazard assessment (to MB-6C – Fig. 13). The shallow gas detection analysis (Fig. 8) identified two bright spots at the edges of the mounded contourite target package that may represent tuning effects between the negative amplitude reflection at the target top and a short-extent, possibly cross-cutting, positive amplitude event beneath it, but it could also (in a less likely worst case scenario) represent pockets of gas-charged sand at the target top (Fig. 13b and c). MB-6C, however, targeted the central part of the mound that looked evenly stratified and free of bright events (Fig. 13b), but after further considerations of the amplitude distributions and target dip, the site was moved to a new position (MB-6D), where it would penetrate the potential gas-hosting sandy horizon further down dip. This was a cautious effort to reduce the chance of encountering gases that have migrated up dip (Fig. 13).
The geohazard assessment also highlighted a potential fluid anomaly (bright spot) directly in the area where MB-6D is located (∼ 180 m to the N/NE) but ∼ 50 m beneath the base of the targeted drift package (Figs. 3 and 13). Due to this feature, a conservatively shallow target depth was selected that maintains a depth stand-off of ∼ 80 m, minimizing the chance of drilling too deep and reaching the underlying anomaly (Figs. 12 and 13).
5.4 Target VII
Target VII sites are located in the inner central part of the MBT (ca. 750 m water depth) within the area covered by the Pitu 3D (and Pitu HR) seismic survey and comprise the deepest planned sites within the proposal (Fig. 1 and Table 3). Target VII represents an apparently continuous Miocene succession (including a middle Miocene unconformity – hz d1) that has been exhumed on the inner shelf (Figs. 3 and 14), down to the top of a sedimentary wedge of likely Oligocene age (the target horizon) (Figs. 10 and 14a) (Gregersen et al., 2019, 2013). All of the Target VII sites have been selected using the geohazard assessment (Fig. 10 and Table 3).
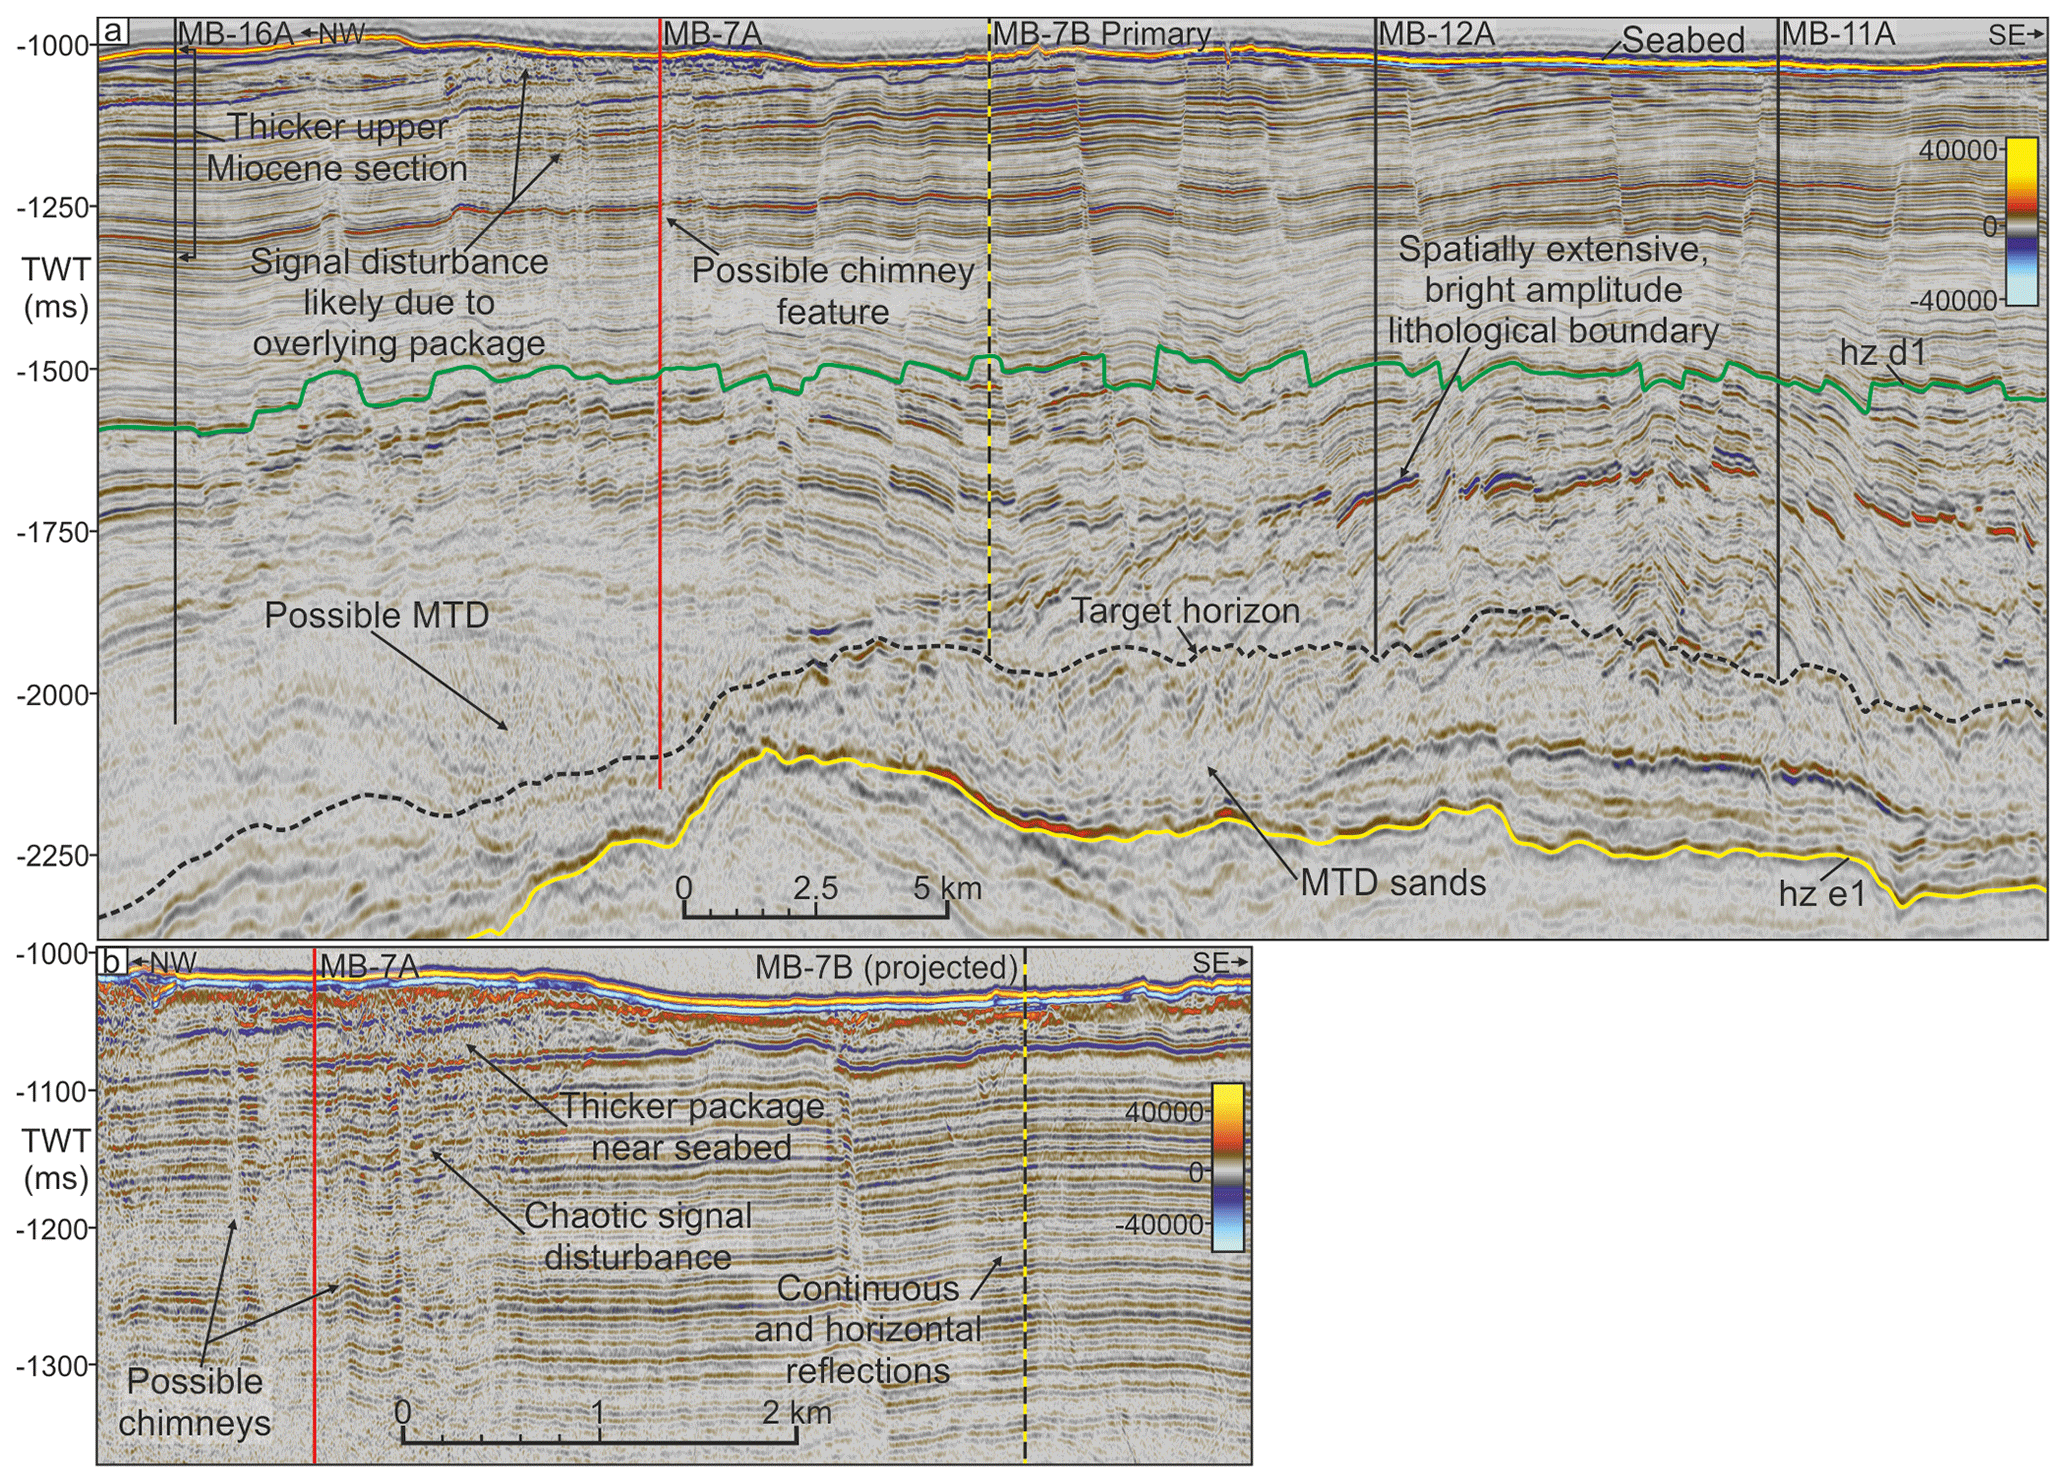
Figure 14Target VII. (a) A seismic cross section from the Pitu HR survey that displays the location of primary site MB-7B, the alternate sites MB-16A, MB-12A and MB-11A and the abandoned site MB-7A. Regional seismic mega-unit interpretations are shown as well as the target seismic horizon used to define the depth target used within the CRS map in Fig. 10 that represents the top of a potentially sandy MTD package. (b) A seismic cross section from the LAKO UHR seismic that shows potentially hazardous seismic features near site MB-7A that are also observed in the Pitu HR survey (shown in panel a) and ultimately led to the abandonment of that site. A projection of primary site MB-7B is also shown penetrating a section containing continuous and horizontal seismic reflections. The locations of panels (a) and (b) are shown in Fig. 3, and uninterpreted versions are provided in Fig. S3.
The previous primary site, MB-7A, had been selected on the key transect of regional 2D seismic (Figs. 2 and 14). However, the geohazard assessment, in combination with the LAKO UHR seismic, identified a number of issues with the original site location that were not identified using the regional 2D seismic.
-
Narrow, vertical sections of acoustic blanking were identified in both the 3D and LAKO UHR seismics that have been interpreted as possibly representing fluid-flow pipes (cf. Cartwright et al., 2007) or gas streaking (Fig. 14). Although site MB-7A did not intersect these features, they were within close proximity (< 500 m).
-
The MB-7A location was within close proximity to a deep-seated fault that potentially could create pressure communication between the shallow subsurface and a deeper, anticlinal anomaly that may represent trapped hydrocarbon fluids (Fig. 7).
-
The seismic signal is locally disturbed around the MB-7A site in both the 3D and LAKO UHR seismics (Figs. 5a and 7). This is likely caused by an overlying chaotic package of sediments directly beneath the seabed, affecting the signal beneath and possibly containing heterogeneities that would affect drilling, but this may also suggest a higher sand content at the target interval.
-
Potential thick mass transport deposit (MTD) sand packages were identified in the lowermost section of the MB-7A site, both beneath the highlighted target horizon and onlapping onto it (Fig. 14). These sediments would likely cause poor core recovery and could contain high fluid pressures due to their structural dip and proximity to the ridge flanks (Figs. 1 and 14). The top of the MTD sand package was used as the target seismic horizon within the geohazard assessment and the site-selection strategy was to avoid drilling into these sands, maintaining realistic maximum drill depths and including as much of the overlying Miocene section as possible (Figs. 10 and 14).
These issues led to site MB-7A being abandoned and relocated to the new primary site MB-7B, which targets an area of flat-lying strata within a 1–1.5 km wide fault block (with no fault intersections) that is bounded by a combination of north-west–south-east trending deep-seated faults and the polygonal fault system (Figs. 7, 10 and 14).
A geohazard assessment is conducted prior to drilling in an attempt to restrict unnecessary delays, reduce costs, avoid poor data collection and, most importantly, reduce the likelihood of dangerous drilling events (Aird, 2010; Nadim and Kvalstad, 2007). The assessment allows the selection of sites that represent the lowest possible risk whilst also achieving the scientific objectives. This requires a detailed spatial analysis of all potential risks and the consideration of additional viable target areas, both regionally and stratigraphically (Selvage et al., 2012). For IODP Proposal 909, the sensitive environment associated with high-latitude continental shelves, as well as the likelihood of hydrocarbon occurrences, made a robust risk analysis increasingly important (Hasle et al., 2009; Nadim and Kvalstad, 2007; Li et al., 2016). The geohazard assessment was conducted in line with commercial site safety analyses (Jensen and Cauquil, 2013) whilst focussing on hazards that commonly create risks to drilling operations within both deep water continental margin settings (hydrocarbon occurrences, gas hydrates, near-surface faults, etc.; Aird, 2010; Jensen and Cauquil, 2013; Minshull et al., 2020; Ruppelt and West, 2004) and glaciated margins (glacial seabed features, problematic lithologies, indurated horizons, etc.; Bennett et al., 2014; Newton et al., 2017).
The assessment identified a pervasive distribution of hydrocarbon-related anomalies across the 3D seismic coverage which exist within all levels of the post-rift stratigraphy (mu-D to -A) (Figs. 3 and 8–10). The majority of these anomalies exist within the shallow subsurface (top 1 km of sediment) and most likely represent pockets of trapped gas or gas hydrates (Hilterman, 2001; Nanda, 2016). It was imperative to identify and avoid the shallow fluid anomalies prior to drilling as unexpected pressure kicks caused by low-density hydrocarbons can often lead to shut-ins and site abandonment and, in a worst case scenario, can cause blow-outs to occur (Holland, 1997; Prince, 1990). Gas hydrates, however, can be drilled through successfully and have even been the focus of several recent coring campaigns (Khabibullin et al., 2011; Ruppel et al., 2008; Ruppel, 2018; Wei et al., 2019). Though the hydrate deposits in this area are underlain by a free gas column that is up to 50 m thick (Fig. 9) (Cox et al., 2020b) and although overpressure beneath the hydrates is unlikely (thought to be at hydrostatic pressure; Dickens and Quinby-Hunt, 1994), the free gas content may create significant buoyancy pressure which could be catastrophic if drilled (Holland, 1997; Minshull et al., 2020). Therefore, all potential hydrocarbon fluid anomalies were classified as “maximum risk” and avoided as a priority (Fig. 10).
A dense network of both tectonic and polygonal faults was also identified within the study area (Figs. 2, 7 and 10). Avoiding fault intersections while drilling is important as deep-seated near-surface tectonic faults can pass high fluid pressures and hydrocarbons along the fault plane and, if not controlled, can lead to a loss of borehole control (Fig. 7) (Frydman et al., 2017; Jensen and Cauquil, 2013). Fault zones also have a much lower fracture gradient than non-faulted zones, which may lead to sediments breaking up during drilling and poor core recovery. Polygonal faults, however, are thought to be sealing under non-extreme pressure conditions (caused by factors such as glacial loading) and exist within many effective petroleum system seals worldwide, thereby negating the risk of fluid flow along the fault plane (Cartwright, 2019). Still, densely polygonally faulted successions close to the seabed can hold significant fluid pressures, although it is likely that the shallow fluid system here would have been depressurized during repeated glacial loading and unloading cycles (Fjeldskaar and Amantov, 2018; Goulty, 2008; Ostanin et al., 2017) that occurred from 2.7 Ma (Knutz et al., 2019). Polygonally faulted clays with high smectite content can be problematic, however, as they can cause drill pipes to become stuck due to the clays swelling when in contact with borehole fluids (Anderson et al., 2010).
Lithology variations were identified during the fine-tuning of site locations in an attempt to avoid problematic lithologies such as glacial debris flow deposits which may contain boulders (potentially damaging coring equipment), hard indurated horizons or mass transport deposits which affect the continuous chronostratigraphic nature of successions due to sediment re-deposition (Bennett et al., 2014; Jensen and Cauquil, 2013). An attempt was also made to avoid sandy horizons that were identified through certain acoustic impedance contrasts (often semi-bright, negative amplitude events denote a top sand horizon) or through a chaotic seismic facies (e.g. Fig. 14). These uncompacted horizons would likely cause poor core recovery, possibly exacerbated by high fluid pressures within the sands which would further promote sediment collapse (shallow water flow) (Ruppelt and West, 2004). Uncompacted coarse sand could even lead to the coring equipment getting stuck, such as was experienced on ODP Leg 174A (Austin et al., 1998).
Once a potential hazard was identified, the primary concern was to eliminate any drilling through or near to the potential hazard, more so than to unravel the detailed nature of the feature observed. However, the detailed results provided by the geohazard assessment coupled with a desire to understand the complex geological and fluid migration history of the area allowed a closer assessment of the identified hazards, with the most notable conclusions being discussed below.

Figure 15A schematic summary of the structure, stratigraphy, geohazards, and fluid flow history that has been analysed and used within the process of site selection for IODP Proposal 909. Key features related to the elements of the geohazard assessment workflow are shown, including the location of hydrocarbon fluids, sandy lithologies, faults, and the potential source rock horizons and possible fluid migration pathways. The surrounding thumbnails show how these features were analysed and considered within the geohazard assessment workflow. Highlighting the distribution of these features across the schematic aims to provide context on how these features fit together and interact within the subsurface. The understanding of this system, along with the distribution of potential geohazards, was crucial in the identification of viable stratigraphic targets and safe drill sites.
Firstly, the varying seismic character of the identified fluid anomalies (Figs. 3 and 8) along with their relationship with stratigraphic and structural elements (Fig. 15) suggests various styles of trapping mechanisms along with a complex fluid migration history (Figs. 2, 8, 9 and 15) (Cox et al., 2020b). The distribution of fluid anomalies shows a concentration above the Melville Bay Ridge, suggesting that this positive relief feature focussed the upward migration of hydrocarbons in this area (Figs. 2, 3 and 15). This conclusion is further evidenced by the discovery of an extensive, likely gas-charged, Eocene-aged reservoir on the crest of the ridge (Figs. 8 and 15) (Cox et al., 2020a). Cretaceous source rocks are expected to exist within the buried syn-rift stratigraphy of the Melville Bay Graben and Kivioq Basin (Bojesen-Koefoed, 2011; Gregersen et al., 2019; Planke et al., 2009), which onlap onto the ridge high, thus providing the potential for hydrocarbon migration along sandy carrier beds or fault planes either up towards the ridge crest (charging the Eocene reservoir) or into the shallower post-rift stratigraphy (Figs. 2 and 15). Furthermore, the stratigraphy directly above the Eocene reservoir displays evidence for gas leakage, which is likely linked to the onset of multiple cycles of glacial loading and unloading of the crust and the mass redistribution of sediment associated with the development of the MB-TMF (Cox et al., 2020a, b; Knutz et al., 2019; Newton et al., 2017). These processes likely caused episodic variations in subsurface conditions and structural tilt that may have promoted pulses of fluid leakage (Figs. 1, 2 and 15) (Fjeldskaar and Amantov, 2018).
These processes also contributed to the concentration of hydrocarbons within the stratigraphy directly overlying the Melville Bay Ridge, causing the majority of this zone to be unsuitable for scientific drilling (Fig. 3). Moreover, expected fluid migration pathways from the deep basins and leakage from the Eocene reservoir are likely connected to the presence of gas hydrates, again within areas directly overlying the Melville Bay Ridge (Figs. 2, 3, 9 and 15). It is likely that the hydrate-forming fluids followed similar migration pathways to that of the identified gas anomalies, with free gas anomalies observed trapped at the base of the GHSZ at the present day, suggesting continued hydrocarbon migration and post-hydrate formation (Figs. 9 and 15) (Cox et al., 2020b). A portion of these fluids is possibly sourced from the leaking Eocene reservoir, but the presence of free gas anomalies within regional sandy horizons suggests that upward migration of these fluids may have occurred away from the ridge before entering these horizons and migrating laterally up dip into areas uplifted above the ridge structure (Figs. 9 and 15). Numerous fluid anomalies also exist in areas away from the ridge (Fig. 3), suggesting a more complex regional migration history which is likely characterized by the trapping and subsequent remigration of fluids in areas above the deeper basins (Cox et al., 2020b; Grecula et al., 2018). In addition, biogenic gas production, possibly from organic horizons within the contourite succession (mu-B and -C), may represent the source of gas observed within glacigenic progradational sands (mu-A) (Figs. 3 and 9b) (Muller et al., 2018; Rebesco et al., 2014). Anomalies away from the ridge, however, are more sporadic, and there are no identified gas hydrates or deeper gas reservoirs within the section investigated (Fig. 15).
Although not part of the principle task of identifying geohazards to minimize risk, the conclusions drawn from the more detailed assessment of the nature of the geohazard features identified provided a greater understanding of fluid distribution and an enhanced prediction of what identified seismic features may represent. This knowledge ultimately informed the assessment of risk and actively affected site-selection decisions and stratigraphic target amendments by avoiding areas characterized as representing focussed pathways for historical fluid migration (Fig. 15).
6.1 Influence on IODP Proposal 909
On the north-western Greenland continental margin, the geohazard assessment workflow was used to identify and document a wide range of potential drilling risks (Figs. 3, 5–10, and 15), which were considered on par with the scientific objectives and expedition logistics (number of drilling days available) when defining the final site localities. This process led to an efficient and informed selection of the primary and alternate sites, and the added detail and understanding provided through the assessment positively influenced the progression of the proposal through several stages of review and was integral to its success when considering its location within such a challenging region.
The influence of the assessment on minimizing risk is highlighted through a re-assessment of several original sites that were selected using regional 2D seismic data against the spatial distribution of geohazards identified through the 3D seismic assessment (Figs. 3, 7, 10, and 13–15 and Table 3). An attempt was already made to avoid potential drilling risks when selecting sites on the 2D data, but the restricted spatial coverage and lower seismic resolution led to a number of features remaining unseen in the 2D assessment, such as close-proximity out-of-plane fluid anomalies and faults (Figs. 3 and 7) or variations in seismic character suggesting sandy lithologies (Figs. 12 and 14). These types of geohazards were identified through the 3D assessment (and augmented by the LAKO UHR survey), leading to the alteration of these original sites to new and likely safer locations (Figs. 12–14 and Table 3). These alterations highlight the benefit of using 3D seismic analysis to identify safer areas outside of the 2D seismic lines whilst achieving the same or more optimal target parameters. Most importantly, the geohazard analysis enabled refined site selection within the Target VII area, which would have likely been abandoned if only covered by 2D seismic due to the deep drilling target, shallow gas distribution and a dense polygonal fault network, coupled with deeper faults and deeper gas sands (Figs. 2, 7, 10, 14 and 15).
The results of the 3D geohazard assessment workflow (along with the location of the regional 2D seismic) also significantly influenced the acquisition plan for the 2D UHR seismic survey. This survey was acquired in 2019 to complement the 3D assessment by providing a higher-resolution image of the top ∼ 500 ms below the seabed (Figs. 3, 11, 12, 14 and Table 2). These additional data both confirmed features observed on 3D seismic data and highlighted additional, more subtle features (such as potential lithology changes) which prompted several site amendments. Importantly, tailoring the acquisition using the 3D assessment results allowed the UHR survey to be focussed over areas that contained either the selected sites (to confirm location), more complex geology or a concentration of geohazards and also for target areas outside of the existing 3D seismic coverage (Targets I and II – Fig. 1). This allowed a more efficient integration of the two data types whilst minimizing acquisition within unnecessary areas, saving valuable expedition time.
6.2 Benefits to future projects
The geohazard assessment workflow provides a blueprint that maintains the high level of safety assessment associated with IODP drilling by incorporating modern 3D seismic data manipulation and interpretation techniques to take full advantage of the available data (e.g. Heggland et al., 1996; Sharp and Samuel, 2004; Sharp and Badalini, 2013) (Fig. 5 and Table 1). This helps improve both safety and the chance of success of future scientific drilling. Improved 3D seismic acquisition and processing workflows have led to significant improvements in 3D resolution and a reduced reliance on dedicated site surveys (Games and Self, 2017; Oukili et al., 2019). Comparison of the 3D seismic volumes as pseudo site surveys within Proposal 909, against the recently acquired 2D UHR site survey lines, shows that the quality and resolution of imaging are mostly consistent across the two data types, confirming its suitability (comparison in Figs. 12 and 14 and Table 2). The main differences observed included subtle seismic variations, possibly due to lithology differences noted on the UHR seismic, as well as some additional brightening observed in the Anu 3D survey, possibly caused by tuning effects from thin beds that are thicker than the resolution threshold on the UHR seismic and therefore do not display as brightly (seismic survey vertical resolution shown in Table 2 and Fig. 12b and c; Francis, 2015; Marzec and Pietsch, 2012). The 3D seismic volumes also meet the minimum acceptability criteria set out by the International Association of Oil & Gas Producers (IOGP) for using exploration 3D seismic data for site survey studies (Jensen and Cauquil, 2013).
Still, many projects never gain access to 3D seismic data, but the techniques defined within the workflow are still applicable in the 2D sense, especially when using high-resolution and closely spaced 2D site survey data instead. Therefore, the seismic interpretation techniques presented could help maximize the use of available data whilst increasing interpretation quality and efficiency for a wide range of future projects (Selvage et al., 2012; Smith et al., 2019). These methods include using amplitude extraction windows to quickly identify potential fluid anomalies (Fig. 8), using pseudo BSR surfaces created using the BSR–seabed relationship to expand and guide BSR interpretations (Fig. 9) or using stratigraphic depth target zones within CRS maps to collate all identified hazards while focussing site selection within an appropriate, low-risk area (Figs. 10 and 14).
The workflow also outlines how the increasing availability of seismic data through a project's progression can be combined to further assess potential geohazards and provide increased confidence in the chosen sites (Fig. 5). Importantly, the workflow addresses the key hazards that are likely considered within all site-selection safety assessments (Figs. 5 and 15), though the list is not fully exhaustive and several other geohazards or geophysical techniques could be included dependent on context and whether additional data are available. Additional datasets could include acoustic or elastic impedance volumes and derivative rock property estimations (e.g. Dutta, 2002; Huuse and Feary, 2005), “fluid” volumes, electromagnetic-derived resistivity volumes (e.g. Weitemeyer et al., 2006), angle stacks for use in amplitude versus offset/angle (AVO/AVA) studies (Castagna and Swan, 1997), etc.
Examples of additional or modified techniques include using stratigraphical (instead of proportional) attribute extraction windows to follow reflection dip and remove interference from bright amplitude regional reflections and also predicting the BSR depth from the water depth in areas conducive to gas hydrate formation but where no obvious BSR is observed (Field and Kvenvolden, 1985; Kvenvolden et al., 1993; Gehrmann et al., 2009). Alterations to selected cut-offs (such as seabed dip and amplitude filters; Figs. 6 and 8) and other parameters used to define the site location (such as the minimum radius to the nearest hazard) within the geohazard assessment workflow can also be made. If required, this may even include expanding the area where a specific site can be drilled, as seen used in regions even more prone to sea ice and icebergs, such as for IODP Exp. 379 (Amundsen Sea) (Gohl et al., 2019), where the safety radius (in this case along the 2D seismic line) defined around each site locality as being free of hazards was used as a zone of which last minute borehole adjustments could be made in response to the predicted ice trajectory.
The Gohl et al. (2019) study provides an example in which the subsurface- or geohazard-related requirements of a particular location would have influenced the techniques and processes considered within the workflow presented here. Other location-specific requirements include areas containing deep and active fault zones (e.g. the Nankai Trough, Japan) or hydrocarbon fluid venting and extensive gas hydrate deposits (e.g. the Cascadia Margin, offshore Oregon, USA). Drilling safely within such locations with specific geohazard requirements may only be possible when 3D seismic data are available for the assessment of geohazards and drill site selection. This is why IODP legs targeting such areas (Legs 322 and 311; Table 1) have been supported by dedicated, research council funded, 3D seismic acquisition and processing (Bangs et al., 2009; Scherwath et al., 2006). This again demonstrates the importance of 3D seismic data analysis for the future of scientific drilling.
IODP Proposal 909 aims to drill a transect of seven sites across the north-western Greenland continental margin that represents an area that is both a frontier petroleum province and a glaciated margin. A geohazard assessment was conducted that was optimized by the use of high-resolution 3D seismic data to accurately extract, document, and spatially analyse potential geohazard evidence and select drill sites that represent the lowest risk possible whilst meeting the scientific objectives in terms of realistic drill depths, section age, completeness, and thickness. The workflow undertaken for this assessment used 3D seismic analytical techniques to identify geohazards such as seabed features, fluid anomalies, faults, and certain lithologies. The mapped geohazards were combined to create common risk segment maps for each of the primary site groups, using a restricted (green) zone defined by the depth to the stratigraphic target to focus site selection. This process led to the alteration or abandonment of several sites that were originally sited on regional 2D seismic data to more optimal locations within the 3D seismic coverage. The workflow and results were also used to tailor the acquisition of an ultra-high-resolution site survey which optimized acquisition and overall expedition planning. This survey was then used in combination with 3D seismic to verify site locations and identify more subtle shallow features such as potential lithology changes. Ultimately, the full geohazard assessment workflow was used to support 7 primary and 15 alternate sites for the scientific drilling proposal.
The detailed, accurate and comprehensive results provided by the 3D geohazard assessment, as well as its influence on the success of IODP Proposal 909, highlight the importance and benefit of maximizing the use of all available data during the planning of a drilling campaign within a challenging environment. With both past and future IODP campaigns targeting areas such as frontier petroleum provinces or glaciated margins whilst having access to 3D seismic data, the detailed consideration of geohazards outlined by this workflow provides a template for future projects. Incorporation of 3D seismic data analysis into site selection and hazard evaluation will help allow a more comprehensive safety assessment that could enable scientific drilling in areas otherwise considered too risky whilst maintaining the high safety standards required by the IODP.
All seismic data that support the findings of this study are publicly available by request from the Greenland Ministry of Foreign Affairs and Energy or GEUS data department (http://greenpetrodata.gl, last access: 27 October 2020). The authors received the data used in this paper in 2016, before being made public, from the companies who acquired them: TGS (survey BB2007-2010 – BBRE11), Shell (survey SHELL-ANU-3D-2013), Cairn Energy (survey CAPRI-PITU-3D-2011), and GEUS (survey LAKO-UHR-2019). There is thus currently no direct link to these data.
Uninterpreted versions of the 2D seismic cross sections used in Figs. 11, 12 and 14 are provided in the Supplement.
The supplement related to this article is available online at: https://doi.org/10.5194/sd-28-1-2020-supplement.
DRC conducted the 3D seismic geohazard assessment and was lead author of the manuscript and figures. PCK and DCC are lead proponent and data lead on IODP Proposal 909 respectively and assisted this work by leading the selection of stratigraphic targets (Targets I–VII), conducting depth conversions and, in collaboration with DRC, selecting drill site locations. JRH was the lead on LAKO UHR data acquisition and processing. AMWN assisted DRC with the geohazard assessment and figure creation. All the authors were part of the Proposal 909 seismic team and assisted with initial stratigraphic target and site selections, along with conducting co-author reviews on the manuscript and figures.
The authors declare that they have no conflict of interest.
The authors would like to thank the IODP and the members of the Science Evaluation Panel as well as all of the proponents who contributed to Proposal 909. We would also like to thank Cairn Energy PLC (Pitu survey), Shell (Anu survey), TGS (2D Regional Survey), and both the Geological Survey of Denmark and Greenland and Aarhus University (LAKO UHR) for the provision of seismic data and the permission to publish the images and results. Acquisition of the LAKO UHR data was possible through grants to Paul C. Knutz and John R. Hopper from the Danish Center for Marine Research and the Carlsberg Foundation and we would like to thank the scientific party involved with the acquisition during the LAKO 2019 expedition. The results and opinions expressed within this work are solely of the authors and not a representation of the companies or institutions. Finally we would like to thank both Schlumberger (Petrel) and Esri (ArcGIS) for providing the software packages used to complete the analysis within this work.
David R. Cox also thanks his PhD sponsors, the University of Manchester (50 %) and the British Geological Survey (BGS) via the British University Funding Initiative (BUFI) (50 %). His PhD forms part of the Natural Environment Research Council (NERC) Centre for Doctoral Training (CDT) in Oil & Gas. Andrew M. W. Newton thanks the Natural Environment Research Council and Cairn Energy for doctoral and postdoctoral funding.
This research has been supported by the BGS British University Funding Initiative (grant no. S356), the NERC Centre for Doctoral Training in Oil and Gas (grant no. NE/M00578X/1), and NERC (grant nos. NE/K500859/1 and NE/R013675/1).
This paper was edited by Will Sager and reviewed by Martin Hovland and Katrine Juul Andresen.
Acton, G.: Proceedings of the Baffin Bay Scientific Coring Program – Expedition 344S, Reporting by company consortium with eight companies led by Shell, The Hague, the Netherlands, 1–842, 2012.
Aird, P.: Assessing geo-hazards, BP Norge AS, Stavanger, Norway, 1–36, 2010.
Altenbernd, T., Jokat, W., Heyde, I., and Damm, V.: Geophysical evidence for the extent of crustal types and the type of margin along a profile in the northeastern Baffin Bay, J. Geophys. Res.-Sol. Ea., 120, 7337–7360, https://doi.org/10.1002/2015JB012307, 2015.
Anderson, R., Ratcliffe, I., Greenwell, H., Williams, P., Cliffe, S., and Coveney, P.: Clay swelling – a challenge in the oilfield, Earth-Sci. Rev., 98, 201–216, https://doi.org/10.1016/j.earscirev.2009.11.003, 2010.
Andresen, K. J., Huuse, M., Schødt, N. H., Clausen, L. F., and Seidler, L.: Hydrocarbon plumbing systems of salt minibasins offshore Angola revealed by three-dimensional seismic analysis, AAPG bulletin, 95, 1039–1065, https://doi.org/10.1306/12131010046, 2011.
Austin Jr., J. A., Christie-Blick, N., and Malone, M. J.: Leg 174A Preliminary Report - Continuing the New Jersey Mid-Atlantic sea-level transect, Ocean Drilling Program, College Station, Texas, USA, 97 pp., 1998.
Badley, M. E.: Practical seismic interpretation, Prentice Hall, Englewood Cliffs, N.J., USA, 1107 pp., 1985.
Bangs, N., Moore, G., Gulick, S., Pangborn, E., Tobin, H., Kuramoto, S., and Taira, A.: Broad, weak regions of the Nankai Megathrust and implications for shallow coseismic slip, Earth Planet. Sc. Lett., 284, 44–49, https://doi.org/10.1016/j.epsl.2009.04.026, 2009.
Bennett, R., Campbell, D. C., Furze, M. F., and Haggart, J. W.: The shallow stratigraphy and geohazards of the Northeast Baffin Shelf and Lancaster Sound, B. Can. Petrol. Geol., 62, 217–231, https://doi.org/10.2113/gscpgbull.62.4.217, 2014.
Berndt, C., Bunz, S., Clayton, T., Mienert, J., and Saunders, M.: Seismic character of bottom simulating reflectors: examples from the mid-Norwegian margin, Mar. Petrol. Geol., 21, 723–733, https://doi.org/10.1016/j.marpetgeo.2004.02.003, 2004.
Bickle, M., Arculus, R., Barrett, P., DeConto, R., Camoin, G., Edwards, K., Fisher, F., Inagaki, F., Kodaira, S., and Ohkouchi, N.: Illuminating Earth's Past, Present and Future The Science Plan for the International Ocean Discovery Program 2013–2023, International Ocean Discovery Program, Washington, USA, 1–92, 2011.
Bojesen-Koefoed, J. A.: West Greenland Petroleum Systems – an Overview of Source Rocks and Oil Seepages and Their Implications for Offshore Petroleum Exploration, The Geological Survey of Denmark and Greenland, Copenhagen, Denmark, vol. 42, 49 pp., 2011.
Bojesen-Koefoed, J. A., Nytoft, H. P., and Christiansen, F. G.: Age of oils in West Greenland: Was there a Mesozoic seaway between Greenland and Canada, Geol. Surv. Den. Greenl., 4, 49–52, https://doi.org/10.34194/geusb.v4.4783, 2004.
Brown, C. S., Newton, A. M., Huuse, M., and Buckley, F.: Iceberg scours, pits, and pockmarks in the North Falkland Basin, Mar. Geol., 386, 140–152, https://doi.org/10.1016/j.margeo.2017.03.001, 2017.
Cartwright, J.: Polygonal Faults and Seal Integrity, Sixth EAGE Shale Workshop, 28 April 2019, Bordeaux, France, 2019, 1–4, 2019.
Cartwright, J. A., Huuse, M., and Aplin, A.: Seal Bypass Systems, AAPG Bulletin, 91, 1141–1166, https://doi.org/10.1306/04090705181, 2007.
Castagna, J. P. and Swan, H. W.: Principles of AVO crossplotting, The Leading Edge, 16, 337–344, 1997.
Christ, A. J., Bierman, P. R., Knutz, P. C., Corbett, L. B., Fosdick, J. C., Thomas, E. K., Cowling, O. C., Hidy, A. J., and Caffee, M. W.: The northwestern Greenland Ice Sheet during the Early Pleistocene was similar to today, Geophys. Res. Lett., 47, 1–9, https://doi.org/10.1029/2019GL085176, 2020.
Cox, D. R., Huuse, M., Newton, A. M. W., Gannon, P., and Clayburn, J.: Slip Sliding Away: Enigma of Large Sandy Blocks within a Gas Bearing Mass Transport Deposit, Offshore NW Greenland, AAPG Bulletin, 104, 1011–1043, https://doi.org/10.1306/10031919011, 2020a.
Cox, D. R., Huuse, M., Newton, A. M. W., Sarkar, A. D., and Knutz, P. C.: Shallow gas and gas hydrate occurrences on the northwest Greenland shelf margin, Mar. Geol., accepted, 2020b.
Cox, D. R., Newton, A. M. W., and Huuse, M.: An introduction to seismic reflection data: acquisition, processing and interpretation, in: Regional Geology and Tectonics – Principles of Geologic Analysis, edited by: Scarselli, N., Adam, J., and Chiarella, D., Elsevier, Amsterdam, the Netherlands, 571–603, 2020c.
Dan, G., Cauquil, E., and Bouroullec, J.-L.: 3D seismic and AUV data integration for deepwater geohazard assessment: Application to offshore northwest Borneo, Brunei, Offshore Technology Conference-Asia, 25–28 March 2014, Kuala Lumpur, Malaysia, 1–9, 2014.
Dickens, G. R. and Quinby-Hunt, M. S.: Methane hydrate stability in seawater, Geophys. Res. Lett., 21, 2115–2118, https://doi.org/10.1029/94GL01858, 1994.
Dutta, N. C.: Deepwater geohazard prediction using prestack inversion of large offset P-wave data and rock model, The Leading Edge, 21, 193–198, https://doi.org/10.1190/1.1452612, 2002.
Dutta, N. C., Utech, R. W., and Shelander, D.: Role of 3D seismic for quantitative shallow hazard assessment in deepwater sediments, The Leading Edge, 29, 930–942, https://doi.org/10.1190/1.3480006, 2010.
Eriksen, F. N., Assad, M., Eriksen, O. K., Stokke, H. H., and Planke, S.: HiRes P-Cable 3D data for shallow reservoir mapping and geohazard predictions – case examples from the Barents Sea, Near Surface Geoscience 2014 – 20th European Meeting of Environmental and Engineering Geophysics, 14–18 September 2014, Athens, Greece, 2014, 1–5, 2014.
Ewing, J. I. and Hollister, C. H.: Regional aspects of deep sea drilling in the western North Atlantic, Deep sea drilling project intial reports, 11, 951–973, https://doi.org/10.2973/dsdp.proc.11.132.1972, 1972.
Field, M. E. and Kvenvolden, K. A.: Gas hydrates on the northern California continental margin, Geology, 13, 517–520, https://doi.org/10.1130/0091-7613(1985)13<517:GHOTNC>2.0.CO;2, 1985.
Fjeldskaar, W. and Amantov, A.: Effects of glaciations on sedimentary basins, J. Geodyn., 118, 66–81, 2018.
Francis, A.: A simple guide to seismic amplitudes and detuning, GEO ExPro, 12, 68–72, 2015.
Frey-Martínez, J.: 3D seismic interpretation of mass transport deposits: Implications for basin analysis and geohazard evaluation, in: Submarine mass movements and their consequences, edited by: Mosher, D. C., Moscardelli, L., Shipp, R. C., Chaytor, J. D., Baxter, C. D. P., Lee, H. J., and Urgeles, R., Springer, Dordrecht, the Netherlands, 553–568, 2010.
Frydman, M., Holzberg, B., Pastor, J., Salies, J., and Pedroso, C.: Reducing Fault Reactivation Risk on Deepwater Drilling, SPE Latin America and Caribbean Petroleum Engineering Conference, 17–19 May 2017, Buenos Aires, Argentina, 1–15, 2017.
Galavazi, M., Moore, R., Lee, M., Brunsden, D., and Austin, B.: Quantifying the impact of deepwater geohazards, Offshore Technology Conference, 1–4 May 2006, Houston, Texas, USA, 1–5, 2006.
Games, K. P. and Self, E.: HRS 3D data – a fundamental change in site survey geohazard interpretation, First Break, 35, 39–47, https://doi.org/10.3997/1365-2397.2017008, 2017.
Gehrmann, R., Müller, C., Schikowsky, P., Henke, T., Schnabel, M., and Bönnemann, C.: Model-based identification of the base of the Gas hydrate stability zone in multichannel reflection seismic data, Offshore Costa Rica, Int. J. Geophys., 2009, 1–9, https://doi.org/10.1155/2009/812713, 2009.
Gohl, K., Wellner, J. S., and Klaus, A.: Expedition 379 Preliminary Report: Amundsen Sea West Antarctic Ice Sheet History, International Ocean Discovery Program, https://doi.org/10.14379/iodp.pr.379.2019, 2019.
Goulty, N.: Geomechanics of polygonal fault systems: a review, Petrol. Geosci., 14, 389–397, https://doi.org/10.1144/1354-079308-781, 2008.
Grecula, M., Wadsworth, S., Maloney, D., Lauferts, H., Cooke, G., Jones, A., and Stevanovic, S.: Baffin Bay Elusive Plays: Geological Surprises of an Arctic Exploration Campaign, American Association of Petroleum Geology International Conference and Exhibition (ICE), 15–18 October 2017, London, UK, 1–20, 2018.
Gregersen, U., Hopper, J. R., and Knutz, P. C.: Basin seismic stratigraphy and aspects of prospectivity in the NE Baffin Bay, Northwest Greenland, Mar. Petrol. Geol., 46, 1–18, 2013.
Gregersen, U., Knutz, P. C., and Hopper, J. R.: New geophysical and geological mapping of the eastern Baffin Bay region, offshore West Greenland, Geol. Surv. Den. Greenl., 35, 83–86, https://doi.org/10.34194/geusb.v35.4945, 2017.
Gregersen, G., Knutz, P. C., Nøhr-Hansen, H., Sheldon, E., and Hopper, J. R.: Tectonostratigraphy and evolution of the West Greenland continental margin, B. Geol. Soc. Denmark, 67, 1–21, https://doi.org/10.37570/bgsd-2019-67-01, 2019.
Haneberg, W. C., Kelly, J. T., Graves, H. L., and Dan, G.: A GIS-based decision-support approach to deepwater drilling-hazard maps, The Leading Edge, 34, 398–404, https://doi.org/10.1190/tle34040398.1, 2015.
Hasle, J. R., Kjellén, U., and Haugerud, O.: Decision on oil and gas exploration in an Arctic area: case study from the Norwegian Barents Sea, Safety Sci., 47, 832–842, https://doi.org/10.1016/j.ssci.2008.10.019, 2009.
Heggland, R., Nygaard, E. T., and Gallagher, J.: Techniques and experiences using exploration 3D seismic data to map drilling hazards, Offshore Technology Conference, 6–9 May 1996, Houston, Texas, USA, 1–9, 1996.
Henriksen, N., Higgins, A. K., Kalsbeek, F., Christopher, T., and Pulvertaft, R.: Greenland from Archaean to Quaternary: Descriptive text to the 1995 Geological map of Greenland, 1 : 2 500 000, Geol. Surv. Den. Greenl., 18, 1–126, https://doi.org/10.34194/ggub.v185.5197, 2009.
Hill, A. W.: The use of exploration 3D data in geohazard assessment: where does the future lie?, Offshore Technology Conference, Houston, Texas, USA, 1996, 1-5, 1996.
Hill, A. W., Hampson, K. M., Hill, A. J., Golightly, C., Wood, G. A., Sweeney, M., and Smith, M. M.: ACG field geohazards management: unwinding the past, securing the future, Offshore Technology Conference, 4–7 May 2015, Houston, Texas, USA, 1–22, 2015.
Hilterman, F. J.: Seismic Amplitude Interpretation, Distinguished Instructor Series No. 4, Society of Exploration Geophysicists, Tulsa, OK, USA, 1–244, 2001.
Holland, P.: Offshore blowouts: causes and control, Gulf Publishing Company, Houston, Texas, USA, 1–176, 1997.
Hovland, M., Francis, T. J. G., Claypool, G. E., and Ball, M. M.: Strategy for scientific drilling of marine gas hydrates, JOIDES Journal, 25, 20–24, 1998.
Huuse, M. and Feary, D. A.: Seismic inversion for acoustic impedance and porosity of Cenozoic cool-water carbonates on the upper continental slope of the Great Australian Bight, Mar. Geol., 215, 123–134, https://doi.org/10.1016/j.margeo.2004.12.005, 2005.
Jeanjean, P., Liedtke, E., Clukey, E. C., Hampson, K., and Evans, T.: An operator's perspective on offshore risk assessment and geotechnical design in geohazard-prone areas, Frontiers in Offshore Geotechnics: Proceedings of the International Symposium on Frontiers in Offshore Geotechnics (IS-FOG 2005), 19–21 September 2005, Perth, WA, Australia, 115–143, 2005.
Jensen, P. J. and Cauquil, E.: Guidelines for the conduct of offshore drilling hazard site surveys, International Association of Oil & Gas Producers, London, UK, 1–46, 2013.
Khabibullin, T., Falcone, G., and Teodoriu, C.: Drilling through gas-hydrate sediments: Managing wellbore-stability risks, SPE Drill. Completion, 26, 287–294, https://doi.org/10.2118/131332-PA, 2011.
Khan, F. A., Zohdi, S. B. M., Beng, Q. K., Mohamed, H. B., and Yahya, M. A. M.: High-resolution pseudo 3D seismic data for shallow marine exploration and geohazard assessment in Offshore Malaysia, 80th EAGE Conference and Exhibition 2018, 11–14 June 2018, Copenhagen, Denmark, 1–5, 2018.
Knutz, P. C., Hopper, J. R., Gregersen, U., Nielsen, T., and Japsen, P.: A contourite drift system on the Baffin Bay–West Greenland margin linking Pliocene Arctic warming to poleward ocean circulation, Geology, 43, 907–910, https://doi.org/10.1130/G36927.1, 2015.
Knutz, P. C., Campbell, D. C., Bierman, P. R., de Vernal, A., Huuse, M., Jennings, A., Cox, D. R., DeConto, R., Gohl, K., Hogan, K., Hopper, J. R., Keisling, B., Newton, A. M. W., Perez, L., Rebschläger, J., Sliwinska, K. K., Thomas, E., Willerslev, E., Xuan, C., and Stoner, J.: Cenozoic evolution of the northern Greenland Ice Sheet exposed by transect drilling in northeast Baffin Bay (CENICE), International Ocean Discovery Program, Online, 5, available at: https://docs.iodp.org/Proposal_Cover_Sheets/909-Full2_Knutz_cover.pdf (last access: 27 October 2020), 2018.
Knutz, P. C., Newton, A. M. W., Hopper, J. R., Huuse, M., Gregersen, U., Sheldon, E., and Dybkjær, K.: Eleven phases of Greenland Ice Sheet shelf-edge advance over the past 2.7 million years, Nat. Geosci., 12, 361–368, https://doi.org/10.1038/s41561-019-0340-8, 2019.
Knutz, P. C., Harrison, C., Brent, T. A., Gregersen, G., and Hopper, J. R.: Baffin Bay Tectono-Sedimentary Element, in: Arctic Sedimentary Basins, edited by: Drachev, S., and Moore, T. E., Geological Society London, London, submitted, 2020.
Kvenvolden, K. A.: A primer on gas hydrates, in: The Future of Energy Gases, edited by: Howell, D. G., Wiese, K., Fanelli, M., Zink, L. L., and Cole, F., USGS, Washington DC, USA, 279–291, 1993.
Kvenvolden, K. A., Ginsburg, G. D., and Soloviev, V. A.: Worldwide distirbution of subaquatic gas hydrates, Geo-Mar. Lett., 13, 32–40, https://doi.org/10.1007/BF01204390, 1993.
Lancelot, Y. and Seibold, E.: The evolution of the central Northeastern Atlantic – Summary of results of DSDP Leg 41, in: Initial reports of the DSDP, edited by: Lancelot, Y., Seibold, E., and Gardner, J. V., U.S. Government Printing Office, Washington, USA, 1215–1245, 1977.
Li, P., Cai, Q., Lin, W., Chen, B., and Zhang, B.: Offshore oil spill response practices and emerging challenges, Mar. Pollut. Bull., 110, 6–27, https://doi.org/10.1016/j.marpolbul.2016.06.020, 2016.
Marzec, P. and Pietsch, K. M.: Thin-bedded strata and tuning effect as causes of seismic data anomalies in the top part of the Cenomanian sandstone in the Grobla–Rajsko–Rylowa area (Carpathian foreland, Poland), Geol. Q., 56, 690–710, https://doi.org/10.7306/gq.1050, 2012.
Mearns, K. and Flin, R.: Risk perception and attitudes to safety by personnel in the offshore oil and gas industry: a review, J. Loss Prevent. Proc., 8, 299–305, https://doi.org/10.1016/0950-4230(95)00032-V, 1995.
Minshull, T. A., Marín-Moreno, H., Betlem, P., Bialas, J., Bünz, S., Burwicz, E., Cameselle, L., Cifci, G., Giustinaini, M., Hillman, J. I. T., Hölz, S., Hopper, J. R., Ion, G., León, R., Magalhaes, V., Makovsky, Y., Mata, M., Max, M. D., Nielsen, T., Okay, S., Ostrovsky, I., O'Neil, N., Pinheiro, L. M., Plaza-Faverola, A., Rey, D., Roy, S., Schwalenberg, K., Senger, K., Vadakkepuliyambatta, S., Vasilev, A., and Vázquez, J. T.: Hydrate occurrence in Europe: A review of available evidence, Mar. Petrol. Geol., 111, 735–764, https://doi.org/10.1016/j.marpetgeo.2019.08.014, 2020.
Mitchell, J., Marcel, V., and Mitchell, B.: What next for the oil and gas industry?, Chatham House, London, UK, 128 pp., 2012.
Moore, R., Ushet, N., and Evans, T.: Integrated multidisciplinary assessment and mitigation of West Nile Delta geohazards, Offshore Site Investigation and Geotechnics, Confronting New Challenges and Sharing Knowledge, London, UK, 1–10, 2007.
Muller, S., Reinhardt, L., Franke, D., Gaedicke, C., and Winsemann, J.: Shallow gas accumulations in the German North Sea, Mar. Petrol. Geol., 91, 139–151, https://doi.org/10.1016/j.marpetgeo.2017.12.016, 2018.
Nadim, F. and Kvalstad, T. J.: Risk assessment and management for offshore geohazards, Proceedings of the ISGSR, 18–19 October 2007, Shanghai, China, 159–173, 2007.
Nanda, N. C.: Direct Hydrocarbon Indicators (DHI), in: Seismic Data Interpretation and Evaluation for Hydrocarbon Exploration and Production, Springer, Cham, Switzerland, 103–113, 2016.
National Research Council: Scientific ocean drilling: accomplishments and challenges, The National Academies Press, Washington, DC, USA, 1–158, 2011.
Newton, A. M. W., Knutz, P. C., Huuse, M., Gannon, P., Brocklehurst, S. H., Clausen, O. R., and Gong, Y.: Ice stream reorganization and glacial retreat on the northwest Greenland shelf, Geophys. Res. Lett., 44, 7826–7835, https://doi.org/10.1002/2017GL073690, 2017.
Newton, A. M. W., Huuse, M., Knutz, P. C., and Cox, D. R.: Repeated ice streaming on the northwest Greenland continental shelf since the onset of the Middle Pleistocene Transition, The Cryosphere, 14, 2303–2312, https://doi.org/10.5194/tc-14-2303-2020, 2020.
Nøhr-Hansen, H., Pedersen, G. K., Knutz, P. C., Bojesen-Koefoed, J. A., Sliwinska, K. K., and Hovikoski, J.: Potential Cretaceous source-rocks from the north-east Baffin Bay, West Greenland, AAPG Europe Regional Conference – Global Analogues of the Atlantic Margin, 2–3 May 2018, Lisbon, Portugal, 2018.
Núñez-Betelu, L. K.: Rock-Eval/TOC pyrolysis data from the Kanguk Formation (Upper Cretaceous), Axel Heiberg and Ellesmere Islands, Canadian Arctic, Geological Survey of Canada, Calgary, Alberta, Canada, 29 pp., 1993.
Oakey, G. N. and Chalmers, J. A.: A new model for the Paleogene motion of Greenland relative to North America: Plate reconstructions of the Davis Strait and Nares Strait regions between Canada and Greenland, J. Geophys. Res., 117, 1–28, https://doi.org/10.1029/2011JB008942, 2012.
Ostanin, I., Anka, Z., and Di Primio, R.: Role of faults in Hydrocarbon Leakage in the Hammerfest Basin, SW Barents Sea: Insights from seismic data and numerical modelling, Geosciences, 7, 28, https://doi.org/10.3390/geosciences7020028, 2017.
Oukili, J., Gruffeille, J.-P., Otterbein, C., and Loidl, B.: Can high-resolution reprocessed data replace the traditional 2D high-resolution seismic data acquired for site surveys?, First Break, 37, 49–54, https://doi.org/10.3997/1365-2397.n0052, 2019.
Parkinson, R.: High-resolution site surveys, CRC Press, London, UK, 2000.
Pearce, C., Knutz, P. C., and Party, S. S.: Baffin Bay Ice-Ocean-Sediment Interactions (BIOS) cruise report, available at: https://geo.au.dk/fileadmin/ingen_mappe_valgt/Paleoceanography_group/LAKO_BIOS19_cruise_report.pdf (last access: 27 October 2020), 2019.
Planke, S., Symonds, P. A., Alvestad, E., and Skogseis, J.: Mid-Cretaceous source rock subcropping in the Baffin Bay, GEO ExPro, 6, 1–8, 2009.
Poppel, B.: Arctic Oil & Gas Development: The Case of Greenland, Arctic Yearbook 2018, 32 pp., available at: https://arcticyearbook.com/images/yearbook/2018/Scholarly_Papers/19_AY2018_Poppel.pdf (last access: 27 October 2020), 2018.
Prince, P. K.: Current drilling practices and the occurrence of shallow gas, in: Safety in offshore drilling, edited by: Ardus, D. A., and Green, C. D., Springer, Dordrecht, the Netherlands, 3–25, 1990.
Raef, A., Totten, M., Vohs, A., and Linares, A.: 3D Seismic Reflection Amplitude and Instantaneous Frequency Attributes in Mapping Thin Hydrocarbon Reservoir Lithofacies: Morrison NE Field and Morrison Field, Clark County, KS, Pure Appl. Geophys., 174, 4379–4394, https://doi.org/10.1007/s00024-017-1664-1, 2017.
Rebesco, M., Hernández-Molina, F. J., Van Rooij, D., and Wåhlin, A.: Contourites and associated sediments controlled by deep-water circulation processes: state-of-the-art and future considerations, Mar. Geol., 352, 111–154, https://doi.org/10.1016/j.margeo.2014.03.011, 2014.
Roberts, H. H., Doyle, E. H., Booth, J. R., Clark, B. J., Kaluza, M. J., and Hartsook, A.: 3D-Seismic Amplitude Analysis of the Sea Flooc An Important Interpretive Method for Improved Geohazards Evaluations, Offshore Technology Conference, Houston, Texas, USA, 1996,
Ruppel, C. D.: The US Geological Survey's Gas Hydrates Project, US Geological Survey, Reston, VA, USA, 1–4, 2018.
Ruppel, C., Boswell, R., and Jones, E.: Scientific results from Gulf of Mexico gas hydrates Joint Industry Project Leg 1 drilling: introduction and overview, Mar. Petrol. Geol., 25, 819–829, https://doi.org/10.1016/j.marpetgeo.2008.02.007, 2008.
Ruppelt, A. U. and West, C. L.: Shallow Water Flow Geopressures Arising From Confined Subsurface Slumps, SPE Annual Technical Conference and Exhibition, 26–29 September 2004, Houston, Texas, USA, 1–8, https://doi.org/10.2118/90980-MS, 2004.
Saini, J., Stein, R., Fahl, K., Weiser, J., Hebbeln, D., Hillaire-Marcel, C., and de Vernal, A.: Holocene variability in sea ice and primary productivity in the northeastern Baffin Bay, Arktos, 1–19, https://doi.org/10.1007/s41063-020-00075-y, 2020.
Sangree, J. B. and Widmier, J. M.: Interpretation of depositional facies from seismic data, Geophysics, 44, 131–160, https://doi.org/10.1190/1.1440957, 1979.
Scherwath, M., Riedel, M., Spence, G., and Hyndman, R.: Data report: seismic structure beneath the north Cascadia drilling transect of IODP Expedition 311, Proceedings of the Integrated Ocean Drilling Program: Scientific Results, 311, 1–25, 2006.
Selvage, J., Jones, C., and Edgar, J.: Maximizing the value of 3D seismic data for shallow geohazard identification, First Break, EAGE, Houten, the Netherlands, 30, 73–83, ISSN 0263-5046, 2012.
Sharp, A. and Badalini, G.: Using 3D seismic data to map shallow-marine geohazards: a case study from the Santos Basin, Brazil, Petrol. Geosci., 19, 157–167, https://doi.org/10.1144/petgeo2011-063, 2013.
Sharp, A. and Samuel, A.: An example study using conventional 3D seismic data to delineate shallow gas drilling hazards from the West Delta Deep Marine Concession, offshore Nile Delta, Egypt, Petrol. Geosci., 10, 121–129, https://doi.org/10.1144/1354-079303-588, 2004.
Smith, P., Milne, R., Vey, G., Apeland, G., and Way, S.: Can Shallow Hazard 3D Seismic Cubes Enable Leaner Exploration Workflows?, 81st EAGE Conference and Exhibition, 3–6 June 2019, London, UK, 1–5, 2019.
Stewart, F. S. and Stoker, M. S.: Problems associated with seismic facies analysis of diamicton-dominated, shelf glacigenic sequences, Geo-Mar. Lett., 10, 151–156, https://doi.org/10.1007/BF02085930, 1990.
Suicmez, V. S.: Future Direction in Oil and Gas Exploration and Production, in: Exploration and Production of Petroleum and Natural Gas, edited by: Riazi, M., ASTM International, West Conshohocken, PA, USA, 693–710, 2016.
Vanneste, M., Sultan, N., Garziglia, S., Forsberg, C. F., and L'Heureux, J.-S.: Seafloor instabilities and sediment deformation processes: The need for integrated, multi-disciplinary investigations, Mar. Geol., 352, 183–214, https://doi.org/10.1016/j.margeo.2014.01.005, 2014.
Wei, J., Liang, J., Lu, J., Zhang, W., and He, Y.: Characteristics and dynamics of gas hydrate systems in the northwestern South China Sea-Results of the fifth gas hydrate drilling expedition, Mar. Petrol. Geol., 110, 287–298, https://doi.org/10.1016/j.marpetgeo.2019.07.028, 2019.
Weimer, P. and Pettingill, H. S.: Deep-water exploration and production: A global overview, in: Atlas of deep-water outcrops: AAPG Studies in Geology, edited by: Nilsen, T. H., Shew, R. D., Steffens, G. S., and Studlick, J. R. J., AAPG and Shell Exploration & Production, Tulsa, OK, USA, CD-ROM, 1–29, 2007.
Weitemeyer, K., Constable, S., and Key, K.: Marine EM techniques for gas-hydrate detection and hazard mitigation, The Leading Edge, 25, 629–632, https://doi.org/10.1190/1.2202668, 2006.
Whittaker, R. C., Hamann, R. E., and Pulvertaft, T. C. R.: A New Frontier Province Offshore Northwest Greenland: Structure, Basin Development, and Petroleum Potential of the Melville Bay Area, AAPG Bull., 81, 978–998, 1997.
Williams, J. P. and Andresen, P. C.: Application of conventional 3D data to geohazard assessment, Offshore Technology Conference, 6–9 May 1996, Houston, Texas, USA, 1–7, 1996.
Wood, G. A. and Hamilton, I. W.: Current geohazard problems and their geophysical interpretation-An international overview, Offshore Technology Conference, 6–9 May 2002, Houston, Texas, USA, 1–9, 2002.