 | 25 Feb 2022
Comparison of sediment composition by smear slides to quantitative shipboard data: a case study on the utility of smear slide percent estimates, IODP Expedition 353, northern Indian Ocean
Kate Littler
Smear slide petrography has been a standard technique during scientific ocean drilling expeditions to characterize sediment composition and classify sediment types, but presentation of these percent estimates to track downcore trends in sediment composition has become less frequent over the past 2 decades. We compare semi-quantitative smear slide composition estimates to physical property (natural gamma radiation, NGR) and solid-phase geochemical (calcium carbonate, CaCO3 %) measurements from a range of marine depositional environments in the northern Indian Ocean (Bay of Bengal, Andaman Sea, Ninetyeast Ridge) collected during International Ocean Discovery Program (IODP) Expedition 353. We show that presenting smear slide estimates as percentages, rather than abundance categories, reveals similar downcore variation in composition to the more quantitative core analyses. Overall downcore trends in total calcareous components from smear slides (foraminifers + nannofossils + shell fragments + authigenic carbonate) follow similar downcore trends to samples measured by CaCO3 coulometry. Total lithogenic components (clay + mica + quartz + feldspars + lithic grains + vitric grains + glauconite + heavy minerals + iron oxides) and clay from smear slides track reasonably well with NGR measurements. Comparison of site averages of absolute percentages of total calcium carbonate from coulometry and total calcareous components from smear slide observations reveals an overestimation in carbonate percentages in smear slides (likely due in part to underestimation of the clay fraction), especially in sediments rich in smectite clays. Differences in sediment color between sites and settling of clay particles during slide preparation may contribute to this discrepancy. Although smear slide estimates range in accuracy depending on the training of the operator, we suggest that sedimentologists describing cores obtained during scientific drilling can use the percent estimates of sedimentary components in smear slides to identify trends and cyclicity in marine sediment records.
- Article
(20559 KB) - Full-text XML
- BibTeX
- EndNote


Visual estimation has long been used as a standard method for describing sediments and sedimentary rocks (e.g., Folk, 1951; Terry and Chilingar, 1955; Reid, 1985). In particular, smear slide petrography has become a standard procedure for identification of microscopic components and lithology classification for (predominantly unconsolidated) sediments recovered during scientific drilling, including Deep Sea Drilling Project (DSDP), Ocean Drilling Program (ODP), Integrated Ocean Drilling Program/International Ocean Discovery Program (IODP), and International Continental Scientific Drilling (ICDP) expeditions (Musich, 1984; Mazzullo and Graham, 1988; Rothwell, 1989; Myrbo et al., 2011; Marsaglia et al., 2013, 2015). These smear slide descriptions are used in tandem with macro-scale visual core descriptions for the classification of recovered sediments using a variety of classification and nomenclature schemes (e.g., Folk, 1954; Shepard, 1954; Davies et al., 1977; Dean et al., 1985; Mazzullo et al., 1988; Carozzi, 1988, 1993; Flügel, 2010; Milliken, 2014).
Quantitative and semi-quantitative sediment characterization techniques such as multi-sensor core logging, spectral reflectance, X-ray fluorescence (XRF), X-ray diffraction, coulometry, and carbon–hydrogen–nitrogen–sulfur (CHNS) elemental analysis have become standard techniques for characterizing the composition of marine sediment cores (e.g., Engleman et al., 1985; Schultheiss and McPhail, 1989; Verardo et al., 1990; Weaver and Schultheiss, 1990; Jansen et al., 1991; Mayer, 1991; Fisher and Underwood, 1995; Blum, 1997; Weber et al., 1997; Ortiz et al., 1999; Giosan et al., 2002; Croudace et al., 2006). However, visual microscopic and macroscopic descriptions, as described in the previous paragraph, are still widely used as an effective, fast, and low-cost technique for characterizing sediment core composition. Smear slide petrography allows for characterizing many components in loosely consolidated sediments that cannot be quantified using bulk or scanning analyses, for example, the exact nature of biogenic carbonates (foraminifers or calcareous nannofossils). Estimations of grain percentages are generally accurate to within 5 %–16 %, based on thin sections with known grain percentages (Allen, 1956). More experienced operators can make relatively consistent percentage estimations across samples (Griffiths and Rosenfeld, 1954). Examination of three areas of a smear slide allows for accurate determination of the major mineral and microfossil components (Marsaglia et al., 2013; Drake et al., 2014).
During recent scientific drilling operations, these semiquantitative smear slide estimates were used primarily to classify the sediment (e.g., to give it an appropriate name such as “nannofossil-rich clay”) and present photomicrographs. While this is indeed useful, the percent estimates are often not used to identify trends in sediment composition and tend to be lost within lithostratigraphic unit designations or relegated to archived data. There is little consistency in how abundances of smear slide constituents are presented within IODP reports between different expeditions. Abundance percentages from smear slides are sometimes presented in plots within IODP reports but are often not presented at all or merely as abundance categories (e.g., “very abundant”, “rare”). Of the 148 ODP and IODP expeditions between 1985 and 2019 with smear slide observations in the database, 58 (39 %) presented the observed abundances as percentages in plots within expedition reports, while 9 (6 %) presented these abundances as categories (Fig. 1). The majority (54 %) of these expedition reports do not present the smear slide abundances in figures of IODP proceedings. The number of expeditions visually presenting smear slide percentages in the proceedings reports has generally been decreasing: 45 % during ODP, 37 % during the Integrated Ocean Drilling Program, and 22 % during the International Ocean Discovery Program. There is no clear difference in how smear slide data are presented based on the focus of expeditions (e.g., palaeoceanographic, tectonic, biosphere).

Figure 1Trends in the presentation of smear slide abundances during the ODP and IODP phases of scientific ocean drilling between 1985 and 2019. Bars represent the number of expedition reports with each mode of presentation by year. (a) The number of expedition proceedings that included a description in the methods of smear slides being categorized into abundance categories (rare, common, abundant, etc.). (b) The number of expedition reports that did not present smear slide percentages in the report as figures, and these data are only present in the raw data archive. (c) The number of expedition reports that present smear slide data as abundance categories in figures. (d) The number of expedition reports that present smear slide percentages visually as figures (e.g., downcore line or bar charts).
Many methods sections of IODP proceedings specify abundance categories, especially in recent years (24 expeditions between 2009 and 2019) (Fig. 1), in which abundances were categorized as trace (< 1 %), rare (1 % to 5 %), common (> 5 % to 25 %), abundant (> 25 % to 50 % or 40 % to 75 %), and dominant (> 50 % or > 75 %) or a similar classification scheme. These methods correspond to expeditions that either present abundance categories or do not present figures with smear slide data at all. There appears to be a hesitancy during some IODP expeditions to report observed percentages from smear slides. For example, one IODP methods chapter states that
Errors can be large, however, especially for fine silt- and clay-size fractions, and reproducibility among different sedimentologists is expected to be poor. Smear slide analysis also tends to underestimate the amount of sand-size grains because they are difficult to incorporate evenly onto the slide. Thus, it would be misleading to report values as absolute percentages (Expedition 330 Scientists, 2012).
Another ODP expedition methods chapter states that “Because estimates of mineral percentages from smear slides are known to be inaccurate (Rothwell, 1989), we abandoned percentage estimates entirely” (Shipboard Scientific Party, 1997).
On the other hand, other expeditions do present smear slide percent estimates in expedition proceedings, allowing for visualization of downcore variation in sediment composition. These are typically presented as individual downcore patterns of each component (e.g., Gallagher et al., 2017; Shipboard Scientific Party, 1994a, b, 1996a) or as stacked 100 % component plots (e.g., Expedition 339 Scientists, 2013a; Shipboard Scientific Party, 1991, 1995a).
Despite having confidence in our smear slide percentages during IODP Expedition 353, we presented our smear slide observations as abundance categories in figures of the IODP proceedings, while the percentages entered into the database were preserved as tables (Clemens et al., 2016b, c, d). As the primary smear slide observers on IODP Expedition 353, we had previously sailed on IODP expeditions in which smear slide abundances were not presented visually (Expedition 324 Scientists, 2010) or were entered into the database as categories (J-CORES on Chikyu) (Expedition 337 Scientists, 2013). Looking to previous recent expeditions as examples, we saw numerous methods sections including abundance categories for smear slides (the majority of expeditions in the few years prior to IODP 353, including nearly every expedition in 2012; see Fig. 1) and assumed that this was a standard way to present smear slide data.
In this paper we compare smear slide descriptions (percent estimates) to physical property (natural gamma radiation) and solid-phase geochemical measurements (CaCO3 %) from sediment cores recovered during IODP Expedition 353 in the Bay of Bengal and Andaman Sea (Fig. 2) (Clemens et al., 2016a). We use these comparisons to demonstrate the effectiveness of smear slide petrography and to highlight potential strategies and challenges for using the smear slide technique in fine-grained sediments. We aim to give confidence to those describing smear slides in using the percent abundance estimates for downcore plots and interpretation and for unlocking information on sediment composition and origin that cannot be obtained using other bulk analyses. Although smear slide petrography does not have the accuracy of bulk quantitative analyses and is subject to biases, the percent estimates can still reveal trends in sediment composition that are important to the objectives of scientific drilling expeditions.
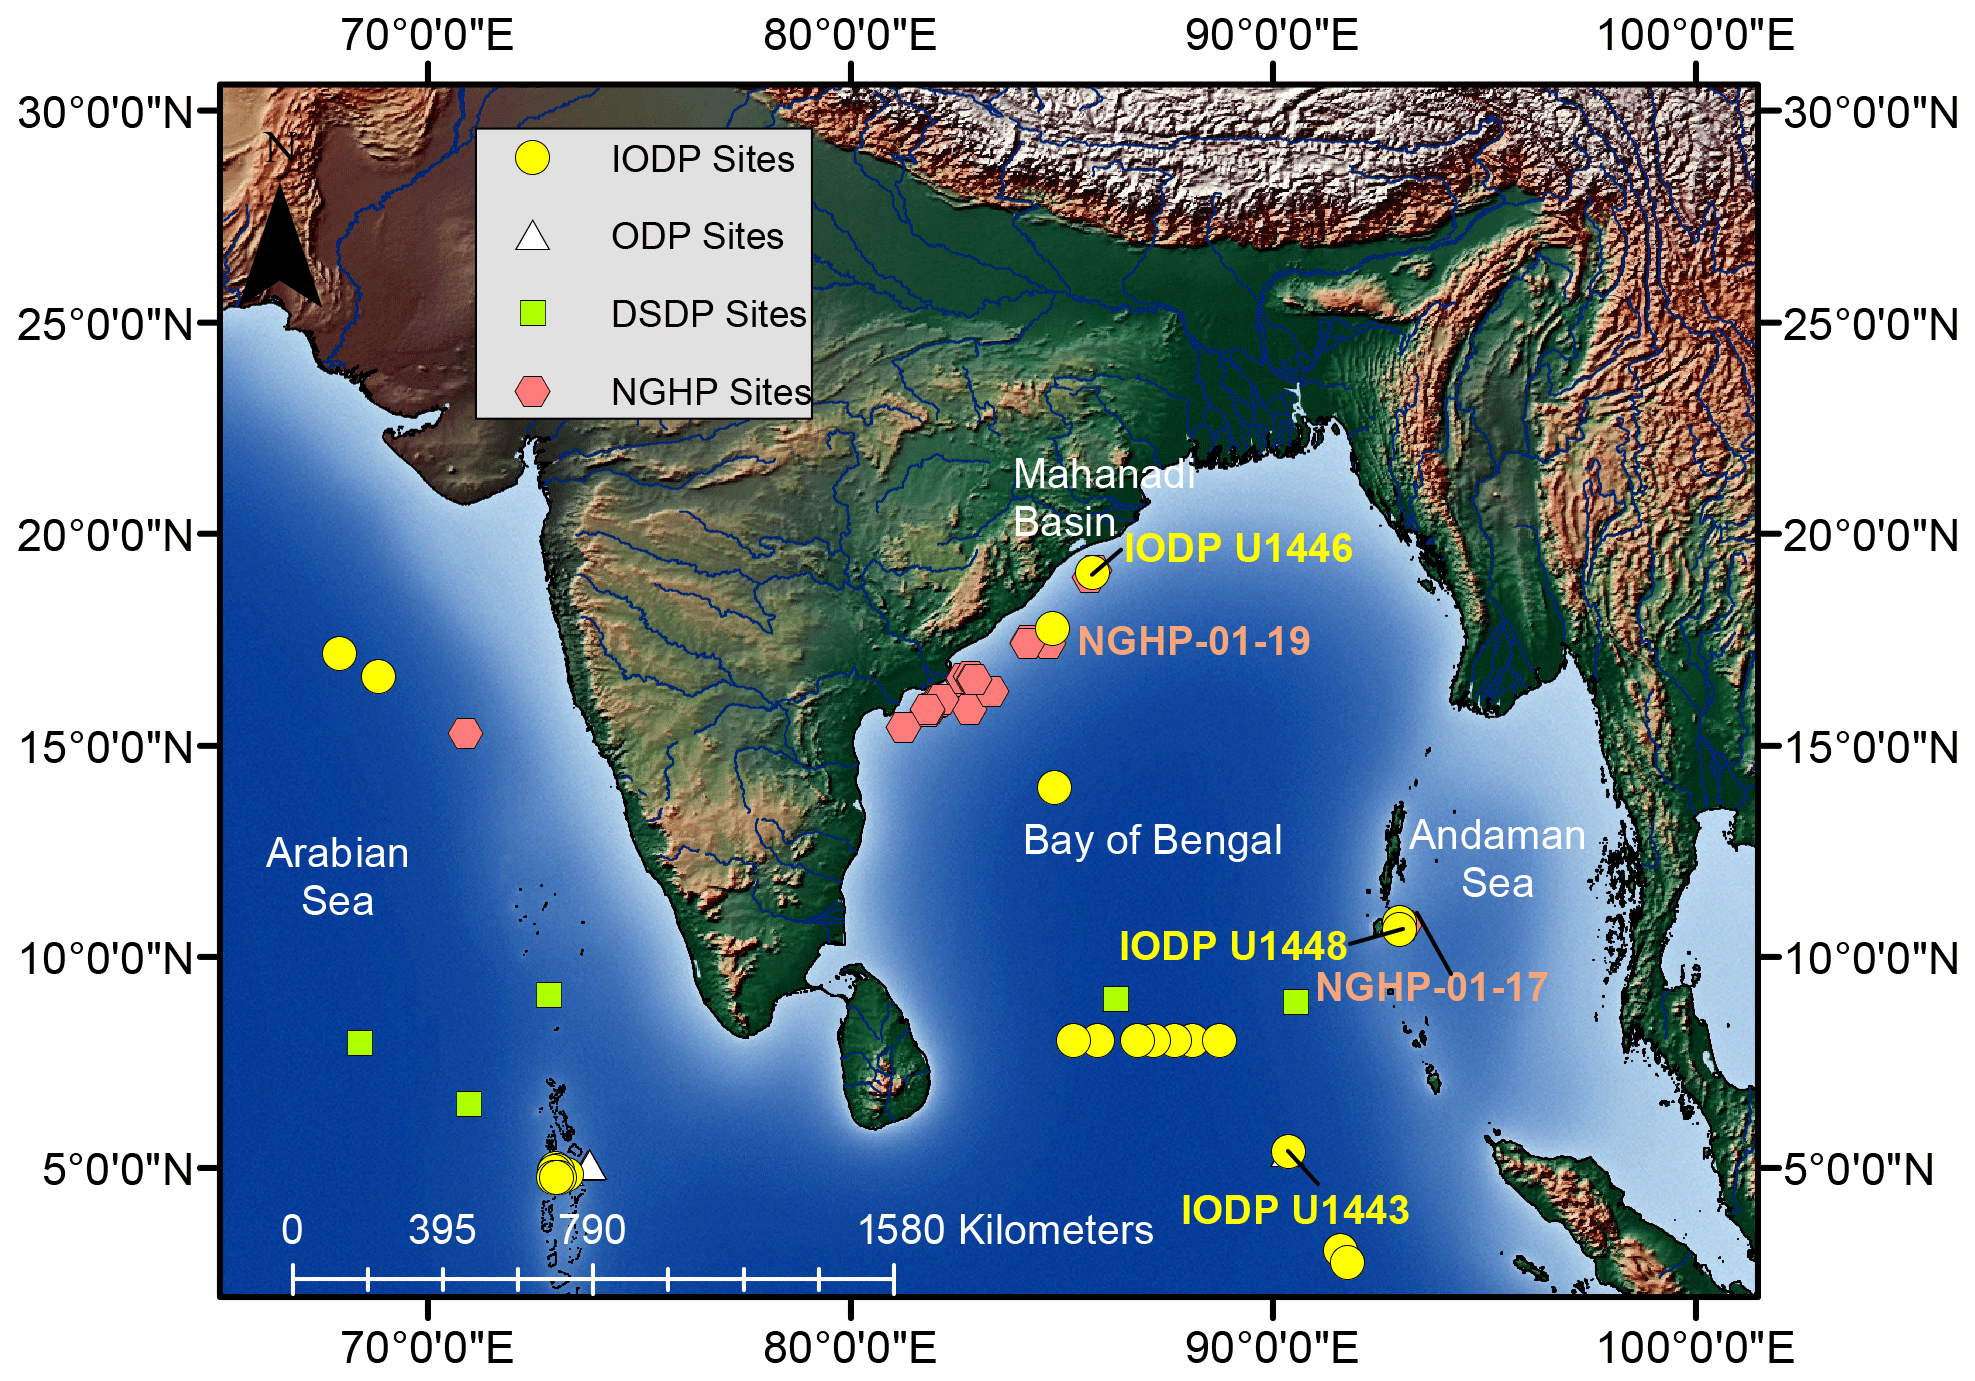
Figure 2Location map including scientific drilling sites in the northern Indian Ocean. These include expeditions of the International Ocean Discovery Program (IODP), Ocean Drilling Program (ODP), Deep Sea Drilling Project (DSDP), and Indian National Gas Hydrate Program (NGHP). All IODP sites within the scale of this map are from the International Ocean Discovery Program phase of drilling, not the Integrated Ocean Drilling Program phase.
During IODP Expedition 353 we recovered sediment cores from the peninsular Indian continental slope in the northern Bay of Bengal (Mahanadi Basin), the Andaman accretionary wedge, Ninetyeast Ridge, and the Bengal Fan (Clemens et al., 2016a) (Fig. 2). In this paper, we focus mainly on three of these sites: (1) U1443 at Ninetyeast Ridge, (2) U1446 in the Mahanadi Basin, and (3) U1448 in the Andaman Sea. Site U1443 (2929 meters below sea level or m b.s.l.) was a re-drill of Ocean Drilling Program (ODP) Site 758 (see Shipboard Scientific Party, 1989). At this site, we recovered a record of calcareous pelagic sediments (Fig. 3a, b) since the Cretaceous (with a very condensed Eocene section) on Ninetyeast Ridge (Barnet et al., 2020; Clemens et al., 2016b). Site U1446 (1430 m b.s.l.) was drilled 75 km offshore of the Indian subcontinent on the continental slope. The 180 m sediment record recovered at this site is entirely Pleistocene in age and consists of hemipelagic clay (Fig. 3c, d) with variable nannofossil and foraminifer content (Clemens et al., 2016c). Site U1448 (1091 m b.s.l.) was drilled in a forearc basin of the Andaman accretionary wedge ∼ 45 km east of Little Andaman Island (Clemens et al., 2016d). The 421 m of sediments recovered at this site are nannofossil-rich clay (Fig. 2e, f) with foraminifers of Pleistocene to Late Miocene age, with an 8 Myr hiatus at 379 m below the seafloor underlain by Early Miocene bio-siliceous ooze with clay and nannofossils.
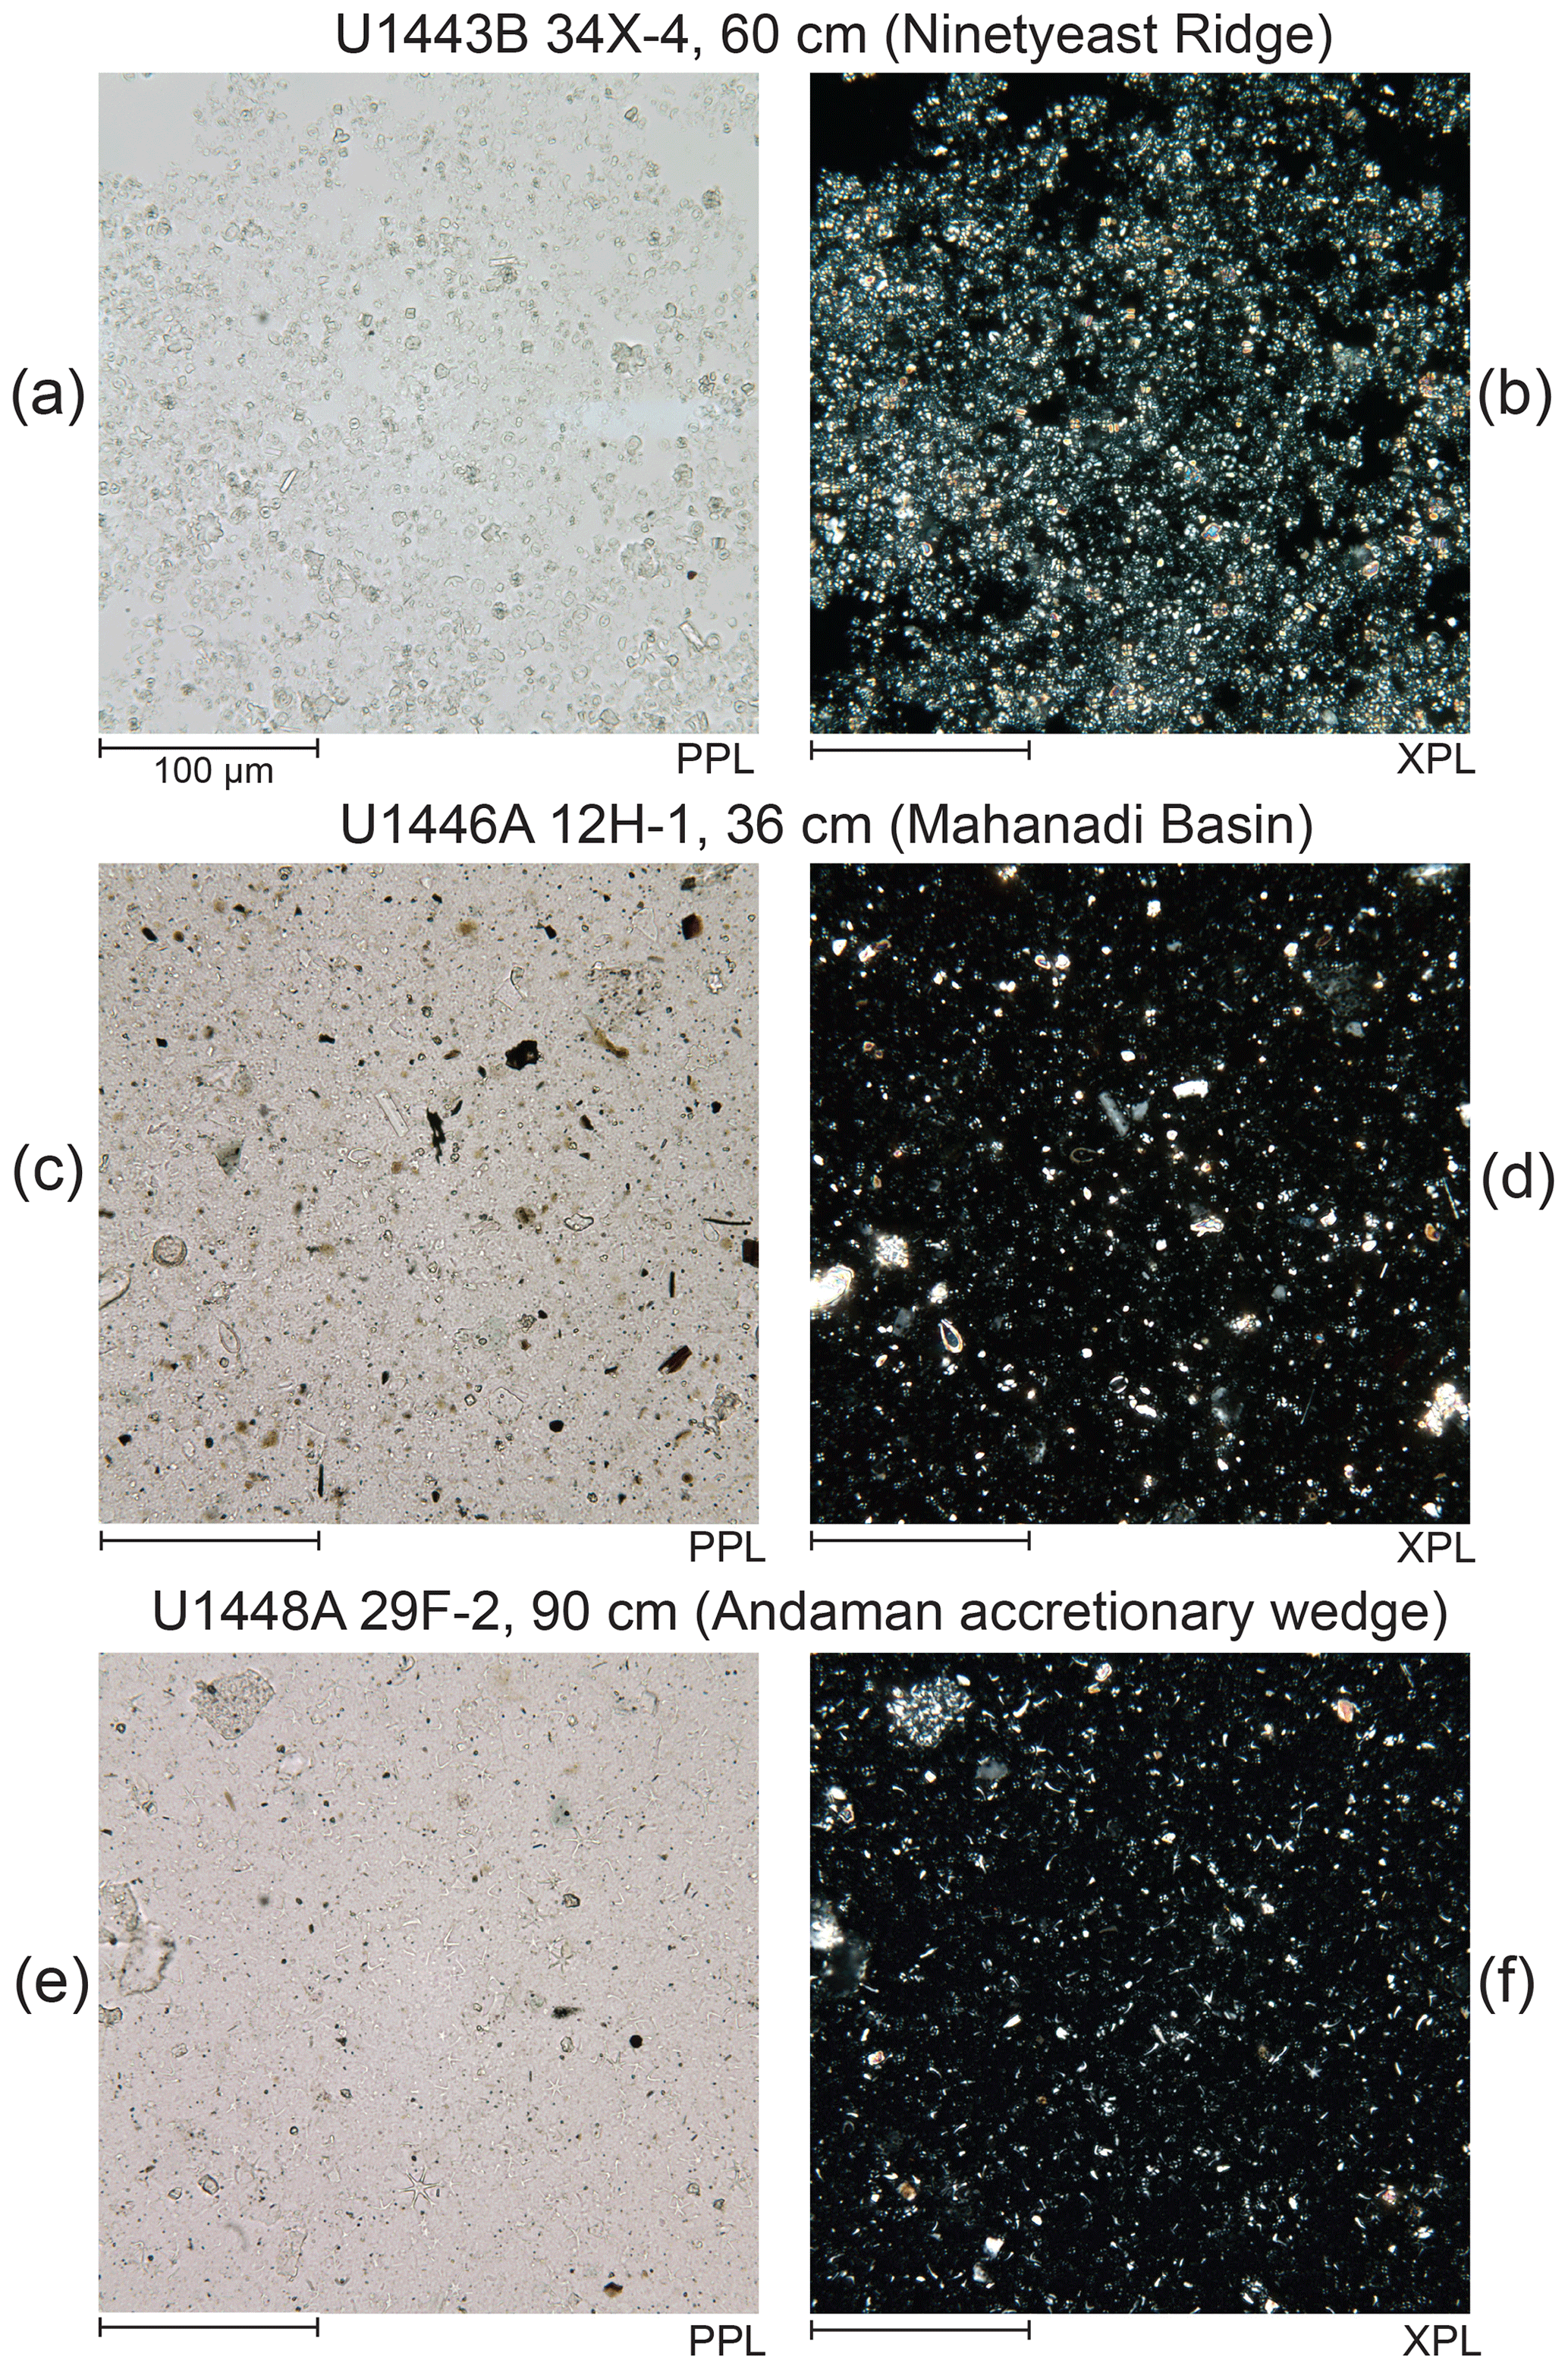
Figure 3Example photomicrographs of smear slides described during IODP Expedition 353. (a, b) Clayey nannofossil chalk with authigenic carbonate from Site U1443 (Ninetyeast Ridge). (c, d) Nannofossil-rich clay with foraminifers from Site U1446 (Mahanadi Basin). (e, f) Nannofossil-rich clay from Site U1448 (Andaman accretionary wedge). Photomicrographs are shown for both plane-polarized light (PPL; a, c, e) and cross-polarized light (XPL; b, d, f). The scale bar is 100 µm in each image.
We made smear slides using the methods of Marsaglia et al. (2013). We generated percent estimates for multiple lithogenic, biogenic, and authigenic components in each sample by viewing at least three areas of the slide. Smear slides were made from all sediment types recovered, with a focus on the major lithologies in each core. Most samples were taken from unconsolidated sediments with some more indurated sediments (chalk) from the deeper cores of Site U1443. Smear slide descriptions were performed mainly by only two operators during the expedition (one per shift), except for U1443, the first site drilled during IODP Expedition 353, which had three describers. Since each operator brings their own set of biases in estimation, this allowed for enhanced consistency by limiting the total number of biases affecting the descriptions. We each described the same set of example slides available on the JOIDES Resolution during the initial transit to “calibrate” our descriptions. These example slides with varying clay and carbonate composition (Marsaglia et al., 2013) were especially helpful for making consistent clay mineral percent estimates. We made clay size fraction estimates (< 4 µm) under 60× magnification and made estimates of clay mineral abundance based on the darkness/lightness of this fraction, calibrated by the training slide set. During coring operations and actual sample descriptions, each of us described one or two overlapping slides at the start of some shifts to maintain consistency. We observed approximately one to three smear slides per core in each hole under plane and cross-polarized light (Fig. 3), capturing primarily the major lithology, with some smear slides targeting minor lithologies (e.g., ash layers, turbidites). In the IODP Expedition 353 Proceedings report, we presented smear slide data in figures only as abundance categories (Clemens et al., 2016b, c, d).
To characterize the utility of our smear slide estimates, we sum the total carbonate components (foraminifers, calcareous nannofossils, shell fragments, and authigenic carbonates) in major lithologies and compare them to the calcium carbonate (CaCO3) content measured by coulometry in Hole A at Sites U1443, U1446, and U1448. Coulometry is a quantitative method for determining carbonate content (Engleman et al., 1985; Pimmel and Claypool, 2001). Total inorganic carbon was measured onboard the JOIDES Resolution on freeze-dried and powdered sediment samples using a UIC 5011 CO2 coulometer to a precision of ±1 % (Clemens et al., 2016e). One to three samples per core (approximately every 2 m) in Hole A of each site were measured for CaCO3 (see Clemens et al., 2016a, b, c). CaCO3 measurements were not performed on the same subsamples as smear slides, but these measurements capture major downcore trends at a similar resolution. We compare only the major lithology from smear slides and, given the consistent color and gradational change observed in these cores, these comparisons are appropriate for broad downcore trends in composition. Color banding, laminations, or turbidites were rare at these sites, and these minor occurrences are not compared here.
We also compare trends in the clay-mineral fraction and the total lithogenic fraction (clay mineral, mica, quartz, feldspars, lithic grains, vitric grains, glauconite, heavy minerals, and iron oxides) observed from smear slides to the natural gamma radiation (NGR) measured by whole round core logging. Each core section was scanned by a NGR logger consisting of eight sodium iodide detectors behind a lead shield, measured at a resolution of 20 cm and integrated over a core length of 40 cm, with an accuracy of ±1.5 % (Vasiliev et al., 2011). Toothpick samples collected for smear slides were collected within this integration length. In hemipelagic sediments, NGR is sourced from radioactive decay of potassium (40K), uranium (238U), and thorium (232Th) isotopes within the sediments. K is a major element within clay minerals, glauconite, and feldspars, while Th is present in clay minerals and monazite. U can be present in marine sediments absorbed to clays and organic matter as well as present in phosphate and some silicate minerals. Works by Dunlea et al. (2013) and De Vleeschouwer et al. (2017) have produced accurate calculations of K, U, and Th content based on NGR energy spectra measured onboard the JOIDES Resolution, including IODP Expedition 353 cores (De Vleeschouwer, 2017).
The overall goal of these comparisons is to determine how well smear slide estimates track with the quantitative geochemical and physical property measurements and so to give confidence in the use of smear slide data in determining the detailed composition of the sediment. All data presented vs. depth use the meter CSF-A scale (core depth in meters below the seafloor with no correction for core expansion) (Integrated Ocean Drilling Program Depth Scale Task Force, 2011).
4.1 Trends in smear slide and quantitative compositions
Overall, at each site we observe a similar pattern in the downcore patterns in the total carbonate components estimated by smear slide observation and CaCO3 % measured by coulometer, with varying differences in actual percent (Figs. 4, 5, and 6). We also observe downcore trends in smear slide clay fraction estimates that follow the downcore trends in NGR, which is primarily controlled by the lithogenic content, primarily clay minerals, in the cores. There are subtle shifts in smear slide estimates apparent at each site associated with different observers.
4.1.1 Ninetyeast Ridge
Site U1443 along Ninetyeast Ridge (Fig. 2) was described as nannofossil ooze/chalk with variable clay and foraminifer content and common volcanic ash beds (Clemens et al., 2016b). In smear slides from Hole U1443A, we observe increasing total carbonate and decreasing clay/lithogenic minerals with depth over the upper 150 m CSF-A and then decreasing total carbonate and increasing clay minerals from 250 to 350 m CSF-A (Fig. 4). Clay/lithogenic content follows a pattern inverse to carbonate and generally corresponds to the trend in NGR (Fig. 4). Total lithogenic content ranges from 5 % to 41 %, dominated by the clay fraction. We see a very similar trend in CaCO3 from coulometry and a match to within < 15 % between the two measurements for most of the record. A pronounced decrease in CaCO3 observed in smear slides between 110 and 140 m CSF-A matches the observed Miocene crash in carbonate deposition observed between 13.5 and 8.2 Ma based on XRF records at Site U1443 (Lübbers et al., 2019). We observe a deviation in the smear slide trends and an underestimate of carbonate content (with a corresponding overestimate of clay) below 250 m CSF-A, corresponding to an interval containing high authigenic carbonate and the presence of glauconite. The presence of glauconite and the overall increased lithification of this interval likely prevented full disaggregation of the sediment, and these clumps would impact the accuracy of the clay fraction estimates. The re-precipitation of calcite as authigenic carbonate and coloration from glauconite may have made the determination of clay content more difficult (see Sect. 4.2). These higher carbonate estimates also correspond to our third observer.
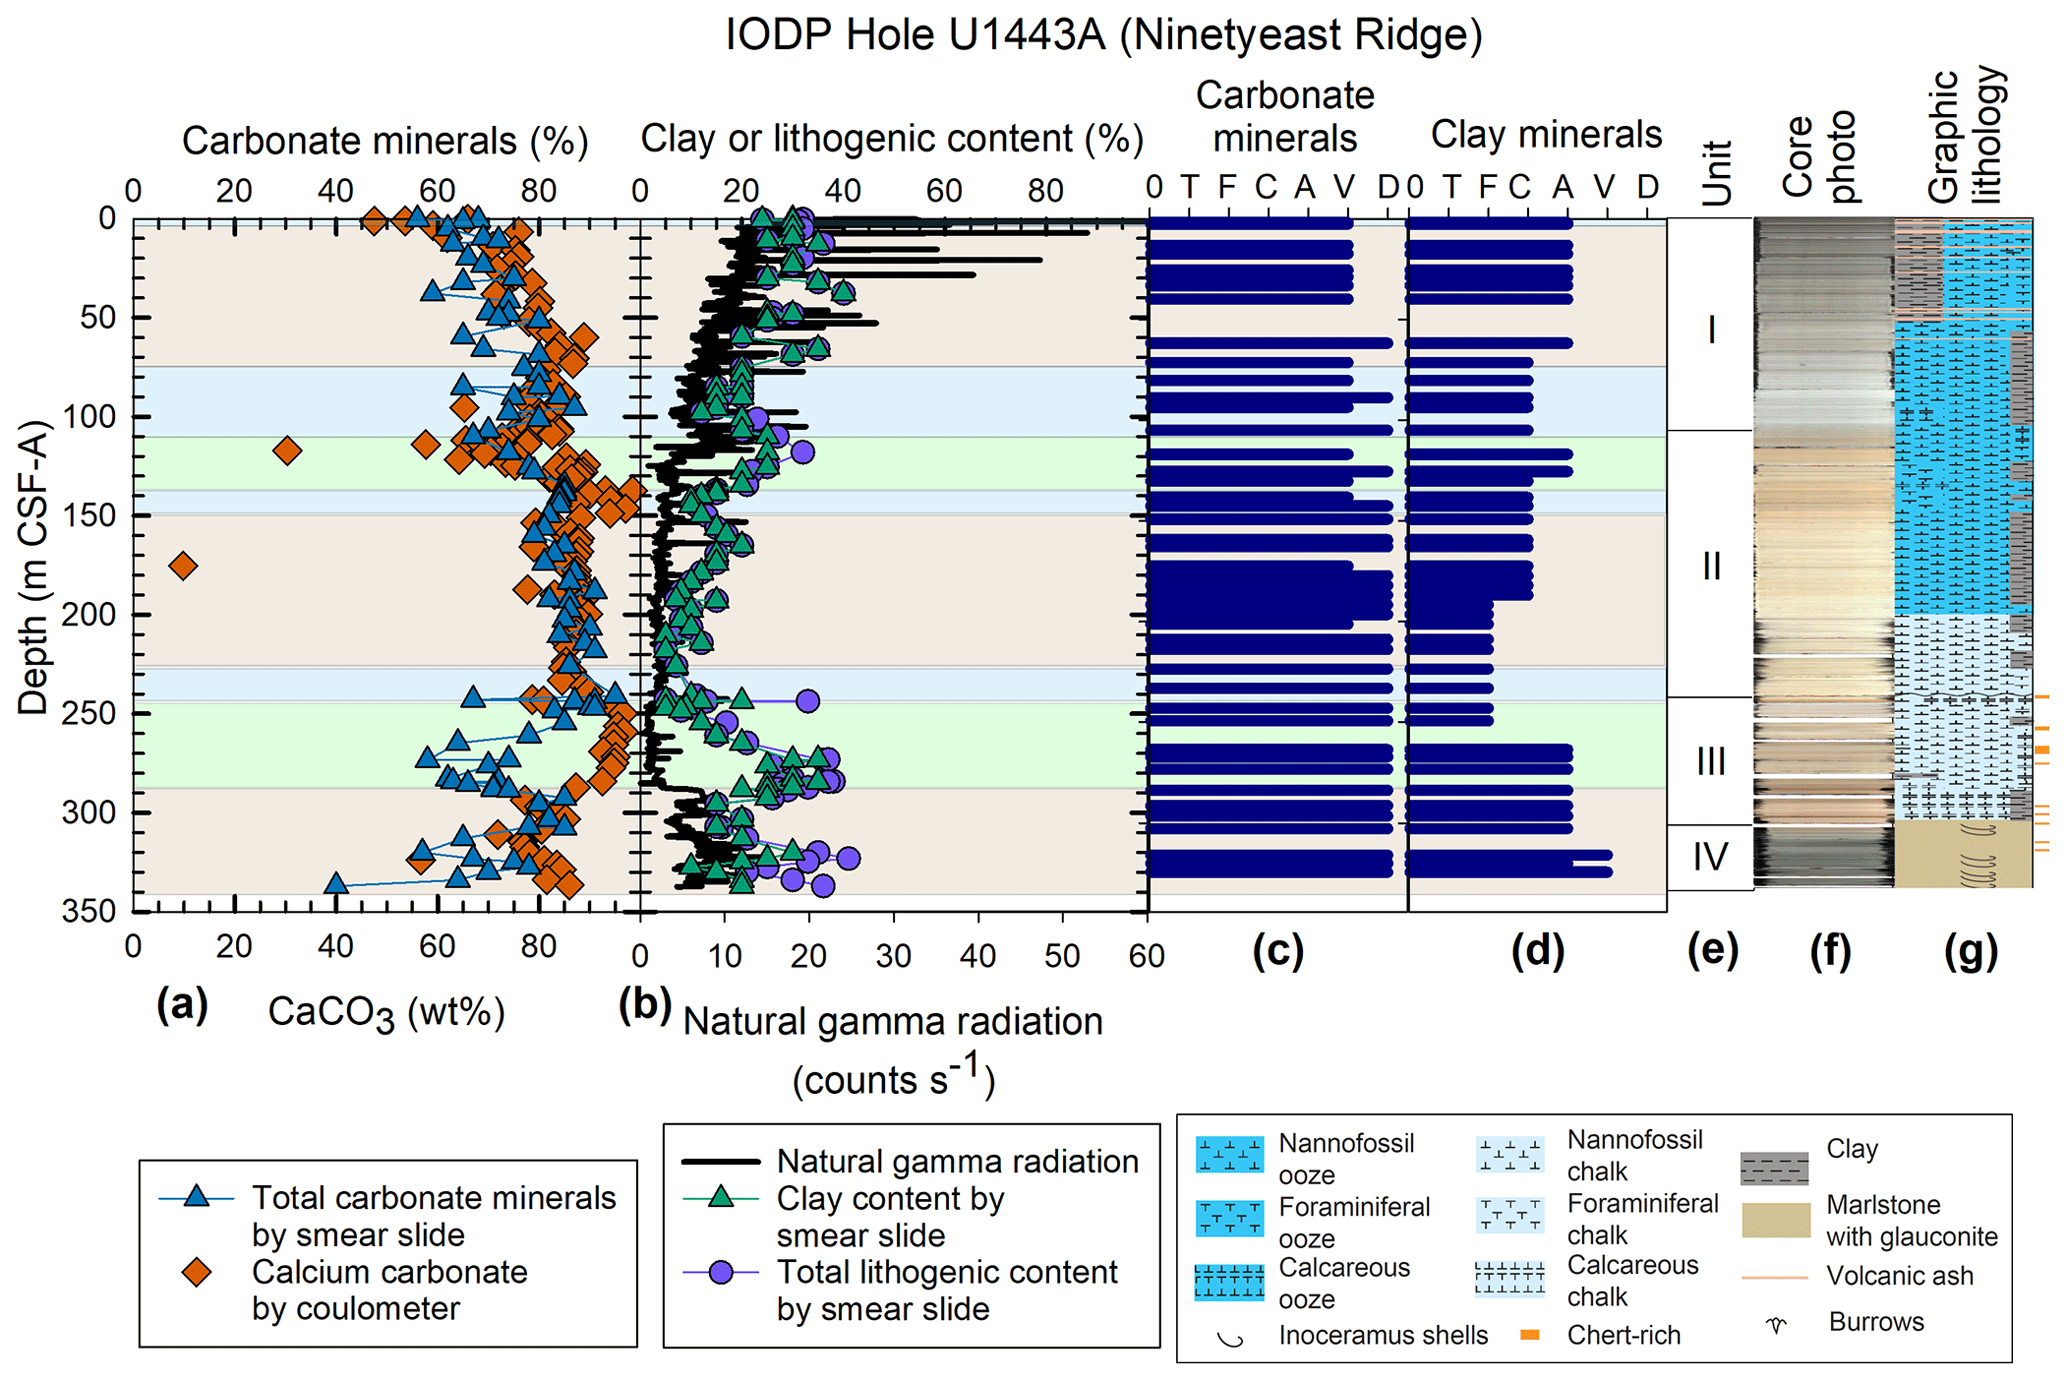
Figure 4Downcore data from Site U1443. (a) Comparison of carbonate mineral percentages estimated from smear slides (blue triangles for major lithology to CaCO3 measured by carbonate coulometer – orange diamonds). (b) Comparison of the clay fraction (green triangles) and total lithogenic fraction (purple circles) estimated from smear slides to natural gamma radiation measured by whole round core scanning (black line). The colored zones indicate the smear slide estimates from three observers. Panels (c) and (d) are the abundance categories of total carbonate minerals and total clay minerals, where 0 is none, T is trace (< 1 %), F is few (1 % to 9 %), C is common (10 % to 24 %), A is abundant (25 % to 40 %), V is very abundant (41 % to 74 %), and D is dominant (> 75 %) as presented in the IODP 353 Proceedings. (e) Lithostratigraphic units from visual core description. I: clayey nannofossil ooze with foraminifers, II: nannofossil ooze/chalk with clay and foraminifers, III: clayey calcareous/nannofossil chalk with foraminifers and authigenic carbonate, and IV: marlstone with glauconite (Clemens et al., 2016b). (f) Core photo composite. (g) Lithologic column.
4.1.2 Mahanadi Basin
Site U1446 was described as a nannofossil to foraminifer-bearing to foraminifer-rich clay (Clemens et al., 2016c). Based on smear slide observations, variable and cyclic carbonate and clay fraction abundances were observed at Site U1446 with clay ranging from ∼ 35 % to 85 % and carbonate minerals ranging from ∼ 5 % to 45 % (Fig. 5). Clay is the dominant lithogenic mineral, with less than 13 % other lithogenic minerals. CaCO3 measured by coulometry follows a similar cyclic pattern with a lower range (∼ 1 % to 30 % in major lithology). Although the magnitude of the variation in CaCO3 is larger in the smear slide estimates, smear slides capture the same peaks and troughs in CaCO3 abundance. This comparison suggests that smear slide estimates can capture the variation in CaCO3 accumulation due to stratification-driven productivity changes associated with glacial–interglacial cycles in the Bay of Bengal (Phillips et al., 2014a; da Silva et al., 2017; Ota et al., 2019). Similarly, the clay content follows similar trends in NGR, capturing the cyclic variation in relative clay and carbonate content (relative input of terrigenous sediments and biological production) at this site (Fig. 5).
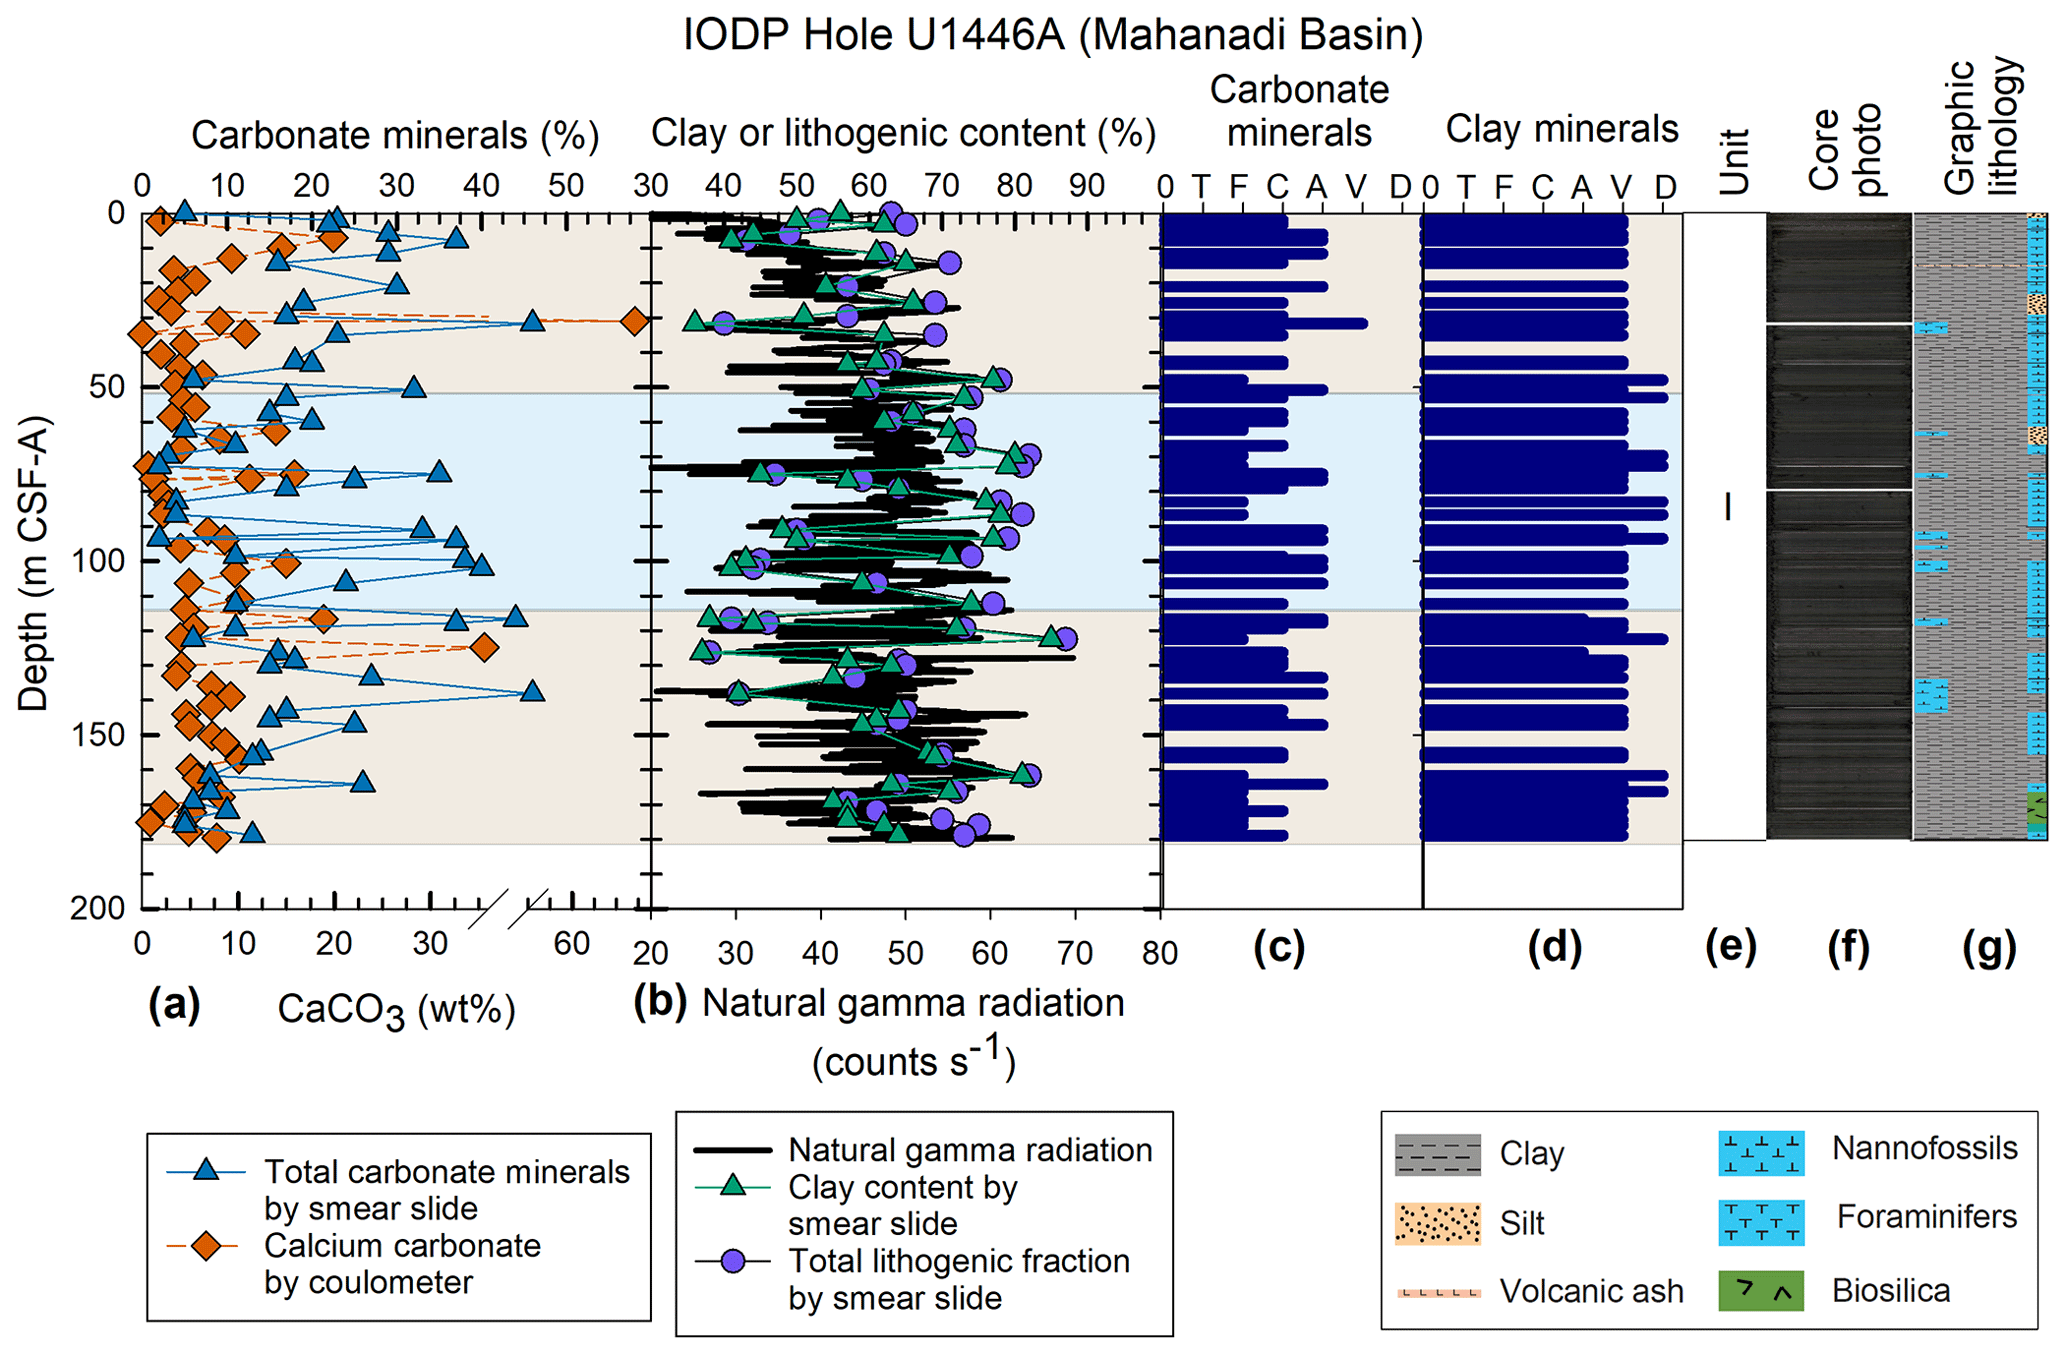
Figure 5Downcore data from Site U1446. (a) Comparison of carbonate mineral percentages estimated from smear slides (blue triangles) taken from within the major lithologies to CaCO3 measured by carbonate coulometer (orange diamonds). (b) Comparison of the clay fraction (green triangles) and total lithogenic fraction (purple circles) estimated from smear slides to natural gamma radiation measured by whole round core scanning (black line). The colored zones indicate the smear slide estimates from two observers. The colored zones indicate the smear slide estimates from two observers. Panels (c) and (d) are the abundance categories of total carbonate minerals and total clay minerals, where 0 is none, T is trace (< 1 %), F is few (1 % to 9 %), C is common (10 % to 24 %), A is abundant (25 % to 40 %), V is very abundant (41 % to 74 %), and D is dominant (> 75 %) as presented in the IODP 353 Proceedings. (e) Lithostratigraphic units from visual core description. Unit I is clay with nannofossils, foraminifers, and biosilica. (f) Core photo composite. (g) Lithologic column.
4.1.3 Andaman accretionary wedge
At Site U1448, carbonate content estimates by smear slide and coulometer follow similar trends, although in some intervals there was significant overestimation of absolute carbonate content in the smear slide estimates (e.g., 30 % vs. 50 % CaCO3; Fig. 6). Both the smear slide estimates and coulometer measurements show a declining trend with depth over the upper 180 m CSF-A followed by an increase between ∼ 180 and 280 m CSF-A. Both approaches capture the decrease in CaCO3 content that occurs below a hiatus at 379 m CSF-A where the lithology transitions from nannofossil-rich clay to clayey bio-siliceous ooze (Clemens et al., 2016d). Clay mineral content from smear slides follows the trend observed in NGR with minor deviations. The clay content estimates capture the broad maximum in NGR at ∼ 200 m CSF-A and the sharp decrease below the hiatus at 379 m CSF-A with the transition to clayey bio-siliceous ooze (Fig. 6).
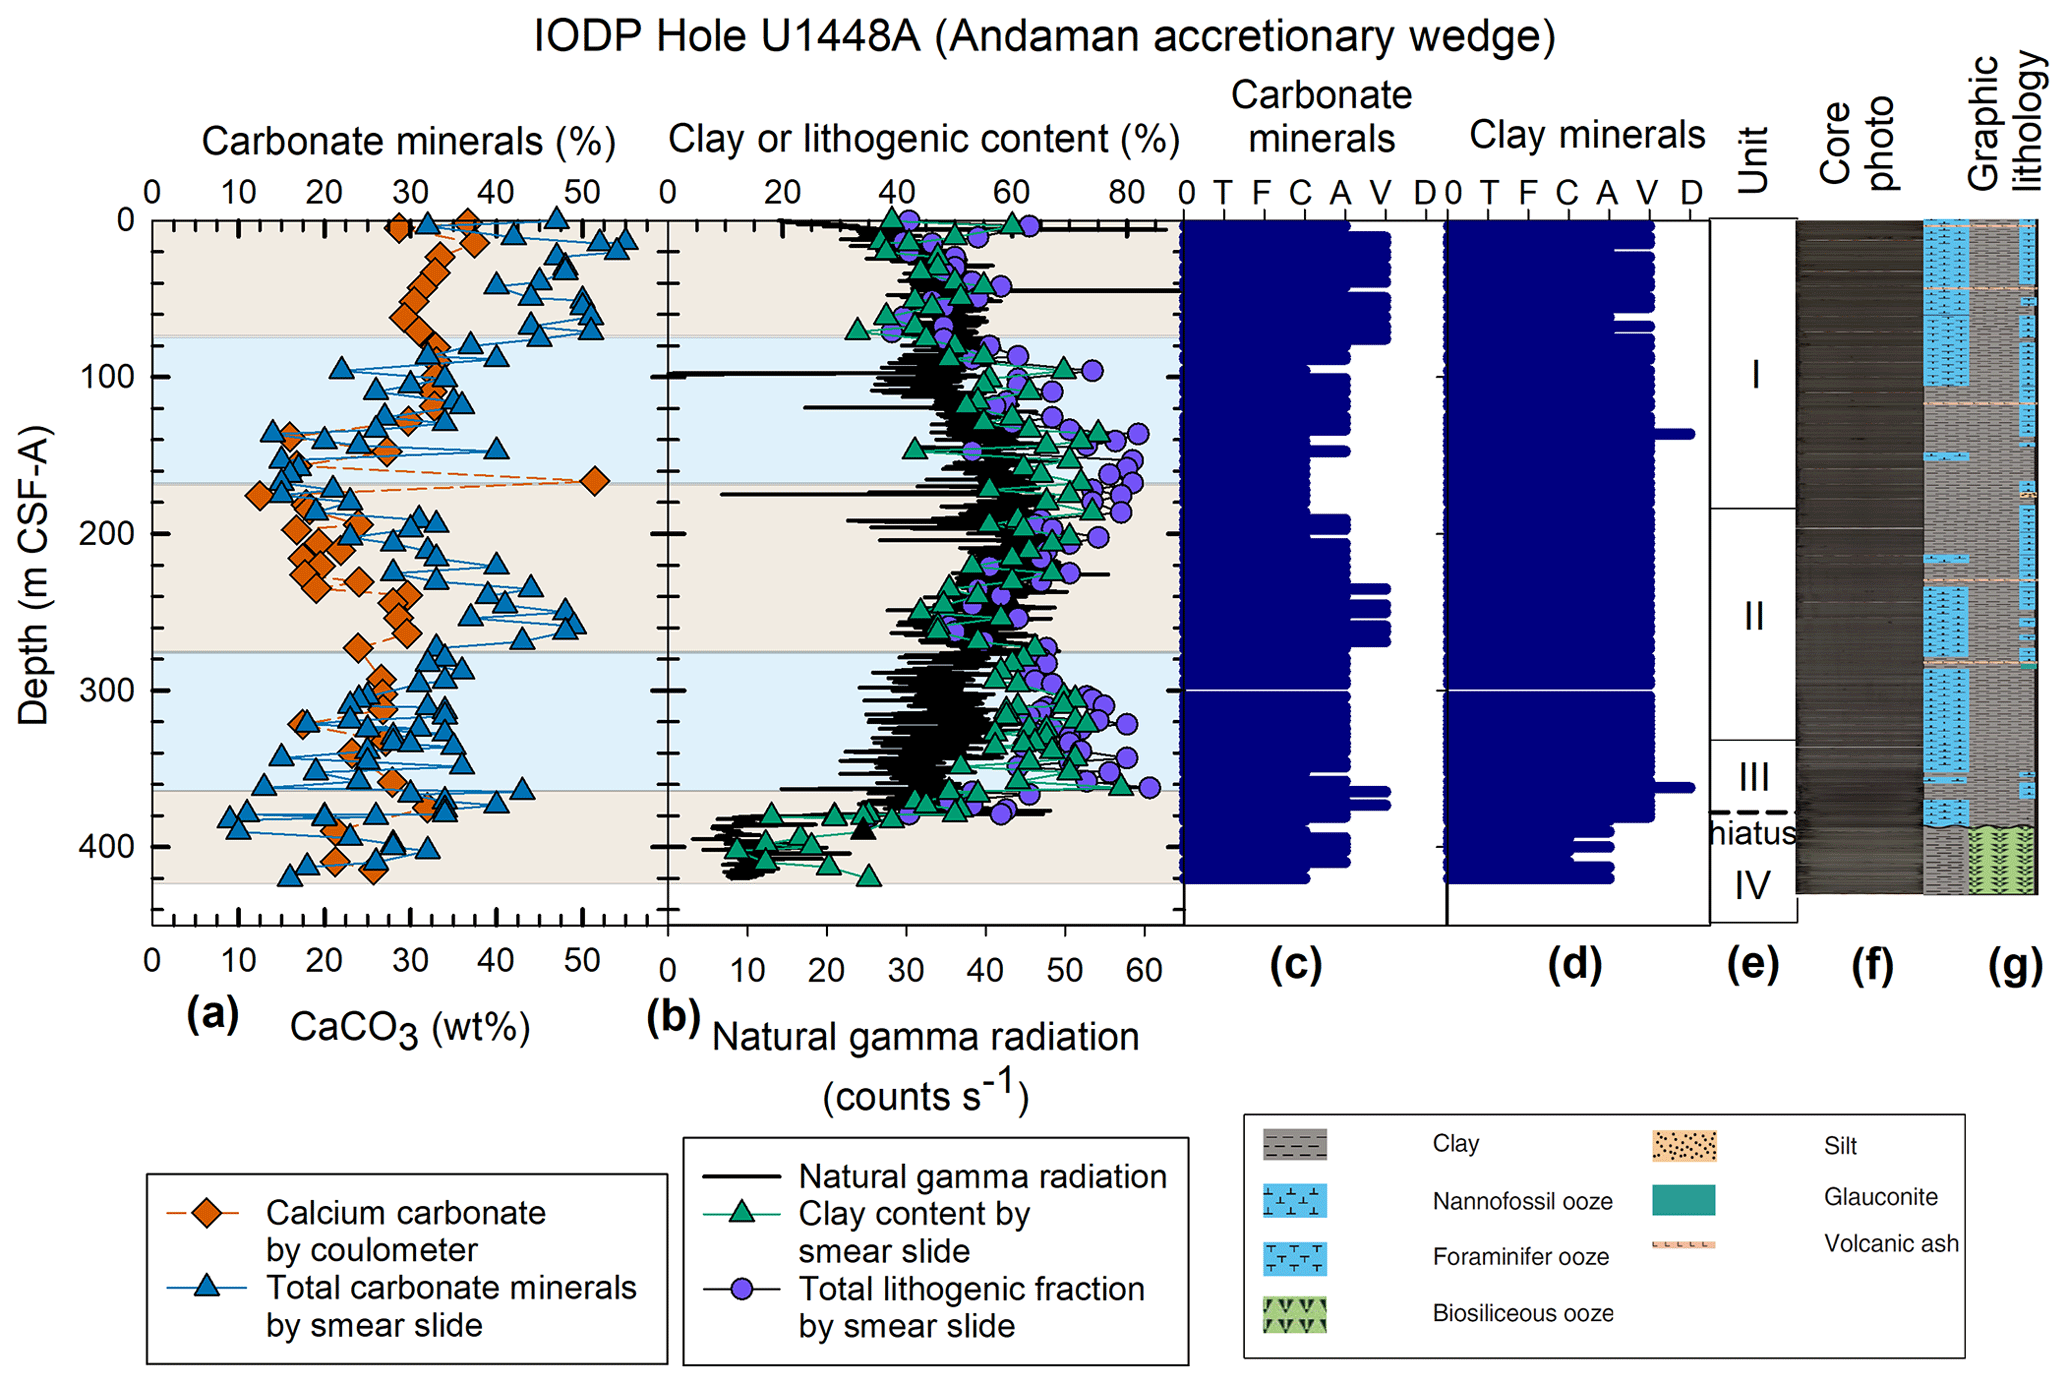
Figure 6Downcore data from Site U1448. (a) Comparison of carbonate mineral percentages estimated from smear slides (blue triangles) for the major lithologies to CaCO3 measured by carbonate coulometer (orange diamonds). (b) Comparison of the clay fraction (green triangles) and total lithogenic fraction (purple circles) estimated from smear slides to natural gamma radiation measured by whole round core scanning (black line). The colored zones indicate the smear slide estimates from two observers; panels (c) and (d) are the abundance categories of total carbonate minerals and total clay minerals, where 0 is none, T is trace (< 1 %), F is few (1 % to 9 %), C is common (10 % to 24 %), A is abundant (25 % to 40 %), V is very abundant (41 % to 74 %), and D is dominant (> 75 %) as presented in the IODP 353 Proceedings. (e) Lithostratigraphic units from visual core description. I: nannofossil-rich clay with foraminifers, II: clay with foraminifers, nannofossils, and silt, III: nannofossil-rich clay with foraminifers, and IV: clayey bio-siliceous ooze with nannofossils. There is an ∼ 8 Myr hiatus between Units III and IV. (f) Core photo composite. (g) Lithologic column.
4.2 Correlations with NGR
To better understand the relationship between lithology and NGR, we used cross plots of NGR vs. smear slide clay mineral and total lithogenic mineral abundance with linear regression (Fig. 7a–c). Because the NGR was measured at a relatively high resolution (20 cm) and sediment color is relatively homogenous on the scale of tens of centimeters within the major lithology (see core photos, Munsell soil color, and spectrophotometry results in Clemens et al., 2016b, c, d), it is reasonable to compare to smear slides (discrete toothpick samples) directly. While the similarity in the trends is apparent from the downcore plots (Figs. 4, 5, and 6), the cross plots highlight the large variation in the clay mineral and total lithogenic fraction estimates. For a given NGR value, the clay values can vary by up to ±25 % with an average absolute value of the residual of 8 % (Fig. 7d–f). These relationships show that in sediments with a wide range in clay mineral content (e.g., those with significant microfossil or silt/sand fractions), smear slide estimates can show downcore trends consistent with NGR measurements with a higher goodness of fit, despite the wide range in uncertainty in estimating clay by smear slide.
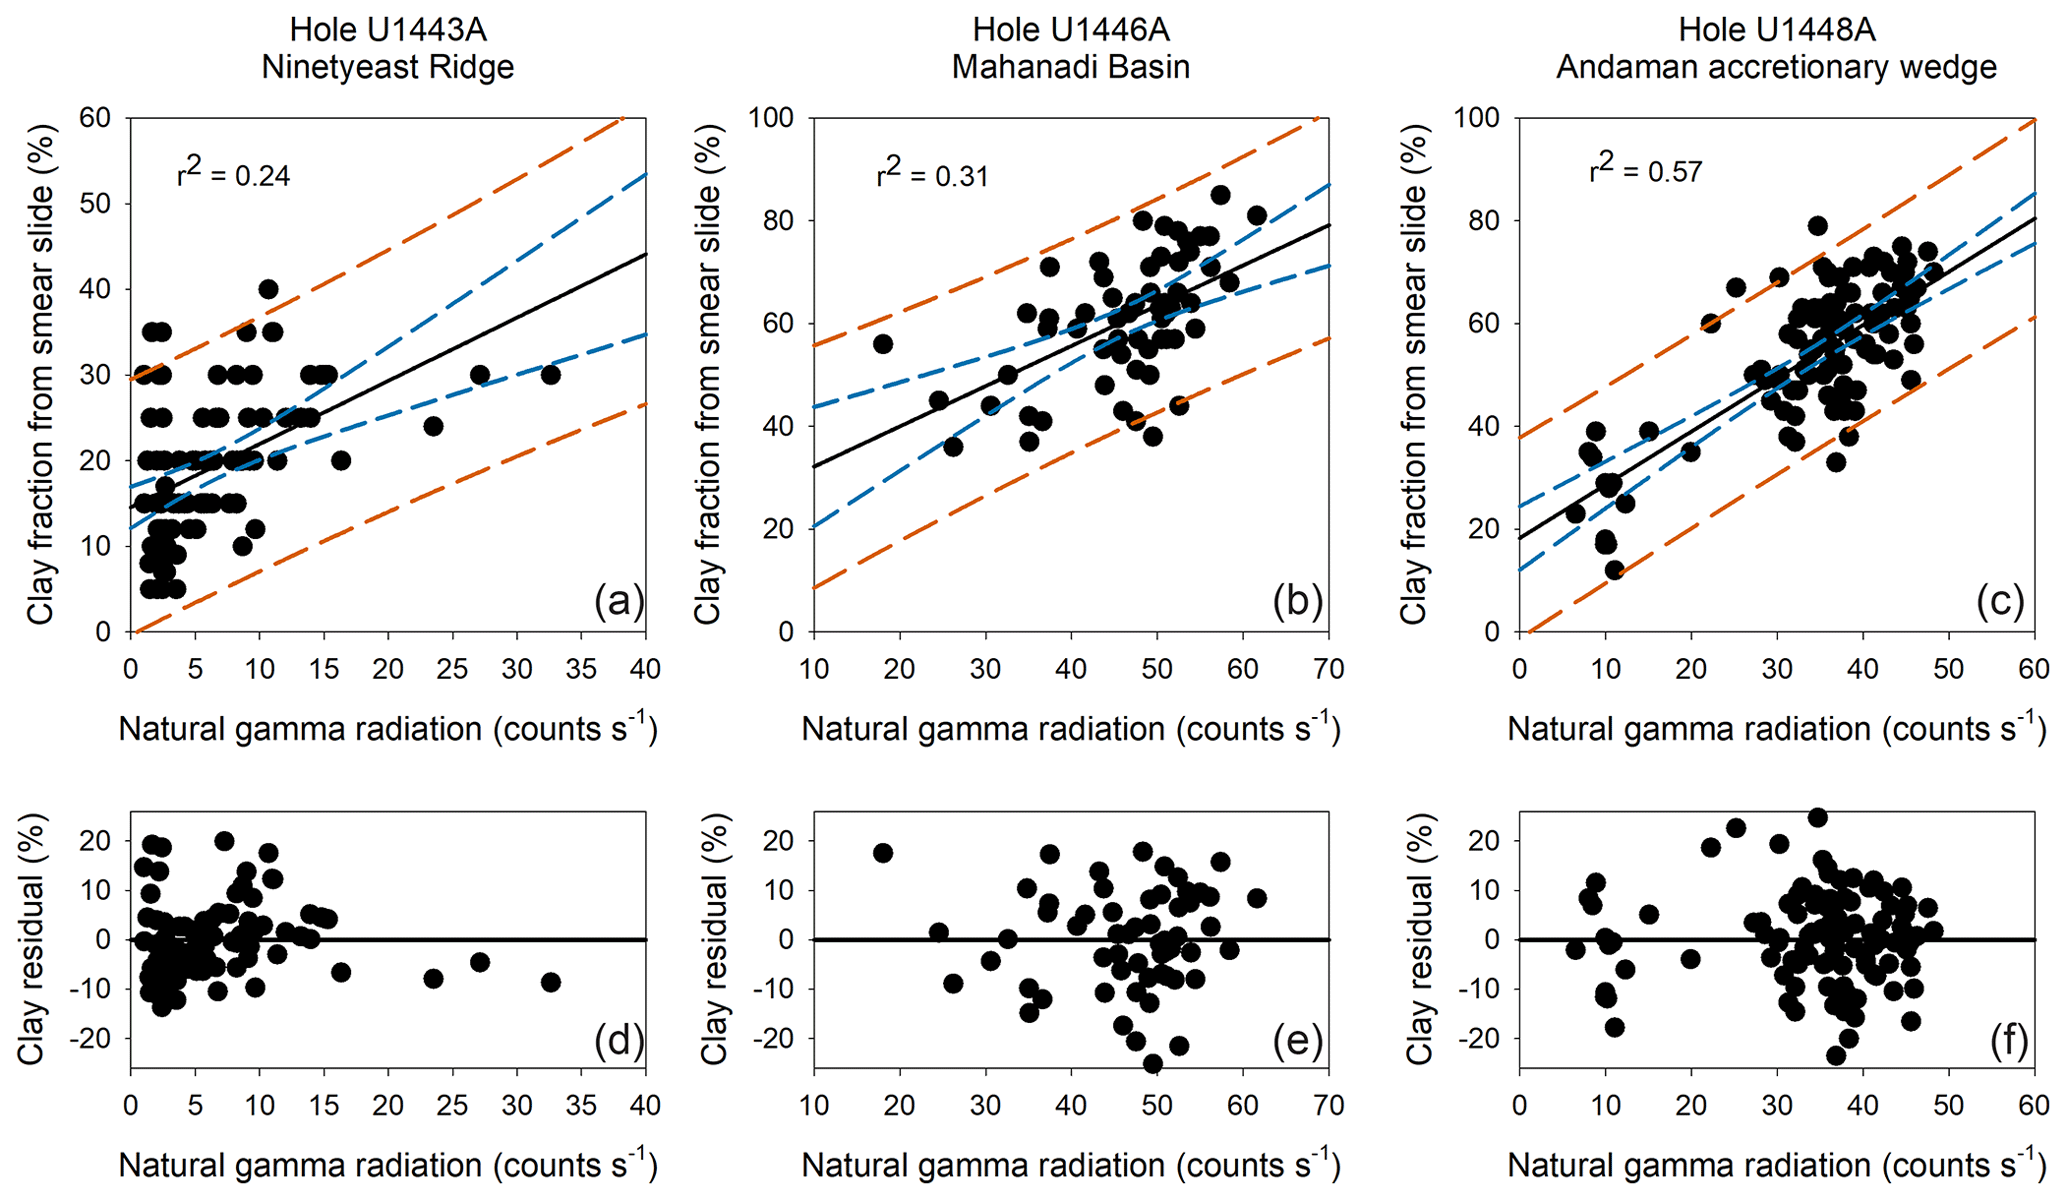
Figure 7Cross plots of natural gamma radiation vs. estimates of clay minerals from smear slide, where the measurements are within 5 cm of each other in the core. (a) IODP Site U1443, (b) IODP Site U1446, and (c) IODP Site U1448. Grey solid lines are best-fit linear regression, teal dashed lines are 95 % confidence intervals, and red dashed lines are 95 % prediction intervals. Panels (d), (e), and (f) show the residuals around the best-fit line for Sites U1443, U1446, and U1448, respectively.
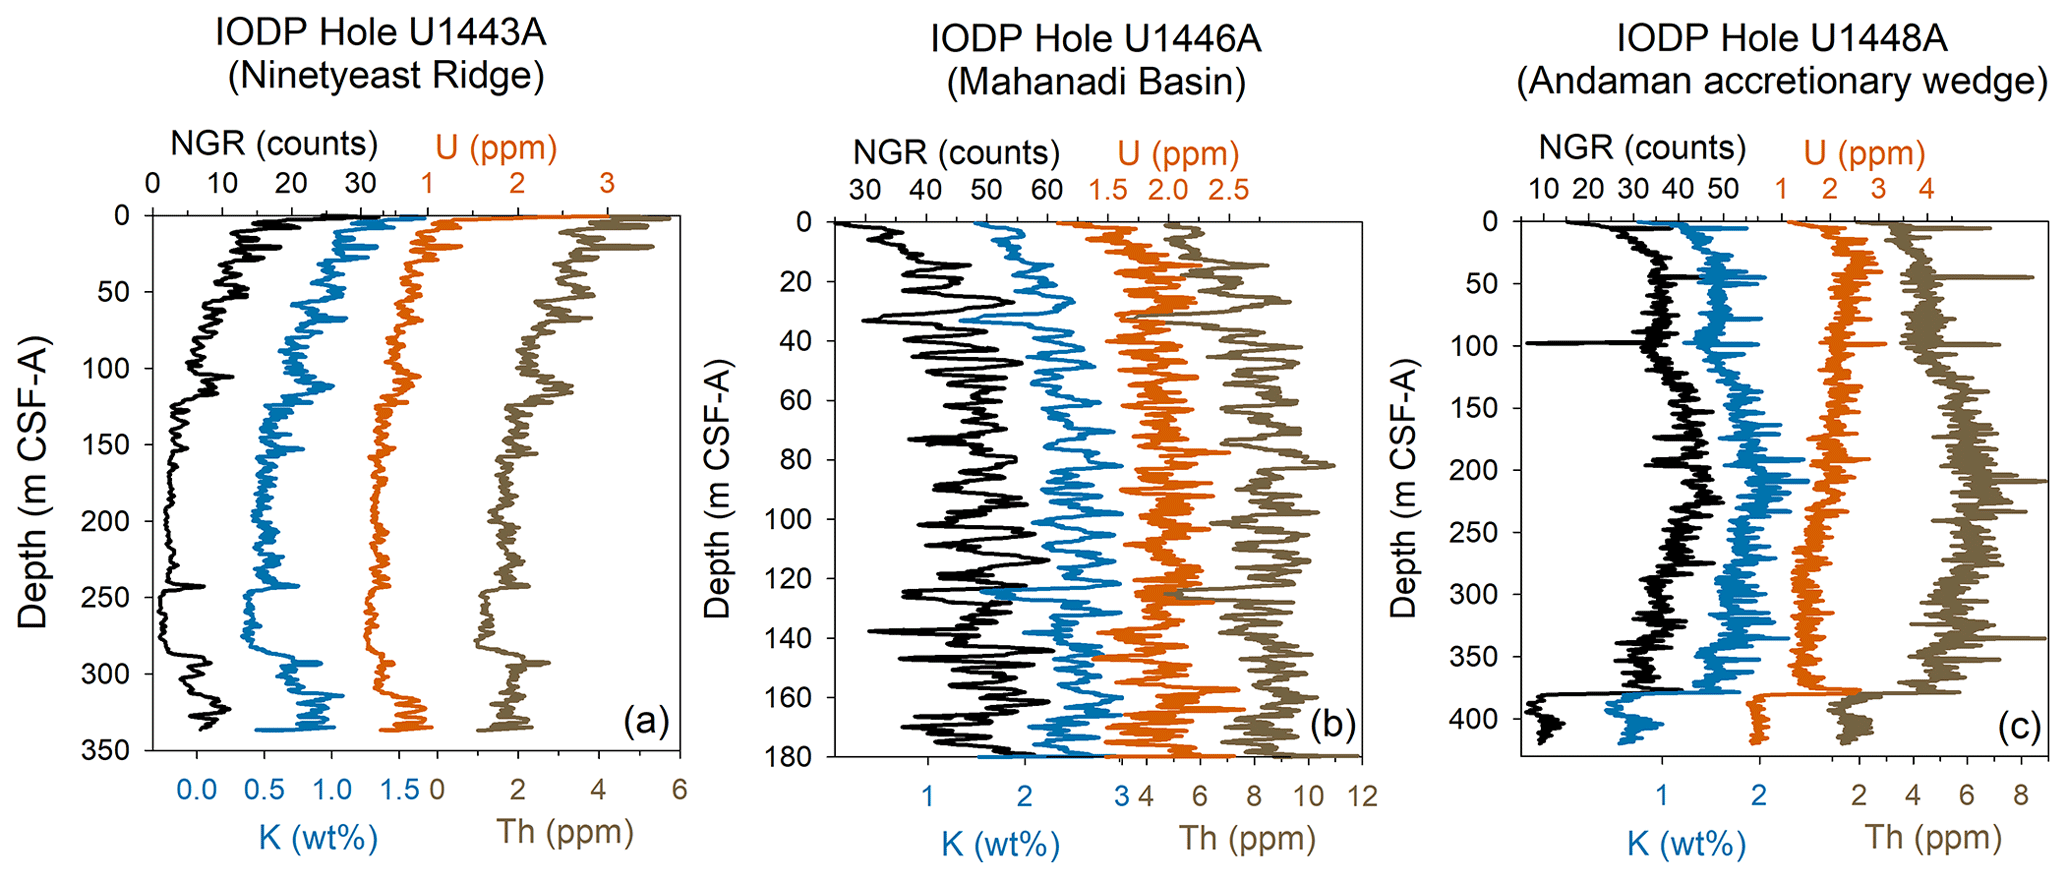
Figure 8Downcore plots of natural gamma radiation (NGR) and K, U, and Th contents based on NGR spectra (De Vleeschouwer, 2017) from IODP Holes (a) U1443A, (b) U1446A, and (c) U1448A.
At these IODP Expedition 353 sites, downcore trends in bulk NGR are largely similar to the trends in the interpreted K, U, and Th (with the exception of U at IODP Site U1448) (Fig. 8). In these hemipelagic sediments, NGR and each of the radiogenic components appear to be representing the relative mixing of lithogenic grains (primarily clay) with biogenic carbonate grains (minimal NGR). Overall, the weak but noticeable correlation of smear slide estimates with NGR gives confidence in the utility of using smear slide estimates for clay and other lithogenic component content to provide general trends in composition in sediments with varying terrigenous and biogenic composition.
4.3 Underestimation of clay content and overestimation of carbonate
Except for Site U1443, we see a consistent overestimation of carbonate content in smear slide estimates across multiple sites in the Bay of Bengal and Andaman Sea, based on the downcore trends and the average CaCO3 % values from coulometer and carbonate content by smear slides at each site (Fig. 9). We observe this consistent overestimation in carbonate at Sites U1446 and U1448 and also expand this comparison to other IODP 353 sites as well as sites from Indian National Gas Hydrate Program 01 (NGHP-01) (Collett et al., 2015; Johnson et al., 2014). Although the coulometer and smear slide samples were not collected from the exact same depths, the similar downcore trends suggest that there is no consistent bias due to sampling and that the largely homogeneous lithologies on centimeter/decimeter scales at each core mean exact sample matching is not essential. We also observe a similar overestimation in smear slide carbonate compared to CaCO3 measured by coulometer/elemental analysis at other sites within the Andaman accretionary wedge (IODP Site U1447 and NGHP-01 Site 17) (Clemens et al., 2016f; Collett et al., 2015; Johnson et al., 2014) (Fig. 9). Other Mahanadi Basin sites, IODP Site U1445 and NGHP01 Site 19, similarly show an overestimation in carbonate minerals from smear slides (Clemens et al., 2016g; Collett et al., 2015; Johnson et al., 2014). Although we are comparing percent area estimates to weight percent estimates, the density of calcite (2.7102 g cm−3) (DeFoe and Compton, 1925) is close to the grain densities at IODP 353 sites (average grain density at each site ranges from 2.716 to 2.756 g cm−3) (Clemens et al., 2016b, c, d). The uncertainties in the smear slide percent estimates are much greater than the difference in making volume percent (smear slide) to weight percent (coulometer or CHNS) comparisons.
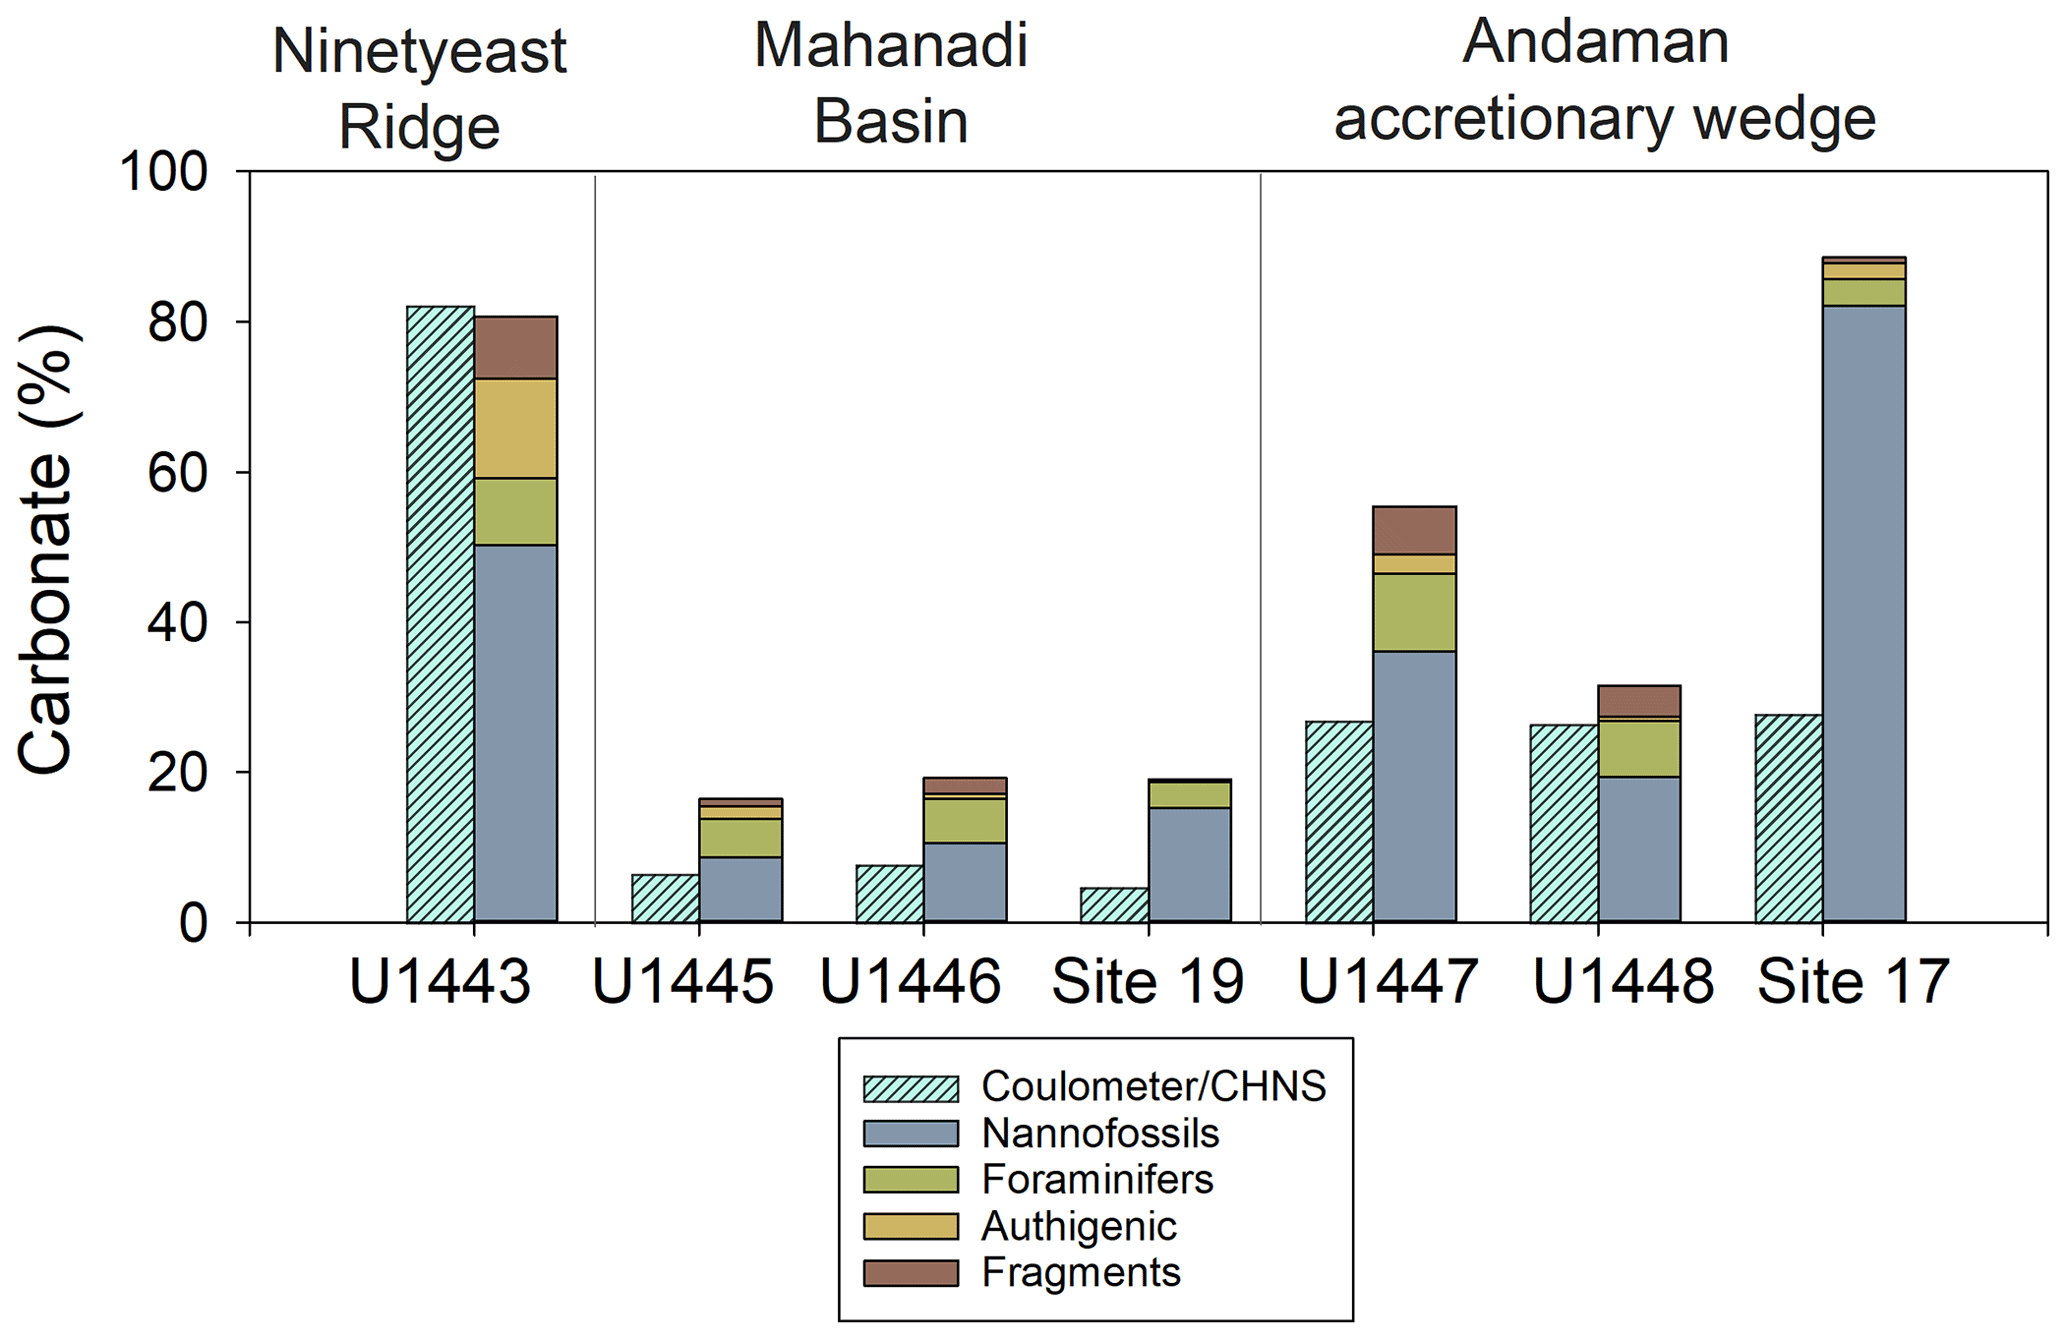
Figure 9Comparison of total carbonate minerals (nannofossils, foraminifers, authigenic, shell fragments) by smear slide estimation to average CaCO3 measured by carbonate coulometry for (a) IODP Expedition 353 (Clemens et al., 2016b, c, d, f, g) and NGHP Expedition 01 (Collett et al., 2015; Johnson et al., 2014).
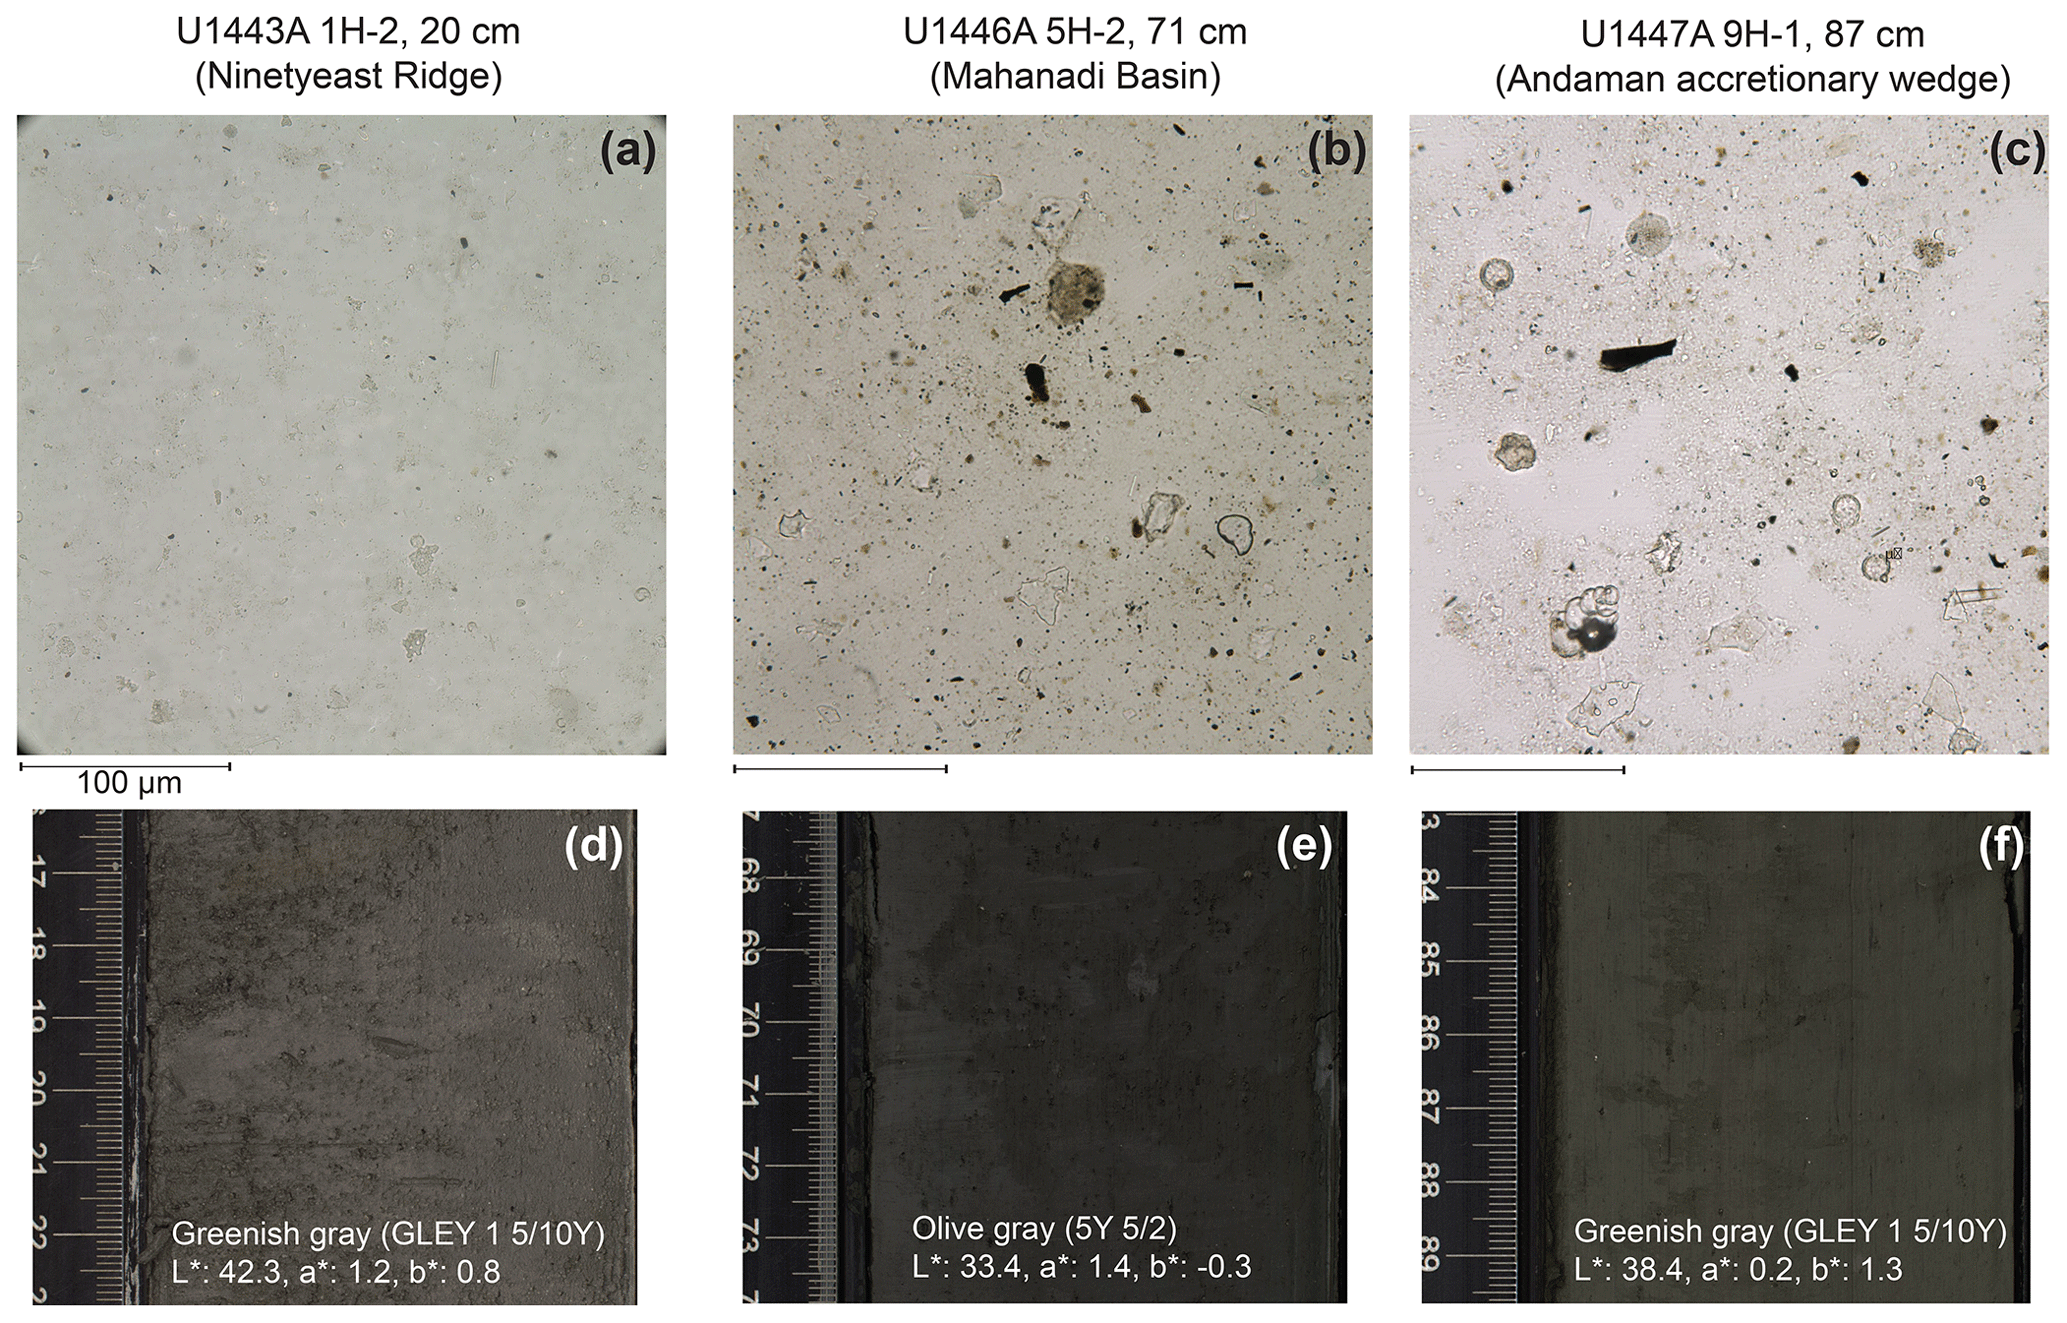
Figure 10Smear slides from IODP Sites U1443 (a), U1446 (b), and U1447 (c) under plane-polarized light. Slides from Andaman Sea sites generally appeared lighter and more dominated by carbonate minerals compared to Mahanadi Basin sites. There are slight differences in sediment color, including Munsell soil color, lightness (L*), and hue-chroma coordinates (a* and b*) (d, e, f). Data from Clemens et al. (2016b, c, d).
The fine fraction appeared lighter in the Mahanadi Basin and, to an even greater extent, Andaman Sea sites (Fig. 10). Based on our calibration based on training slides and Site U1443 samples, this appeared as an apparent underestimation of the clay fraction. We suggest that the discrepancy between sites is driven by differences in sediment color and/or differences in clay mineral properties between these locations. Although visually estimating the abundance of distinct mineral grains can be relatively accurate and repeatable (Allen, 1956; Griffiths and Rosenfeld, 1954), estimation of clay mineral or size fraction content is generally more difficult due to grain sizes that are too small to be identified individually. Thus, clay mineral percent estimates are made from observation of a diffuse background (grains unable to be individually focused) or from aggregates (e.g., clumps of formation unable to be disaggregated, fecal pellets), which are strongly influenced by the material color. We hypothesize that it is more difficult to estimate the clay content based on the varying fine-grained organic matter, iron oxides, and iron sulfide content within marine sediments that can create a wide range in color of the clay-sized fraction (Marsaglia et al., 2013, 2015). We calibrated our estimations under 60× magnification based on training smear slides of known clay mineral and carbonate content (Marsaglia et al., 2013); however, in our IODP 353 sites we applied these approximations to sediments from different locations in the northern Indian Ocean that may have different pigmentation properties when observed under the microscope.
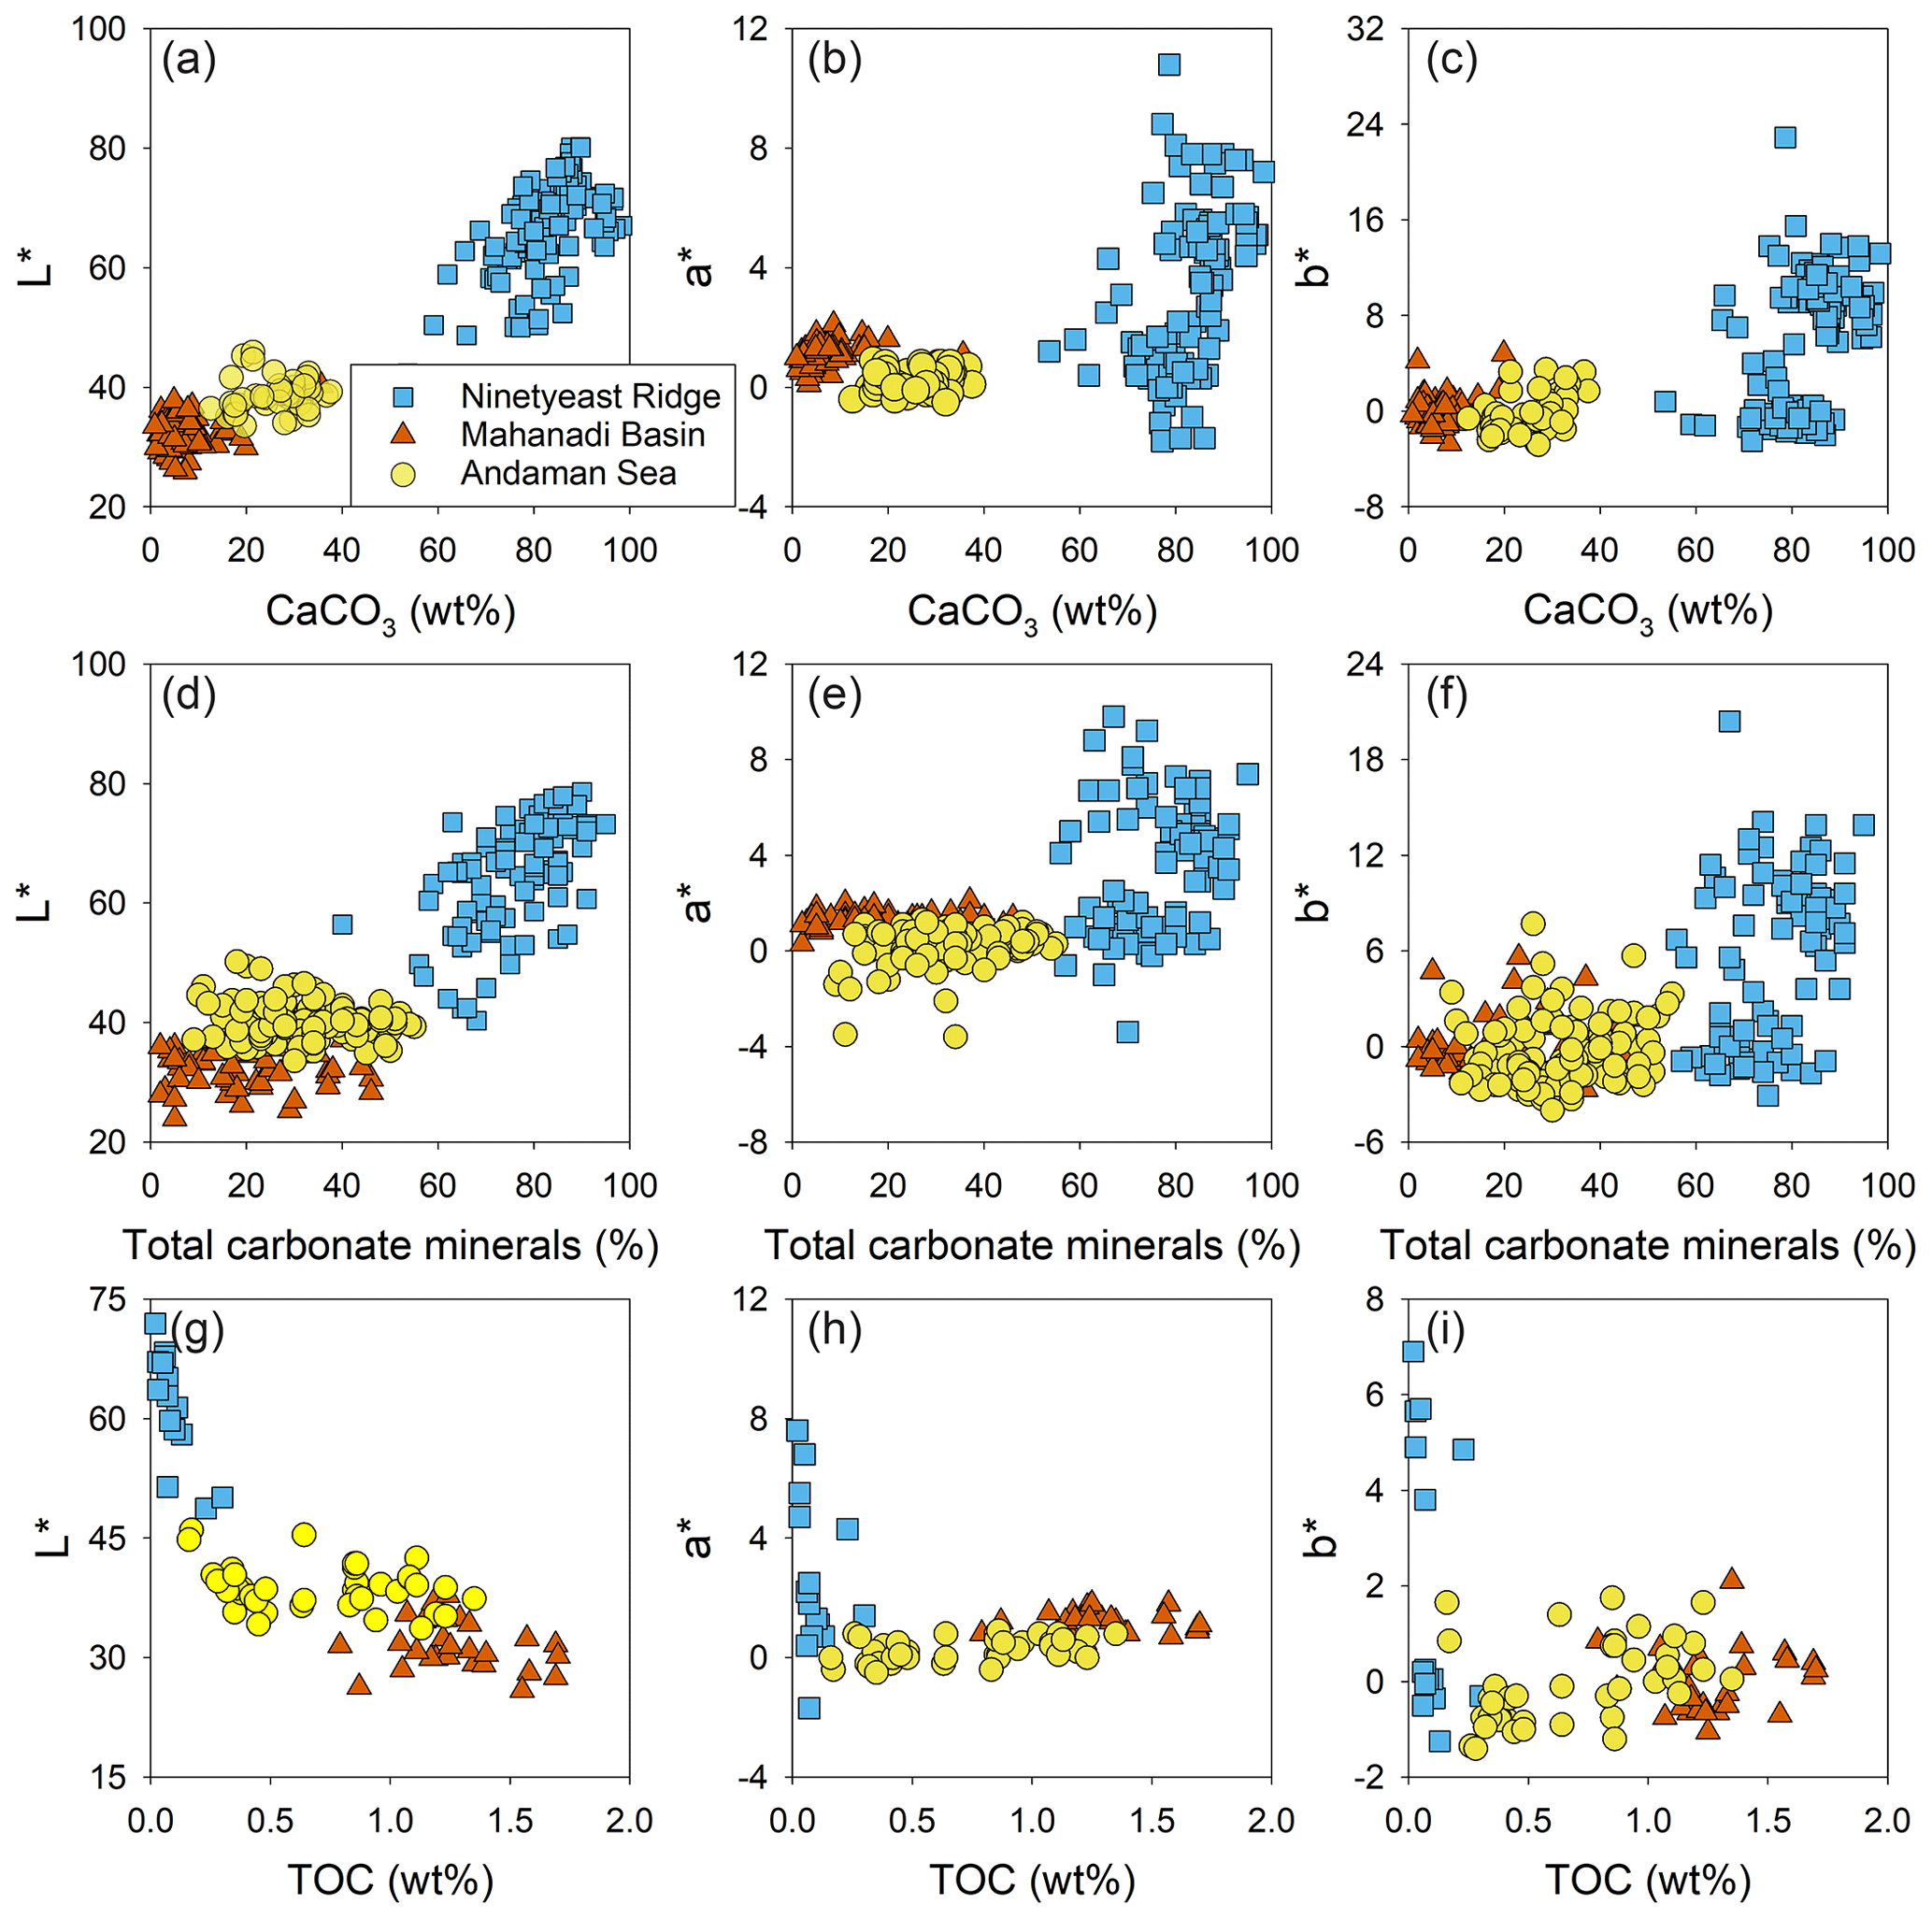
Figure 11Average sediment lightness (L*) and chromaticity variables (a* and b*) vs. average CaCO3 % (a–c), smear slide total carbonate minerals (d–f) and total organic carbon (TOC) % (g–i) from IODP Expedition 353 sites: Ninetyeast Ridge, I. (blue squares) IODP Site U1443, Andaman Sea (IODP Site U1448), and Mahanadi Basin (purple circles) IODP Site U1446. Data from Clemens et al. (2016b, c, d).
Each of the three sites we discuss have distinctly different sediment colors on the macro scale based on reflection scanning colorimetry (Figs. 10 and 11). Between Ninetyeast Ridge, the Mahanadi Basin, and the Andaman Sea, sediment lightness (L* from color reflectance scanning) generally increases with CaCO3 content and decreases with total organic carbon content (Fig. 11) (see Clemens et al., 2016b, c, d), which is similar to observations from other ocean drilling expeditions (e.g., Blum, 1997; Expedition 320/321 Scientists, 2010; Shipboard Scientific Party, 1996b; 2001). Similarly, L* increases with total carbonate minerals estimated from smear slides (Fig. 11), which also makes sense given that the relative darkness/lightness of the clay-sized material in the smear slides was a major factor in estimating clay mineral content. In addition to L*, there are differences in red to green (a*) and blue to yellow (b*) ranges between sites that may represent color variations driven by compositional factors other than carbonate content. Between sites and within individual sites, variation in organic matter, iron oxides, etc., can vary downcore, which can lead to shifts in the clay estimations (see Fig. 3f). The presence of larger grains and aggregates may also influence the clay estimates by making it difficult to focus on the fine-grained fraction. In addition, the high birefringence of silt and sand-sized calcite (which is likely underrepresented on the smear slide due to its size) under cross-polarized light makes these grains easy to see and may draw the eye of observers preferentially to these grains relative to the darker and more dispersed clay. However, the nannofossil component is clearly driving the overestimation of carbonate at Expedition 353 sites (Fig. 9), even though these smaller microfossils have lower birefringence than the larger microfossils and calcareous fragments.
This overestimation in carbonate content is highest in the Andaman Sea, especially at Site U1447 and NGHP-01 Site 17 (Fig. 9). IODP Site U1447 and NGHP-01 Site 17 in the Andaman accretionary wedge are rich in smectite-group clays (14 % to 83 % smectite, 19 % to 47 % illite of the < 2 µm fraction) (Lee et al., 2020; Phillips et al., 2014b). In contrast, IODP Sites U1445 and U1446 in the Mahanadi Basin are located near NGHP-01 Sites 18 and 19, which are more illite-rich (9 % to 28 % smectite, 29 % to 54 % illite of the < 2 µm fraction) (Phillips et al., 2014b). Because of the expanding nature of smectite-group clays and smaller grain size, smectite-group clays may disperse in water differently than other common clay minerals (i.e., illite, kaolinite, chlorite) (Gibbs, 1977; Thomas and Murray, 1989) during smear slide preparation and may be more prone to underestimation. Segregation of montmorillonite due to settling and flocculation during slide preparation has been observed to cause underestimation (by up to 250 %) of montmorillonite during X-ray diffraction analyses (Gibbs, 1965; Stokke and Carson, 1973). Due to its smaller size, montmorillonite has a settling velocity ∼ 100× slower than illite or kaolinite (Gibbs, 1965), which may cause smectite-group clay minerals to accumulate at the top and edges of the slide during preparation (Stokke and Carson, 1973), making it appear less abundant under the microscope.
We suggest that smear slide estimation alone may overestimate the carbonate content and cause a misclassification of calcareous-rich clays as calcareous oozes. Integration of CaCO3 measurements by coulometry or elemental analysis may provide a more robust sediment classification in carbonate-rich clay sediments, especially on expeditions with shipboard geochemical measurement of CaCO3 alongside lithostratigraphic description, such as is standard on IODP expeditions. In particular, Marsaglia et al. (2013, 2015) suggest collecting smear slide and CaCO3 samples from the same depths and using these to calibrate the smear slide estimates during shipboard operations. For example, ODP Legs 154 and 162 calibrated smear slide estimates using coulometer and sediment color data (Shipboard Scientific Party, 1995b, 1996c). This approach allows for a close match between reported smear slide and coulometer percentages, such as those observed during IODP Expedition 361 (Hall et al., 2017).
During IODP Expedition 353, we did not make these corrections to smear slide estimates in real time but did use CaCO3 to refine the sediment names, similarly to what was done on IODP Expedition 339 and ODP Leg 107 (Expedition 339 Scientists, 2013b; Shipboard Scientific Party, 1987). On IODP Expedition 353, core recovery was high (4.2 km of core; 1165 smear slides) and %CaCO3 data often lagged sediment descriptions by 1–2 d. This time constraint did not allow for re-describing or calibrating slides after initial description. Our carbonate mineral estimates from smear slides would be improved with calibration with coulometer CaCO3 measurements at each basin to avoid the overestimation described above. We recommend that expedition scientists plan core flow at the start of the expedition to coordinate core description and coulometer measurements, depending on expedition-specific objectives and core recovery.
Overall, we show that the trends in percentage estimates from smear slide descriptions broadly match those from geochemical (CaCO3 %) and physical properties (NGR) at IODP 353 sites. Underestimation of the clay fraction and overestimation of the carbonate abundance appear to be the biggest sources of error in these trends and sometimes misclassification of the sediment. We suggest that where possible lithostratigraphic description incorporate quantitative measurements of CaCO3 abundance when classifying sediment types and to calibrate percentages of calcareous components under smear slides as described by Marsaglia et al. (2013, 2015). This comparison may require creative planning for the flow and timing of smear slide sampling and description, especially on high-recovery palaeoceanographic expeditions.
The similarity between downhole trends in smear slide estimates and measured CaCO3 and NGR values gives confidence that microscopic descriptions can be used to track major variation or cyclicity in marine sediments. Our smear slide estimates are consistent with major paleoenvironmental/palaeoceanographic changes characterized by quantitative approaches. We suggest that scientists on future scientific drilling expeditions can gain early insight into sediment variations related to expedition missions by plotting smear slide percent estimates rather than just lithologic units or abundance categories. We are not advocating that smear slides can replace the more quantitative analyses but that these smear slide abundances can provide critical and complementary information on specific sedimentary grain types. While we focused on comparisons between smear slide observations and quantitative measurements, these comparisons give confidence in the smear slide technique to characterize trends in a variety of mineral and microfossil abundances, many of which are not easily quantified through other analyses.
IODP expeditions have archived tables of smear slide percent estimates available in the proceedings, many of which have not been interpreted in terms of downcore trends. These data sets examined in detail may be useful for providing new interpretations or pilot data to guide new analyses of archived cores. Visual estimation has long been an effective technique for characterizing sediments, and smear slide analysts can have confidence in the utility of their estimations to track trends in major lithology, even if the absolute values are somewhat inaccurate. The capability of smear slide petrography to capture these trends can be enhanced by cross-calibration at shift cross-overs, using training slide sets and limiting the number of smear slide observers during an expedition, which reduces the effect of observer bias.
All primary data in this paper (smear slide estimates, coulometer CaCO3, NGR, and photomicrographs) generated during shipboard operations of IODP Expedition 353 are available online as part of the IODP LIMS Online Report Portal: https://web.iodp.tamu.edu/LORE/ (International Ocean Discovery Program JOIDES Resolution Science Operator, 2021). K, U, and Th contents quantified from NGR spectra are available in the EarthChem data library (https://doi.org/10.1594/IEDA/100668, De Vleeschouwer, 2017).
All IODP Expedition 353 cores, including sites U1443, U1446, and U1448, are archived at the IODP repository at the Kochi Core Center (http://www.kochi-core.jp/en/iodp-curation/index.html, last access: 6 December 2021).
KL and SCP contributed equally to conceptualization, investigation, formal analysis, and visualization. SCP prepared the original draft, and KL contributed significantly to review and editing.
The contact author has declared that neither they nor their co-author have any competing interests.
Any use of trade, firm, or product name is for descriptive purposes only and does not imply endorsement by the US government.
Publisher’s note: Copernicus Publications remains neutral with regard to jurisdictional claims in published maps and institutional affiliations.
We thank the shipboard scientific party from IODP Expedition 353 as well as the captain, crew, and technical staff of the JOIDES Resolution for the initial processing and analysis of cores. We thank Sunghan Kim for contributing to smear slide analysis at Site U1443. We thank reviewers Kathleen Marsaglia and Kitty Milliken for the very constructive comments that greatly improved this paper. We also thank Marci Robinson for additional helpful comments that improved this paper.
This paper was edited by Tomoaki Morishita and reviewed by Kathleen Marsaglia and Kitty Milliken.
Allen, J. A.: Estimation of percentages in thin sections; considerations of visual psychology, J. Sediment. Res., 26, 160–161, https://doi.org/10.1306/74D704F7-2B21-11D7-8648000102C1865D, 1956.
Barnet, J. S. K., Harper, D. T., LeVay, L. J., Edgar, K. M., Henehan, M. J., Babila, T. L., Ullmann, C. V., Leng, M. J., Kroon, D., Zachos, J. C., and Littler, K.: Coupled evolution of temperature and carbonate chemistry during the Paleocene–Eocene; new trace element records from the low latitude Indian Ocean, Earth Planet. Sc. Lett., 545, 116414, https://doi.org/10.1016/j.epsl.2020.116414, 2020.
Blum, P.: Physical properties handbook: a guide to the shipboard measurement of physical properties of deep-sea cores, ODP Tech. Note, 26, https://doi.org/10.2973/odp.tn.26.1997, 1997.
Carozzi, A. V.: Carbonate rock depositional models: A microfacies approach, Prentice Hall, Hoboken, New Jersey, USA, 604 pp., 1988.
Carozzi, A. V.: Sedimentary Petrography, Prentice Hall, Englewood Cliffs, USA, 263 pp., 1993.
Clemens, S. C., Kuhnt, W., LeVay, L. J., Anand, P., Ando, T., Bartol, M., Bolton, C. T., Ding, X., Gariboldi, K., Giosan, L., Hathorne, E. C., Huang, Y., Jaiswal, P., Kim, S., Kirkpatrick, J. B., Littler, K., Marino, G., Martinez, P., Naik, D., Peketi, A., Phillips, S. C., Robinson, M. M., Romero, O. E., Sagar, N., Taladay, K. B., Taylor, S. N., Thirumalai, K., Uramoto, G., Usui, Y., Wang, J., Yamamoto, M., and Zhou, L.: Expedition 353 summary, in: Indian Monsoon Rainfall, edited by: Clemens, S. C., Kuhnt, W., LeVay, L. J., and the Expedition 353 Scientists, Proceedings of the International Ocean Discovery Program, International Ocean Discovery Program, College Station, TX, USA, 353, https://doi.org/10.14379/iodp.proc.353.101.2016, 2016a.
Clemens, S. C., Kuhnt, W., LeVay, L. J., Anand, P., Ando, T., Bartol, M., Bolton, C. T., Ding, X., Gariboldi, K., Giosan, L., Hathorne, E. C., Huang, Y., Jaiswal, P., Kim, S., Kirkpatrick, J. B., Littler, K., Marino, G., Martinez, P., Naik, D., Peketi, A., Phillips, S. C., Robinson, M. M., Romero, O. E., Sagar, N., Taladay, K. B., Taylor, S. N., Thirumalai, K., Uramoto, G., Usui, Y., Wang, J., Yamamoto, M., and Zhou, L.: Site U1443, in: Indian Monsoon Rainfall, edited by: Clemens, S. C., Kuhnt, W., LeVay, L. J., and the Expedition 353 Scientists, Proceedings of the International Ocean Discovery Program, International Ocean Discovery Program, College Station, TX, USA, 353, https://doi.org/10.14379/iodp.proc.353.103.2016, 2016b.
Clemens, S. C., Kuhnt, W., LeVay, L. J., Anand, P., Ando, T., Bartol, M., Bolton, C. T., Ding, X., Gariboldi, K., Giosan, L., Hathorne, E. C., Huang, Y., Jaiswal, P., Kim, S., Kirkpatrick, J. B., Littler, K., Marino, G., Martinez, P., Naik, D., Peketi, A., Phillips, S. C., Robinson, M. M., Romero, O. E., Sagar, N., Taladay, K. B., Taylor, S. N., Thirumalai, K., Uramoto, G., Usui, Y., Wang, J., Yamamoto, M., and Zhou, L.: Site U1446, in: Indian Monsoon Rainfall, edited by: Clemens, S. C., Kuhnt, W., LeVay, L. J., and the Expedition 353 Scientists, Proceedings of the International Ocean Discovery Program, International Ocean Discovery Program, College Station, TX, USA, 353, https://doi.org/10.14379/iodp.proc.353.106.2016, 2016c.
Clemens, S.C., Kuhnt, W., LeVay, L.J., Anand, P., Ando, T., Bartol, M., Bolton, C.T., Ding, X., Gariboldi, K., Giosan, L., Hathorne, E.C., Huang, Y., Jaiswal, P., Kim, S., Kirkpatrick, J.B., Littler, K., Marino, G., Martinez, P., Naik, D., Peketi, A., Phillips, S.C., Robinson, M.M., Romero, O.E., Sagar, N., Taladay, K.B., Taylor, S.N., Thirumalai, K., Uramoto, G., Usui, Y., Wang, J., Yamamoto, M., and Zhou, L.: Site U1448, in: Indian Monsoon Rainfall, edited by: Clemens, S. C., Kuhnt, W., LeVay, L. J., and the Expedition 353 Scientists, Proceedings of the International Ocean Discovery Program, International Ocean Discovery Program, College Station, TX, USA, 353, https://doi.org/10.14379/iodp.proc.353.108.2016, 2016d.
Clemens, S. C., Kuhnt, W., LeVay, L. J., Anand, P., Ando, T., Bartol, M., Bolton, C. T., Ding, X., Gariboldi, K., Giosan, L., Hathorne, E. C., Huang, Y., Jaiswal, P., Kim, S., Kirkpatrick, J. B., Littler, K., Marino, G., Martinez, P., Naik, D., Peketi, A., Phillips, S. C., Robinson, M. M., Romero, O. E., Sagar, N., Taladay, K. B., Taylor, S. N., Thirumalai, K., Uramoto, G., Usui, Y., Wang, J., Yamamoto, M., and Zhou, L.: Expedition 353 methods, in: Indian Monsoon Rainfall, edited by: Clemens, S. C., Kuhnt, W., LeVay, L. J., and the Expedition 353 Scientists, Proceedings of the International Ocean Discovery Program, International Ocean Discovery Program, College Station, TX, USA, 353, https://doi.org/10.14379/iodp.proc.353.102.2016, 2016e.
Clemens, S. C., Kuhnt, W., LeVay, L. J., Anand, P., Ando, T., Bartol, M., Bolton, C. T., Ding, X., Gariboldi, K., Giosan, L., Hathorne, E. C., Huang, Y., Jaiswal, P., Kim, S., Kirkpatrick, J. B., Littler, K., Marino, G., Martinez, P., Naik, D., Peketi, A., Phillips, S. C., Robinson, M. M., Romero, O. E., Sagar, N., Taladay, K. B., Taylor, S. N., Thirumalai, K., Uramoto, G., Usui, Y., Wang, J., Yamamoto, M., and Zhou, L.: Site U1447, in: Indian Monsoon Rainfall, edited by: Clemens, S. C., Kuhnt, W., LeVay, L. J., and the Expedition 353 Scientists, Proceedings of the International Ocean Discovery Program, International Ocean Discovery Program, College Station, TX, USA, 353, https://doi.org/10.14379/iodp.proc.353.107.2016, 2016f.
Clemens, S. C., Kuhnt, W., LeVay, L. J., Anand, P., Ando, T., Bartol, M., Bolton, C. T., Ding, X., Gariboldi, K., Giosan, L., Hathorne, E. C., Huang, Y., Jaiswal, P., Kim, S., Kirkpatrick, J. B., Littler, K., Marino, G., Martinez, P., Naik, D., Peketi, A., Phillips, S. C., Robinson, M. M., Romero, O. E., Sagar, N., Taladay, K. B., Taylor, S. N., Thirumalai, K., Uramoto, G., Usui, Y., Wang, J., Yamamoto, M., and Zhou, L.: Site U1445, in: Indian Monsoon Rainfall, edited by: Clemens, S. C., Kuhnt, W., LeVay, L. J., and the Expedition 353 Scientists, Proceedings of the International Ocean Discovery Program, International Ocean Discovery Program, College Station, TX, USA, 353, https://doi.org/10.14379/iodp.proc.353.105.2016, 2016g.
Collett, T., Riedel, M., Cochran, J., Boswell, R., Presley, J., Kumar, P., Sathe, A., Sethi, A., Lall, M., and the NGHP Expedition Scientists: Indian National Gas Hydrate Program Expedition 01 report: U.S. Geological Survey Scientific Investigations Report 2012–5054, 1442 pp., https://doi.org/10.3133/sir20125054, 2015.
Croudace, I. W., Rindby, A., and Rothwell, R. G.: ITRAX: description and evaluation of a new multi-function X-ray core scanner, in: New Techniques in Sediment Core Analysis, edited by: Rothwell, R. G., Geological Society of London Special Publications, 267, 51–63, https://doi.org/10.1144/GSL.SP.2006.267.01.04, 2006.
Da Silva, R., Mazumdar, A., Mapder, T., Peketi, A., Joshi, R. K., Shaji, A., Mahalakshmi, P., Sawant, B., Naik, B. G., Carvalho, M. A., and Molletti, S. K: Salinity stratification controlled productivity variation over 300 ky in the Bay of Bengal, Sci. Rep., 7, 14439, https://doi.org/10.1038/s41598-017-14781-3, 2017.
Davies, T. A., Musich, L. F., and Woodbury, P. B.: Automated classification of deep-sea sediments, J. Sediment. Petrol., 47, 650–656, https://doi.org/10.1306/212F720C-2B24-11D7-8648000102C1865D, 1977.
Dean, W. E., Leinen, M., and Stow, D. W.: Classification of deep-sea, fine-grained sediments, J. Sediment. Petrol., 55, 250–256, https://doi.org/10.1306/212F868E-2B24-11D7-8648000102C1865D, 1985.
DeFoe, O. K. and Compton, A. H.: The density of rock salt and calcite, Phys. Rev., 25, 618–620, https://doi.org/10.1103/PhysRev.25.618, 1925.
De Vleeschouwer, D.: Natural Gamma Radiation-derived K, U and Th contents of marine sediments obtained during IODP Expeditions with DV JOIDES Resolution, Version 1.0, Interdisciplinary Earth Data Alliance (IEDA) [data set], https://doi.org/10.1594/IEDA/100668, 2017.
De Vleeschouwer, D., Dunlea, A. G., Auer, G., Anderson, C. H., Brumsack, H., de Loach, A., Gurnis, M. C., Huh, Y., Ishiwa, T., Jang, K., Kominz, M. A., März, C., Schnetger, B., Murray, R. W., Pälike, H., and Expedition 356 shipboard scientists: Quantifying K, U, and Th contents of marine sediments using shipboard natural gamma radiation spectra measured on DV JOIDES Resolution, Geochem. Geophy. Geosy., 18, 1053–1064, https://doi.org/10.1002/2016GC006715, 2017.
Drake, M. K., Aiello, I. W., and Ravelo, A. C.: New method for the quantitative analysis of smear slides in pelagic and hemi-pelagic sediments of the Bering Sea, American Geophysical Union, Fall Meeting 2014, 18 December 2014, San Francisco, California, USA, abstract PP43B-1460, 2014.
Dunlea, A. G., Murray, R. W., Harris, R. N., Vasiliev, M. A., Evans, H., Spivack, A. J., and D'Hondt, S.: Assessment and Use of NGR Instrumentation on the JOIDES Resolution to Quantify U, Th, and K Concentrations in Marine Sediment, Sci. Dril., 15, 57–63, https://doi.org/10.2204/iodp.sd.15.05.2013, 2013.
Engleman, E. E., Jackson, L. L., and Norton, D. R.: Determination of carbonate carbon in geological materials by coulometric titration, Chem. Geol., 53, 125–128, https://doi.org/10.1016/0009-2541(85)90025-7, 1985.
Expedition 320/321 Scientists: Site U1333, in: Proc. IODP, 320/321: Tokyo, edited by: Pälike, H., Lyle, M., Nishi, H., Raffi, I., Gamage, K., Klaus, A., and the Expedition 320/321 Scientists, Integrated Ocean Drilling Program Management International, Inc., https://doi.org/10.2204/iodp.proc.320321.105.2010, 2010.
Expedition 324 Scientists: Site U1346, in: Proc. IODP, 324: Tokyo, edited by: Sager, W. W., Sano, T., Geldmacher, J., and the Expedition 324 Scientists Scientists, Integrated Ocean Drilling Program Management International, Inc., https://doi.org/10.2204/iodp.proc.324.103.2010, 2010.
Expedition 330 Scientists: Methods, in: Proc. IODP, 330: Tokyo, edited by: Koppers, A. A. P., Yamazaki, T., Geldmacher, J., and the Expedition 330 Scientists, Integrated Ocean Drilling Program Management International, Inc., https://doi.org/10.2204/iodp.proc.330.102.2012, 2012.
Expedition 337 Scientists: Methods, in: Proc. IODP, 337: Tokyo, edited by: Inagaki, F., Hinrichs, K.-U., Kubo, Y., and the Expedition 337 Scientists, Integrated Ocean Drilling Program Management International, Inc., https://doi.org/10.2204/iodp.proc.337.102.2013, 2013.
Expedition 339 Scientists: Site U1385, in: Proc. IODP, 339: Tokyo, edited by: Stow, D. A. V., Hernández-Molina, F. J., Alvarez Zarikian, C. A., and the Expedition 339 Scientists, Integrated Ocean Drilling Program Management International, Inc., https://doi.org/10.2204/iodp.proc.339.103.2013, 2013a.
Expedition 339 Scientists: Methods, in: Proc. IODP, 339: Tokyo, edited by: Stow, D. A. V., Hernández-Molina, F. J., Alvarez Zarikian, C. A., and the Expedition 339 Scientists, Integrated Ocean Drilling Program Management International, Inc., https://doi.org/10.2204/iodp.proc.339.102.2013, 2013b.
Fisher, A. T. and Underwood, M. B.: Calibration of an X-ray diffraction method to determine relative mineral abundances in bulk powders using matrix singular value decomposition: a test from the Barbados accretionary complex, in: Proc. ODP, edited by: Shipley, T. H., Ogawa, Y., and Blum, P., Init. Repts, 156, 29–37, https://doi.org/10.2973/odp.proc.ir.156.103.1995, 1995.
Flügel, E.: Microfacies Analysis: Methods, in: Microfacies of Carbonate Rocks, Springer, Berlin, Heidelberg, Germany, https://doi.org/10.1007/978-3-642-03796-2_3, 2010.
Folk, R. L.: A comparison chart for visual percentage estimation, J. Sediment. Petrol., 21, 32–33, https://doi.org/10.1306/D4269413-2B26-11D7-8648000102C1865D, 1951.
Folk, R. L.: The distinction between grain size and mineral composition in sedimentary-rock nomenclature, J. Geol., 62, 344–359, 1954.
Gallagher, S. J., Fulthorpe, C. S., Bogus, K., Auer, G., Baranwal, S., Castañeda, I. S., Christensen, B. A., De Vleeschouwer, D., Franco, D. R., Groeneveld, J., Gurnis, M., Haller, C., He, Y., Henderiks, J., Himmler, T., Ishiwa, T., Iwatani, H., Jatiningrum, R. S., Kominz, M. A., Korpanty, C. A., Lee, E. Y., Levin, E., Mamo, B. L., McGregor, H. V., McHugh, C. M., Petrick, B. F., Potts, D. C., Rastegar Lari, A., Renema, W., Reuning, L., Takayanagi, H., and Zhang, W.: Site U1459, in: Indonesian Throughflow, edited by: Gallagher, S. J., Fulthorpe, C. S., Bogus, K., and the Expedition 356 Scientists, Proceedings of the International Ocean Discovery Program, International Ocean Discovery Program, College Station, TX, USA, 356, https://doi.org/10.14379/iodp.proc.356.104.2017, 2017.
Gibbs, R. J.: Error due to segregation in quantitative clay mineral X-ray diffraction mounting techniques, Am. Mineral., 50, 741–751, 1965.
Gibbs, R. J.: Clay mineral segregation in the marine environment, J. Sediment. Petrol., 47, 237–243, https://doi.org/10.1306/212F713A-2B24-11D7-8648000102C1865D, 1977.
Giosan, L., Flood, R. D., and Aller, R. C.: Paleoceanographic significance of sediment color on western North Atlantic drifts: I. Origin of color, Mar. Geol., 189, 25–41, https://doi.org/10.1016/S0025-3227(02)00321-3, 2002.
Griffiths, J. C. and Rosenfeld, M. A.: Operator variation in experimental research, J. Geol., 62, 74–91, https://doi.org/10.1306/74D704F7-2B21-11D7-8648000102C1865D, 1954.
Hall, I. R., Hemming, S. R., LeVay, L. J., Barker, S., Berke, M. A., Brentegani, L., Caley, T., Cartagena-Sierra, A., Charles, C. D., Coenen, J. J., Crespin, J. G., Franzese, A. M., Gruetzner, J., Han, X., Hines, S. K. V., Jimenez Espejo, F. J., Just, J., Koutsodendris, A., Kubota, K., Lathika, N., Norris, R. D., Periera dos Santos, T., Robinson, R., Rolinson, J. M., Simon, M. H., Tangunan, D., van der Lubbe, J. J. L., Yamane, M., and Zhang, H.: Site U1474, in: South African Climates (Agulhas LGM Density Profile), edited by: Hall, I. R., Hemming, S. R., LeVay, L. J., and the Expedition 361 Scientists, Proceedings of the International Ocean Discovery Program, International Ocean Discovery Program, College Station, TX, USA, 361, https://doi.org/10.14379/iodp.proc.361.103.2017, 2017.
Integrated Ocean Drilling Program Depth Scale Task Force: IODP Depth Scales Terminology, available at: https://www.iodp.org/policies-and-guidelines/142-iodp-depth-scales-terminology-april-2011/file (last access: 6 December 2021), 2011.
International Ocean Discovery Program JOIDES Resolution Science Operator: LIMS Reports, Texas A&M University, College Station, TX, USA, available at: https://web.iodp.tamu.edu/LORE/, last access: 6 December 2021.
Jansen, E., Mayer, L., and Shipboard Scientific Party: GRAPE density records and density cyclicity, in: Proc. ODP, Init. Repts., edited by: Kroenke, L. W., Berger, W. H., Janecek, T. R., and Shipboard Scientific Party, Ocean Drilling Program, College Station, TX, USA, 130, 553–556, https://doi.org/10.2973/odp.proc.ir.130.113.1991, 1991.
Johnson, J. E., Phillips, S. C., Torres, M. E., Piñero, E., Rose, K. K., and Giosan, L.: Influence of total organic carbon deposition on the inventory of gas hydrate in the Indian continental margins, Mar. Petrol. Geol., 58, 406–424, https://doi.org/10.1016/j.marpetgeo.2014.08.021, 2014.
Lee, J., Kim, S., Lee, J. I., Cho, H. G., Phillips, S. C., and Khim, B.-K.: Monsoon-influenced variation of clay mineral compositions and detrital Nd-Sr isotopes in the western Andaman Sea (IODP Site U1447) since the late Miocene, Palaeogeogr. Palaeocl., 538, 109339, https://doi.org/10.1016/j.palaeo.2019.109339, 2020.
Lübbers, J., Kuhnt, Holburn, A. E., Bolton, C. T., Gray, E., Usui, U., Kochhann, K. G. D., Beil, S., and Andersen, N.: The middle to late Miocene “Carbonate Crash” in the equatorial Indian Ocean, Paleoceanography and Paleoclimatology, 34, 813–832, https://doi.org/10.1029/2018PA003482, 2019.
Marsaglia, K., Milliken, K., and Doran, L.: IODP Smear Slide Digital Reference for Sediment Analysis of Marine Mud: Part 1: Methodology and Atlas of Siliciclastic and Volcanogenic Components, Integrated Ocean Drilling Program Technical Note 1, https://doi.org/10.2204/iodp.tn.1.2013, 2013.
Marsaglia, K., Milliken, K., Leckie, R. M., Tentori, D., and Doran, L.: IODP Smear Slide Digital Reference for Sediment Analysis of Marine Mud: Part 2: Methodology and Atlas of Biogenic Components, International Ocean Discovery Program Technical Note 2, https://doi.org/10.2204/iodp.tn.2.2015, 2015.
Mayer, L. A.: Extraction of high resolution carbonate data for paleoclimate reconstruction, Nature, 352, 148–150, 1991.
Mazzullo, J. and Graham, A. G.: Handbook for shipboard sedimentologists, ODP Tech. Note 8, https://doi.org/10.2973/odp.tn.8.1988, 1988.
Mazzullo, J. M., Meyer, A., and Kidd, R. B.: New sediment classification scheme for the Ocean Drilling Program, in: Handbook for shipboard sedimentologists, edited by: Mazzullo, J. M. and Graham, A. G., ODP Tech. Note, 8, 45–67, https://doi.org/10.2973/odp.tn.8.1988, 1988.
Milliken, K.: A compositional classification for grain assemblages in fine-grained sediments and sedimentary rocks, J. Sediment. Res., 84, 1185–1199, https://doi.org/10.2110/jsr.2014.92, 2014.
Musich, L.: Sediment smear slides: Preparation and handling, in: Sedimentology, Physical Properties, and Geochemistry in the Initial Reports of the Deep Sea Drilling Project, Volumes 1–44: An Overview, edited by: Heath, G. R., National Geophysical Data Center, Boulder, Colorado, USA, 63–70, 1984.
Myrbo, A., Morrison, A., and McEwan, R: Tool for Microscopic Identification (TMI), available at: http://tmi.laccore.umn.edu (last access: 6 December 2021), 2011.
Ortiz, J., Mix, A., Harris, S., and O'Connell, S.: Diffuse spectral reflectance as a proxy for percent carbonate content in North Atlantic sediments, Paleoceanography, 14, 171–186, https://doi.org/10.1029/1998PA900021, 1999.
Ota, Y., Kuroda, J., Yamaguchi, A., Suzuki, A., Araoka, D., Ishimura, T., Team, N. E. J. S., and Kawahata, H.: Monsoon-influenced variations in plankton community structure and upperwater column stratification in the western Bay of Bengal during the past 80 ky, Palaeogeogr. Palaeocl., 521, 138–150, https://doi.org/10.1016/j.palaeo.2019.02.020, 2019.
Phillips, S. C., Johnson, J. E., Giosan, L., and Rose, K.: Monsoon-influenced variation in productivity and lithogenic sediment flux since 110 ka in the offshore Mahanadi Basin, northern Bay of Bengal, Mar. Petrol. Geol., 58, 502–525, https://doi.org/10.1016/j.marpetgeo.2014.05.007, 2014a.
Phillips, S. C., Johnson, J. E., Underwood, M. B., Guo, J., Giosan, L., and Rose, K.: Long-timescale variation in bulk and clay mineral composition of Indian continental margin sediments in the Bay of Bengal, Arabian Sea, and Andaman Sea, Mar. Petrol. Geol., 58A, 118–138, https://doi.org/10.1016/j.marpetgeo.2014.06.018, 2014b.
Pimmel, A. and Claypool, G.: Introduction to Shipboard Organic Geochemistry on the JOIDES Resolution, ODP Technical Note 30, https://doi.org/10.2973/odp.tn.30.2001, 2001.
Reid, J. C.: Comparison chart for estimating volume percentages of constituents in rocks and concentrates in the range of 1.0 to 0.1 volume percent, Am. Mineral., 70, 1318–1319, 1985.
Rothwell, R. G.: Minerals and Mineraloids in Marine Sediments: An Optical Identification Guide, Springer Netherlands, 279 pp., https://doi.org/10.1007/978-94-009-1133-8, 1989.
Schultheiss, P. J. and McPhail, S. D.: An automated P-wave logger for recording fine-scale compressional wave velocity structures in sediments, in: Proc. ODP, Sci. Results, edited by: Ruddiman, W., Sarnthein, M., and Shipboard Scientific Party, 108, 407–413, Ocean Drilling Program, College Station, TX, USA, https://doi.org/10.2973/odp.proc.sr.108.157.1989, 1989.
Shepard, F. P.: Nomenclature based on sand-silt-clay ratios, J. Sediment. Petrol., 24, 151–158, https://doi.org/10.1306/D4269774-2B26-11D7-8648000102C1865D, 1954.
Shipboard Scientific Party: Explanatory notes, in: Proc. ODP, Init. Repts., edited by: Kastens, K. A., Mascle, J., Auroux, C., and Shipboard Scientific Party, Ocean Drilling Program, College Station, TX, USA, 107, 65–88, https://doi.org/10.2973/odp.proc.ir.107.104.1987, 1987.
Shipboard Scientific Party: Site 758, in: Proc. ODP, Init. Repts, edited by: Peirce, J., Weissel, J., and Shipboard Scientific Party, 121, 359–453, https://doi.org/10.2973/odp.proc.ir.121.112.1989, 1989.
Shipboard Scientific Party: Site 803, in: Proc. ODP, Init. Repts., edited by: Kroenke, L. W., Berger, W. H., Janecek, T. R., and Shipboard Scientific Party, Ocean Drilling Program, College Station, TX, USA, 130, 101–176, https://doi.org/10.2973/odp.proc.ir.130.105.1991, 1991.
Shipboard Scientific Party: Site 892, in: Proc. ODP, Init. Repts., edited by: Westbrook, G. K., Carson, B., Musgrave, R. J., and Shipboard Scientific Party, Ocean Drilling Program, College Station, TX, USA, 146 (Pt. 1), 301–378, https://doi.org/10.2973/odp.proc.ir.146-1.010.1994, 1994a.
Shipboard Scientific Party: Site 902, in: Proc. ODP, Init. Repts., edited by: Mountain, G. S., Miller, K. G., Blum, P., and Shipboard Scientific Party, Ocean Drilling Program, College Station, TX, USA, 150, 63–127, https://doi.org/10.2973/odp.proc.ir.150.106.1994, 1994b.
Shipboard Scientific Party: Site 907, in: Proc. ODP, Init. Repts., edited by: Myhre, A. M., Thiede, J., Firth, J. V., and Shipboard Scientific Party, Ocean Drilling Program, College Station, TX, USA, 151, 57–111, https://doi.org/10.2973/odp.proc.ir.151.105.1995, 1995a.
Shipboard Scientific Party:. Explanatory notes, in: Proc. ODP, Init. Repts., edited by: Curry, W. B., Shackleton, N. J., Richter, C., and Shipboard Scientific Party, Ocean Drilling Program, College Station, TX, USA, 154, 11–38, https://doi.org/10.2973/odp.proc.ir.154.102.1995, 1995b.
Shipboard Scientific Party: Site 959, in: Proc. ODP, Init. Repts., edited by: Mascle, J., Lohmann, G. P., Clift, P. D., and Shipboard Scientific Party, Ocean Drilling Program, College Station, TX, USA, 159, 65–150, https://doi.org/10.2973/odp.proc.ir.159.105.1996, 1996a.
Shipboard Scientific Party: Site 974, in: Proc. ODP, Init. Repts., edited by: Comas, M. C., Zahn, R., Klaus, A., and Shipboard Scientific Party, Ocean Drilling Program, College Station, TX, USA, 161, 55–111, https://doi.org/10.2973/odp.proc.ir.161.104.1996, 1996b.
Shipboard Scientific Party: Explanatory notes, in: Proc. ODP, Init. Repts., edited by: Jansen, E., Raymo, M. E., Blum, P., and Shipboard Scientific Party, Ocean Drilling Program, College Station, TX, USA, 162, 21–45, https://doi.org/10.2973/odp.proc.ir.162.102.1996, 1996c.
Shipboard Scientific Party: Explanatory notes, in: Proc. ODP, Init. Repts., eduted by: Kimura, G., Silver, E., Blum, P., and Shipboard Scientific Party, Ocean Drilling Program, College Station, TX, USA, 170, 19–42, https://doi.org/10.2973/odp.proc.ir.170.102.1997, 1997.
Shipboard Scientific Party: Site 1168, in: Proc. ODP, Init. Repts., edited by: Exon, N. F., Kennett, J. P., Malone, M. J., and Shipboard Scientific Party, 189, 1–170, https://doi.org/10.2973/odp.proc.ir.189.103.2001, 2001.
Stokke, P. R. and Carson, B.: Variation in clay mineral X-Ray diffraction results with the quantity of sample mounted, J. Sediment. Res., 43, 957–964, https://doi.org/10.1306/74D728C4-2B21-11D7-8648000102C1865D, 1973.
Terry, R. D. and Chilingar, G. V.: Summary of “Concerning some additional aids in studying sedimentary formations” by M. S. Shvetsov, J. Sediment. Petrol., 25, 229–234, https://doi.org/10.1306/74D70466-2B21-11D7-8648000102C1865D, 1955.
Thomas, A. R. and Murray, H. H.: Clay mineral segregation by flocculation in the Porters Creek Formation, Clay. Clay Miner., 37, 179–184, https://doi.org/10.1346/CCMN.1989.0370210, 1989.
Vasiliev, M. A., Blum, P., Chubarian, G., Olsen, R., Bennight, C., Cobine, T., Fackler, D., Hastedt, M., Houpt, D., Mateo, Z., and Vasilieva, Y. B.: A new natural gamma radiation measurement system for marine sediment and rock analysis, J. Appl. Geophys., 75, 455–463, https://doi.org/10.1016/j.jappgeo.2011.08.008, 2011.
Verardo, D. J., Froelich, P. N., and McIntyre, A.: Determination of organic carbon and nitrogen in marine sediments using the Carlo Erba NA-1500 Analyzer, Deep-Sea Res., 37, 157–165, https://doi.org/10.1016/0198-0149(90)90034-S, 1990.
Weaver, P. P. E. and Schultheiss, P. J.: Current methods for obtaining, logging and splitting marine sediment cores, Mar. Geophys. Res., 12, 85–100, https://doi.org/10.1007/BF00310565, 1990.
Weber, M. E., Niessen, F., Kuhn, G., and Wiedicke, M.: Calibration and application of marine sedimentary physical properties using a multi-sensor core logger, Mar. Geol., 136, 151–172, https://doi.org/10.1016/S0025-3227(96)00071-0, 1997.