the Creative Commons Attribution 4.0 License.
the Creative Commons Attribution 4.0 License.
 | 10 Jun 2026
Non-destructive core visualization using X-ray computed tomography scan and its implementation into the core workflow on D/V Chikyu
Charlotte Pizer
Mai-Linh Doan
Michael Strasser
X-ray computed tomography (XCT) scans are one of the first measurements performed after the recovery of cores during expeditions using the drilling vessel (D/V) Chikyu. Despite their completeness and availability, XCT scan data have not been effectively utilized for routine visual core description and shipboard sampling. We designed a Python-based visualization workflow that is compatible with the systems on D/V Chikyu and implemented it in the onboard core workflow.
- Article
(4093 KB) - Full-text XML
- BibTeX
- EndNote


X-ray computed tomography (XCT) is a non-destructive imaging technique that can visualize internal structures of drill cores (Carlson, 2006; Emmanouilidis et al., 2020; Gupta et al., 2019; Reilly et al., 2017; Titschack et al., 2015, 2016; Tonai et al., 2019, Vandorpe et al., 2019; Williams et al., 2016; Yan et al., 2021; Zonta et al., 2021). In International Ocean Discovery Program (IODP) and International Ocean Drilling Programme (IODP3) expeditions on the drilling vessel (D/V) Chikyu, a recovered drill core is cut into sections at the Lab Roof Deck (or core cutting area), and the sections are delivered to the Core Processing Deck (or core laboratory) after headspace gas and liner fluid sampling if required. Subsequently, each section is scanned by an onboard medical XCT scanner. The reconstructed 3D volume of a section is examined by watchdog scientists who determine intervals for time-sensitive whole-round (WR) sampling, e.g. core samples for squeezing interstitial water or WR samples for microbiology. After the time-sensitive WR sampling, the core sections remain at room temperature for 2–3 h to equilibrate their temperatures for non-destructive measurements using COMET (Core Measurement Track, NS Design). Depending on personal sample requests, additional WR samples may be cut after COMET measurements before core sections are split into archive and working halves (AHs and WHs). AHs are reserved for visual core description (VCD) by sedimentologists and petrologists, and WHs are reserved for VCD by structural geologists and for shipboard and personal sampling and measurements by the other shipboard scientists (e.g. Kirkpatrick et al., 2025).
As the XCT scan is one of the first shipboard measurements and because it is carried out prior to most of the sampling, XCT scan data have the most complete and continuous information about the core. Since an XCT image conveys information about density and elemental compositions through the X-ray attenuation, it is a powerful tool to determine sedimentary and deformation structures such as bioturbation, turbidites, and faults (Strasser et al., 2024). Nevertheless, it has only been utilized by watchdogs for WR samplings because most shipboard scientists are not familiar with the software required to view DICOM (Digital Imaging and Communications in Medicine) files, which are large (typically greater than 1 GB per section) and less accessible (only a few dedicated computers can access the data on board). To maximize the value of XCT scan images for shipboard VCD and sampling processes, we constructed a Python-based visualization workflow that makes XCT scan images available for all of the shipboard scientists on board D/V Chikyu by the time of non-time sensitive WR sampling, splitting, and VCD.
In principle, the XCT reconstructs the distribution of the linear attenuation coefficient (LAC) based on X-ray intensity passing through the target material (Carlson, 2006). The LAC is typically expressed by the CT number in Hounsfield units (HU) that represents the LAC relative to water, where water and air have 0 and −1000 HU, respectively (Hounsfield, 1973). As high-density materials or materials with higher atomic numbers have higher LACs, i.e. higher CT numbers, an XCT 3D volume provides internal structures or discontinuities defined by density or material contrasts. The shipboard XCT scanner (Revolution Frontier VT1700, GE HealthCare) generates a series of 2D slices of CT numbers composed of 512 × 512 pixels in the given field of view of 90 mm, leading to the resolution of 0.176 mm in each 2D slice. “HD detail” mode is generally employed for reconstruction. Each slice interval was set to be 0.625 mm; therefore, a full-length core section (typically 1.4 m) is composed of approximately 2200–2300 slices. Each slice is saved as a DICOM file. Successive slices yield a 3D volume of CT numbers within a core section. On D/V Chikyu, the XCT scanner is calibrated every 24 h using core mock-ups for air (−1000 HU), water (0 HU), and aluminium (2477–2487 HU).
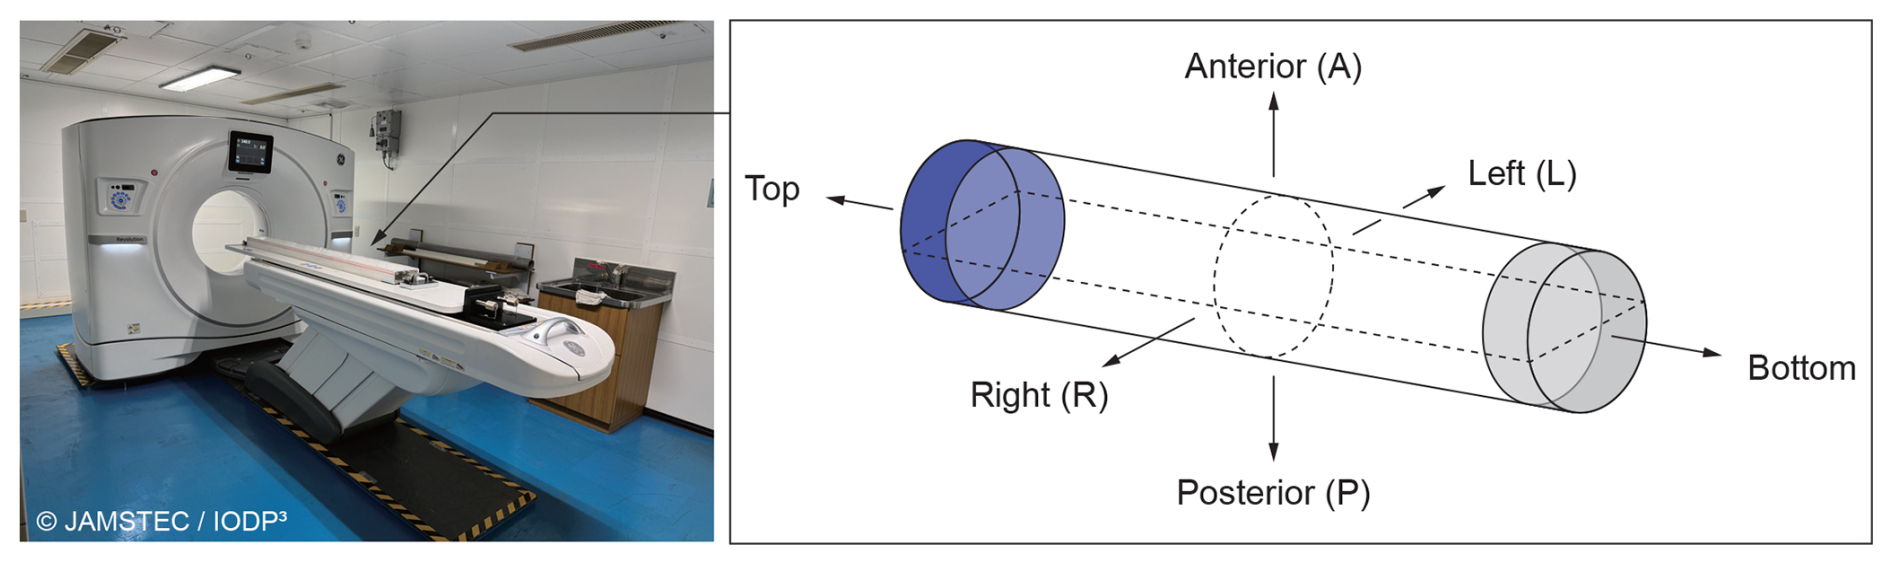
Figure 1The shipboard medical-grade XCT scanner (Revolution Frontier VT1700, GE HealthCare) on D/V Chikyu and its scanning coordinates. Photo is provided by JAMSTEC and IODP3.
All the core sections are scanned at the coordinates shown in Fig. 1. A core section is split into the anterior and posterior sides by the y–z plane. Positive and negative x directions correspond to the anterior side, which is the working half (WH) side, and the posterior side, which is the archive half (AH) side. A positive z points to the section's bottom direction. For the visualization workflow, we generated four types of images from the 3D volume (Fig. 2): (1) a slice along the y–z plane on AH, (2) the same slice but on WH, (3) a slice along the x–z plane vertical to the split surface (namely Slice//X), and (4) an unwrapped image. Items (1) and (2) correspond to the split surfaces on AH and WH, respectively. Item (4) is the slice along a circular path with a diameter of 128 pixels (approximately 22.5 mm) whose centre is the core axis. The unwrapping scheme is adopted from Doan et al. (2026), which is similar to the technique employed in previous works (e.g. Williams et al., 2016). In addition to the four types of images, we computed depth profiles of CT number (namely CT number profile) by taking an averaged value of pixels on each slice with the CT numbers greater than 1200 HU in a 40 mm diameter circular area. These parameters can be manually changed to suit different core lithologies. The CT number profiles are saved as an image and a CSV file.
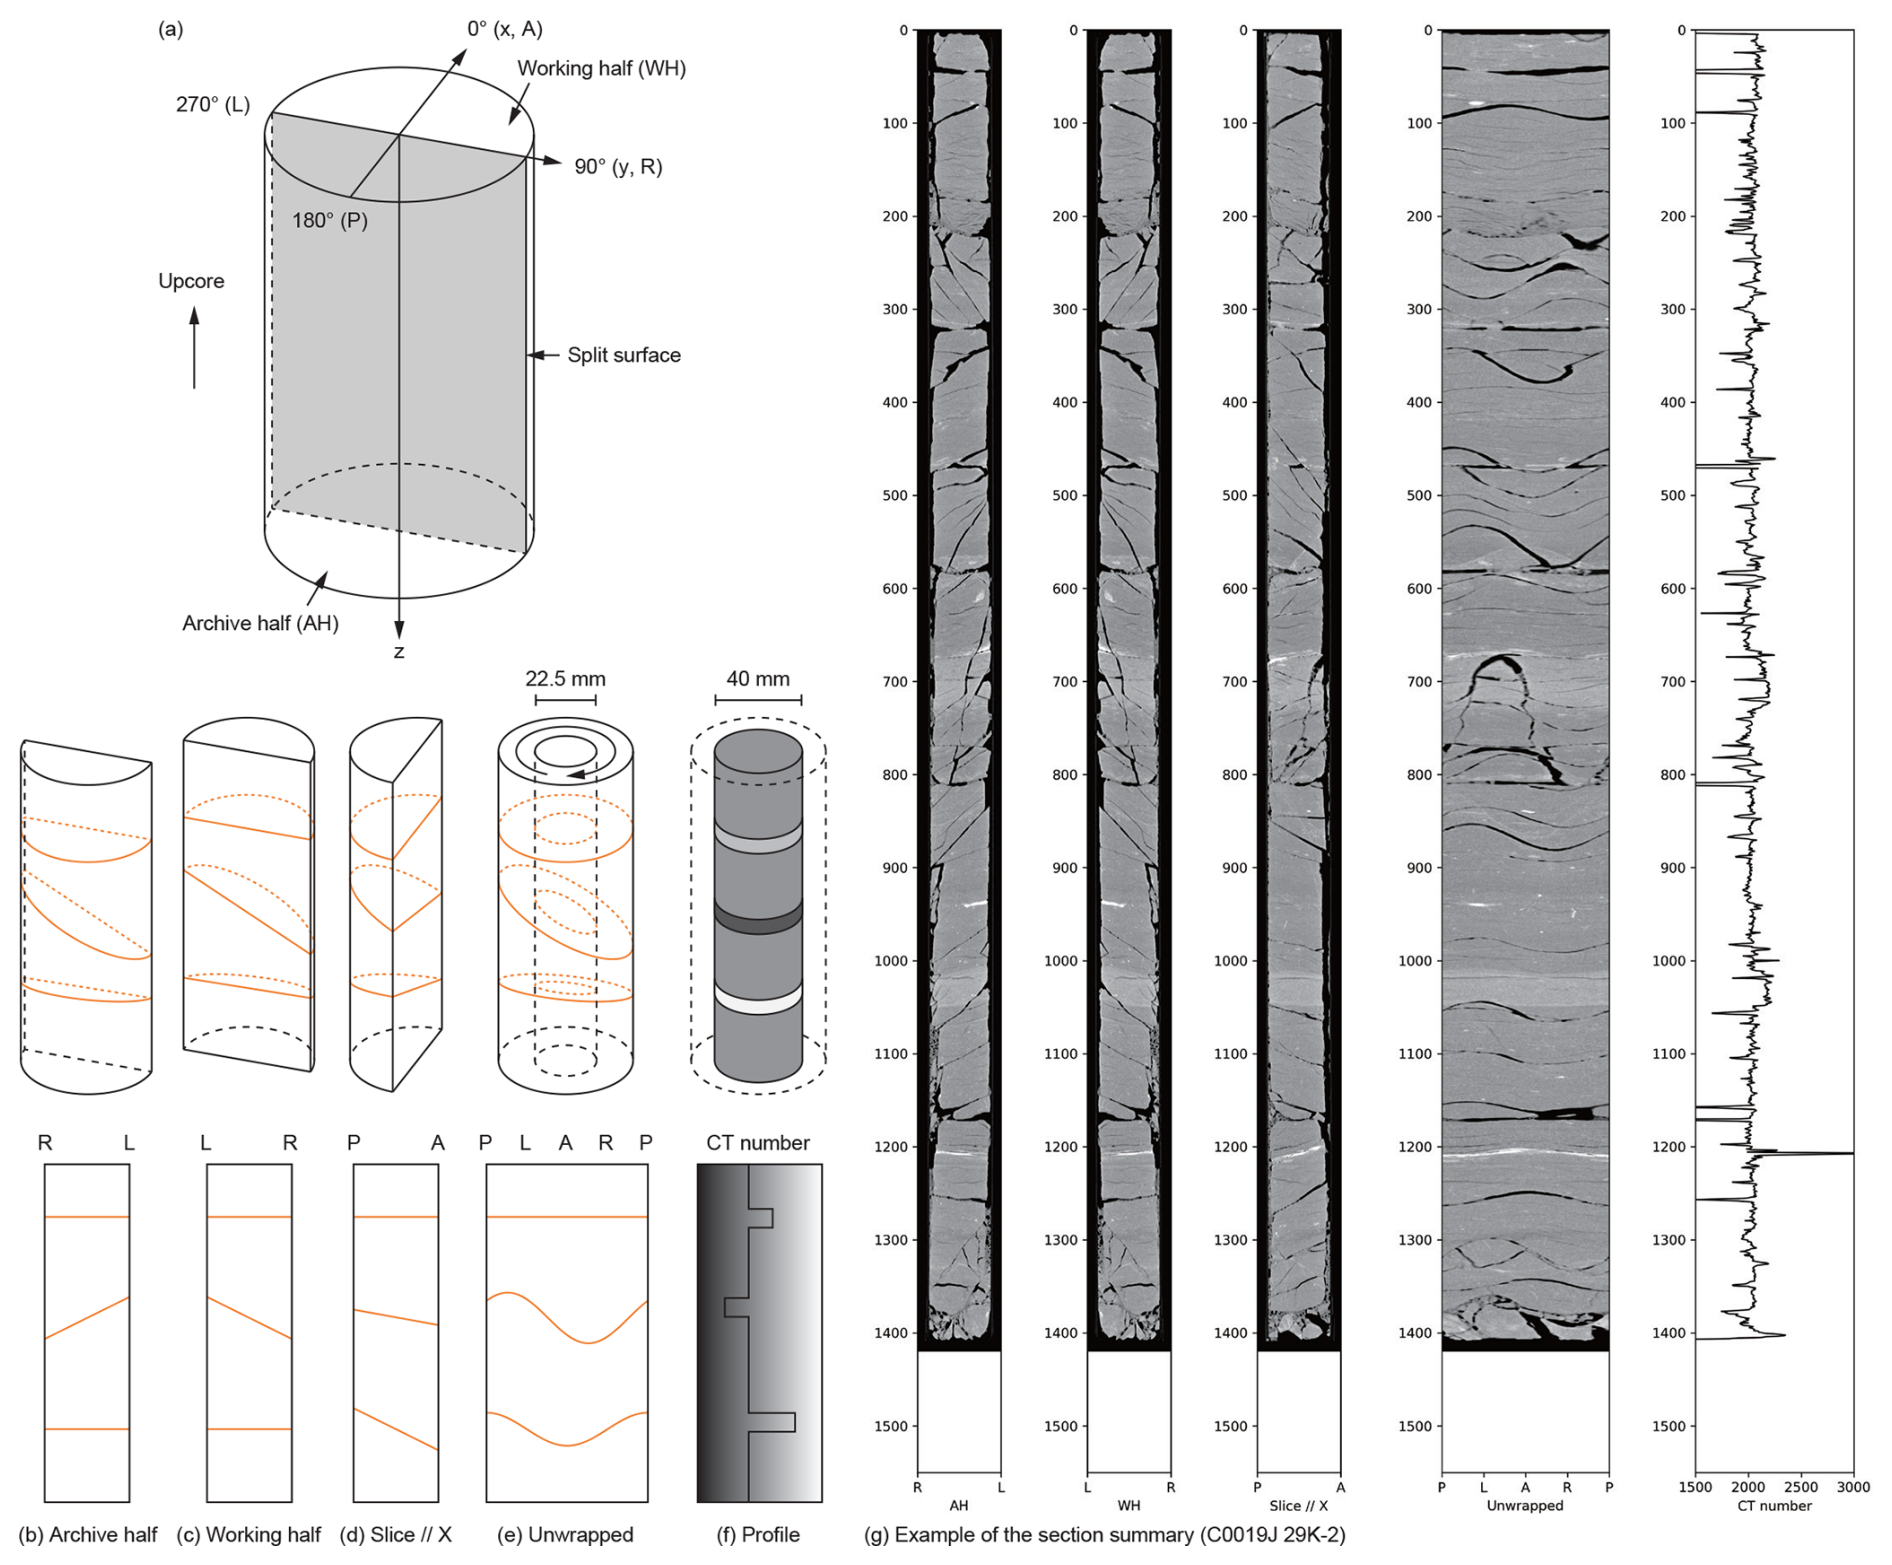
Figure 2(a) Schematic illustration for the core coordinates. (b–f) Four types of images and CT number profiles generated in the visualization workflow. (g) Example of the section summary (C0019J 29K-2), which is composed of the five datasets for the section.
Once the above four images and one profile are generated from every section in one core, they are summarized in three different ways, namely section summary, core summary, and hole summary (Fig. 3). In a section summary (Fig. 2g), the four types of images and the CT number profile for a given core section are aligned horizontally to summarize the core section. This section summary is useful for identifying structures on and beneath the split surface, which is especially essential to determine locations for shipboard samples that should be collected from undisturbed, representative locations in the core section. For example, the Slice//X image makes it easier for the physical property team to determine where to collect a discrete cube sample for P-wave velocity measurements that avoids cracks. All of the images displayed in the section summary are saved on the local computer. In a core summary, each type of image for every section in each core is aligned horizontally to capture the features over several sections. The core summaries for AH and WH images directly correspond to the split cores on the VCD tables such that lithology and structural geology teams can refer to the summaries to describe the core (Fig. 4). In addition, the images of core sections are stacked vertically to display a continuous downhole image along the depth direction (namely a core downhole summary). In a hole summary, images of all of the core sections in the hole are vertically stacked to display a downhole continuous image (namely a full downhole summary). The two downhole summaries replicate the full and complete stratigraphy of a core and a hole before shipboard and personal sampling. In IODP3 operations, two core depth scales below seafloor are used: core depth below sea floor-A (CSF-A) is the depth scale allowing core expansion, whereas CSF-B does not allow expansion but compresses the total core length to the cored interval (IODP3 Depth Scale Terminology, 2025). Both core- and full-downhole summaries are generated for both depth scales. We refer to the summary of curatorial lengths provided by curators to determine the top and bottom depths of each section. Since the core is vertically long, we compress the vertical length of all images to one-third of the original length for visualization purposes when generating the core- and full-downhole summaries, whereas no vertical compression is employed for the section and core summaries as they are directly used for VCD.
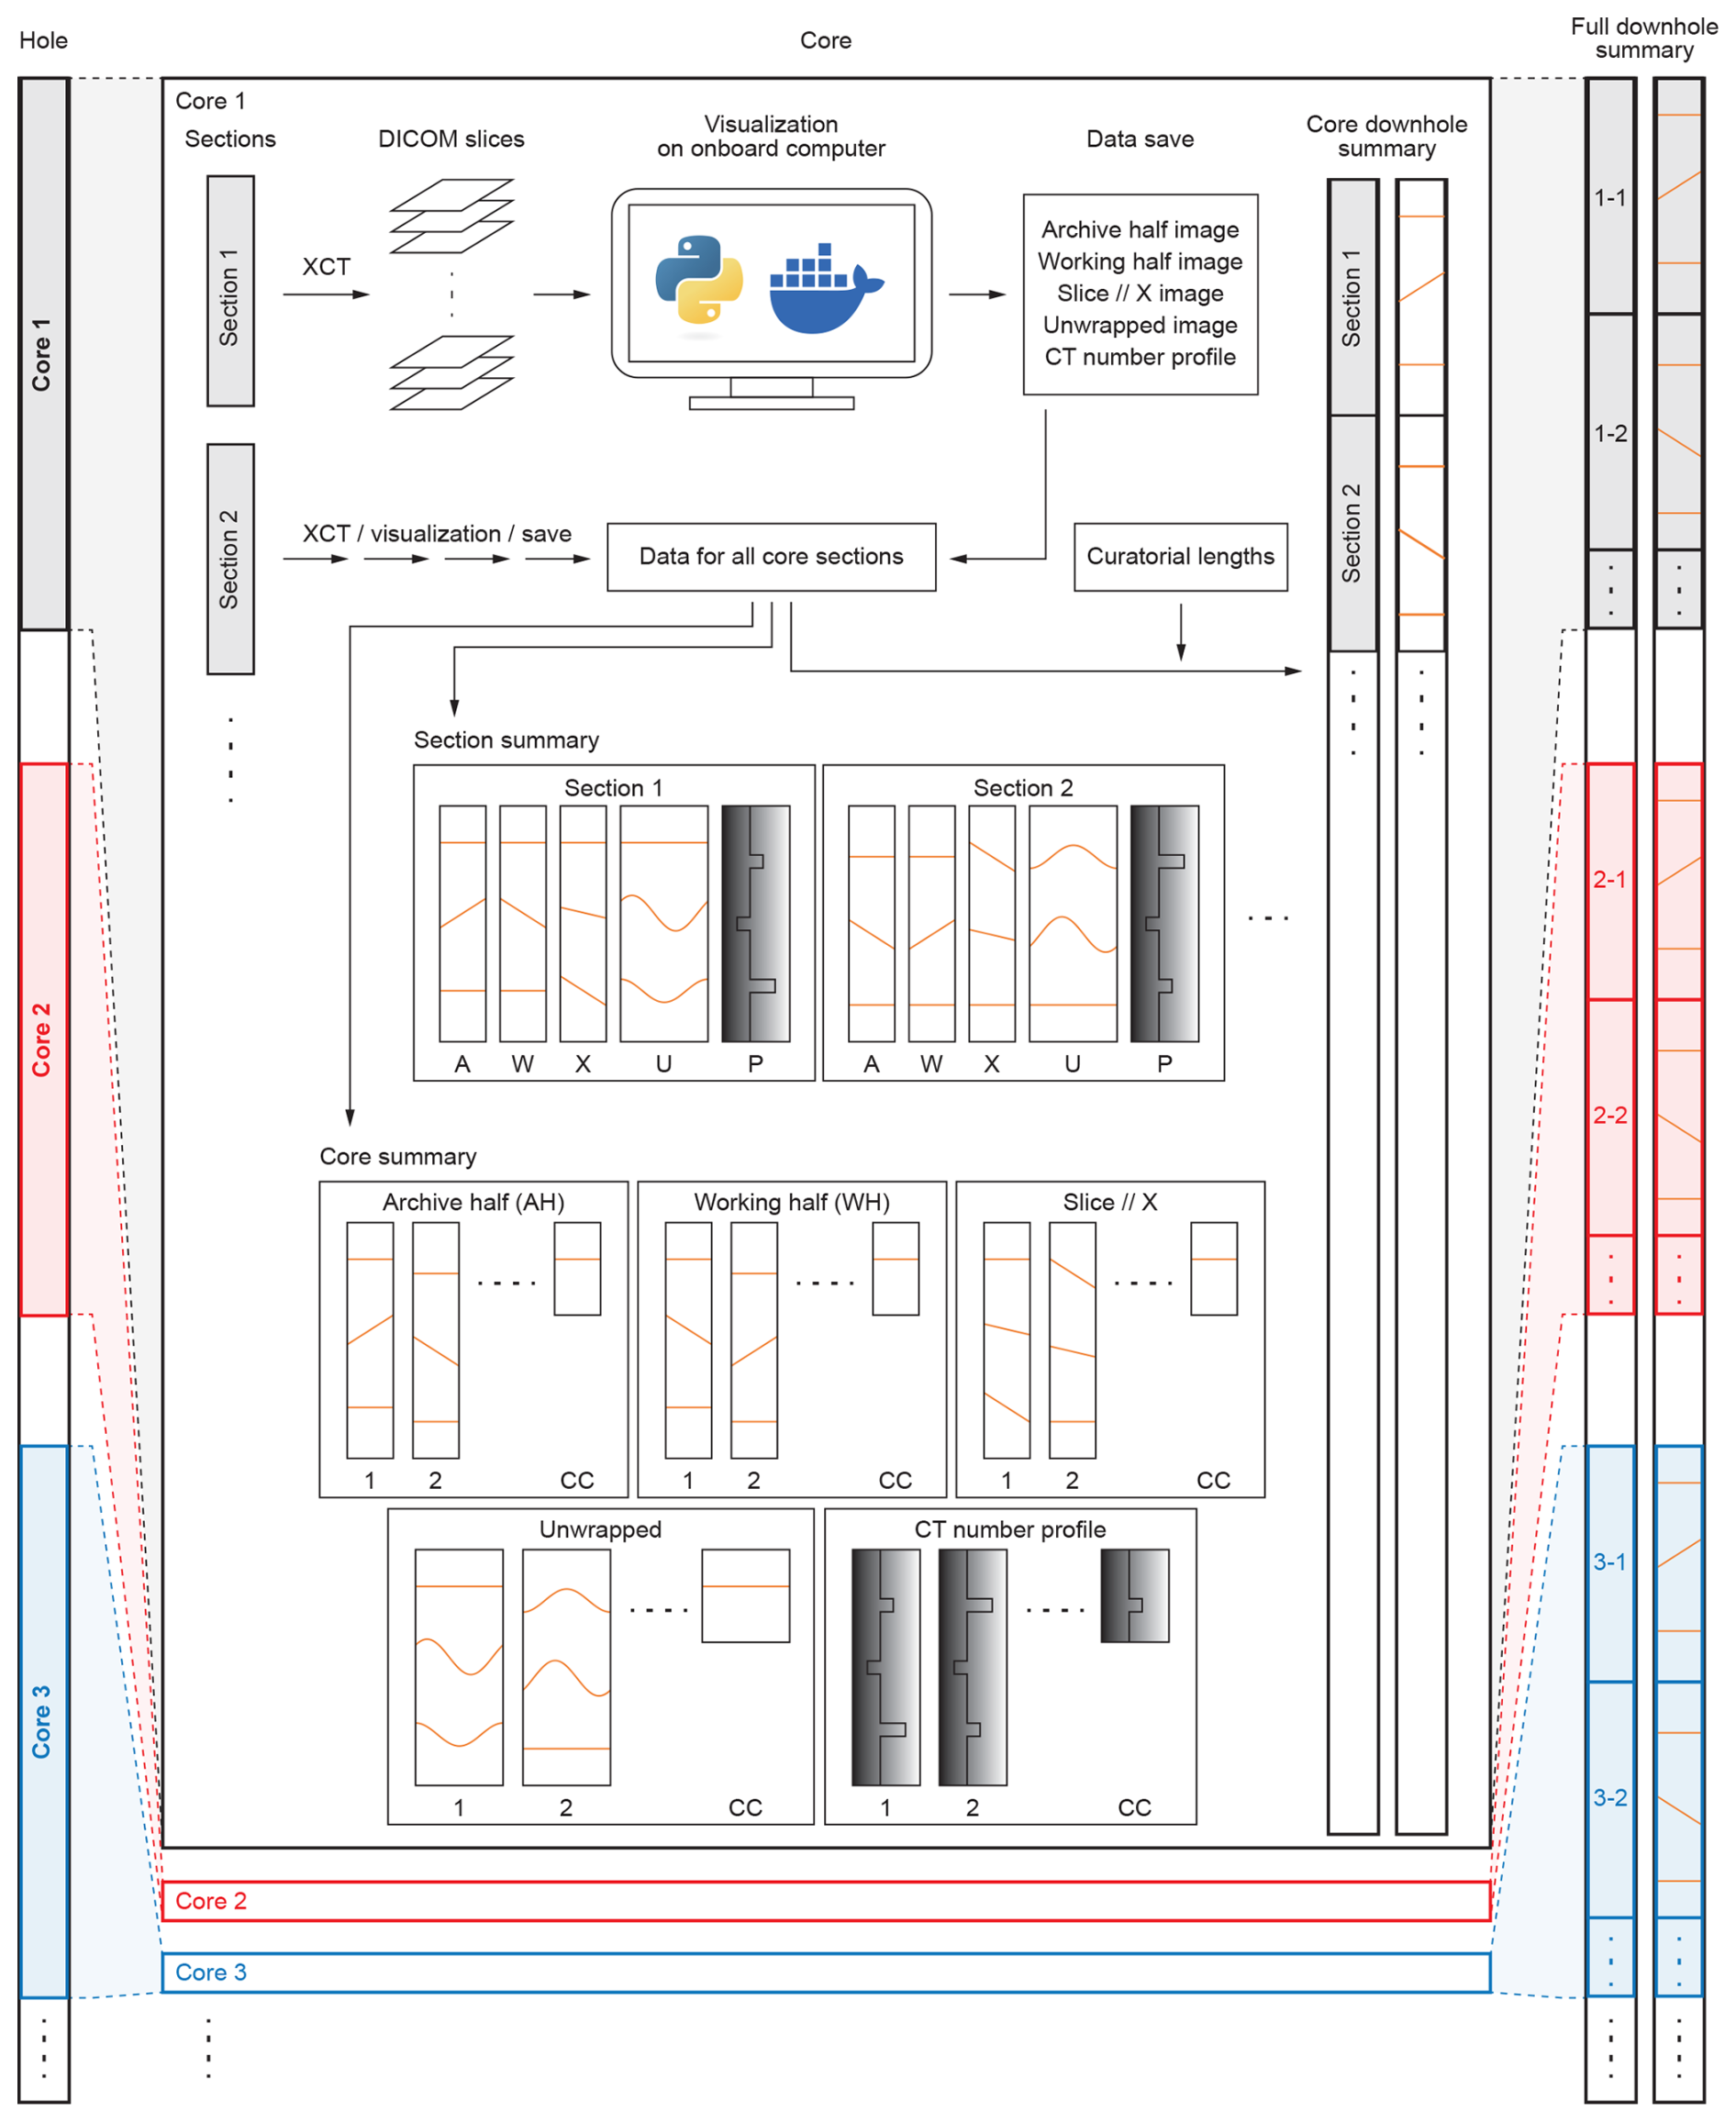
Figure 3Visualization workflow of the XCT scan data. Core sections are processed one by one. Once all the sections in a core are processed, the section summaries for all the sections and the core summary are produced. In the core downhole summary, images are vertically stacked based on the curatorial lengths provided by lab technicians. Lastly, all the cores are vertically stacked to produce the full-downhole summary. A, W, X, U, and P in the section summary represent AH (archive half), WH (working half), Slice//X (slice perpendicular to the split surface), unwrapped, and CT number profile, respectively. All the data are saved on the onboard computer and are shared with shipboard scientists. See Figs. 2g and 4 for examples of the section summary and core summary, respectively.
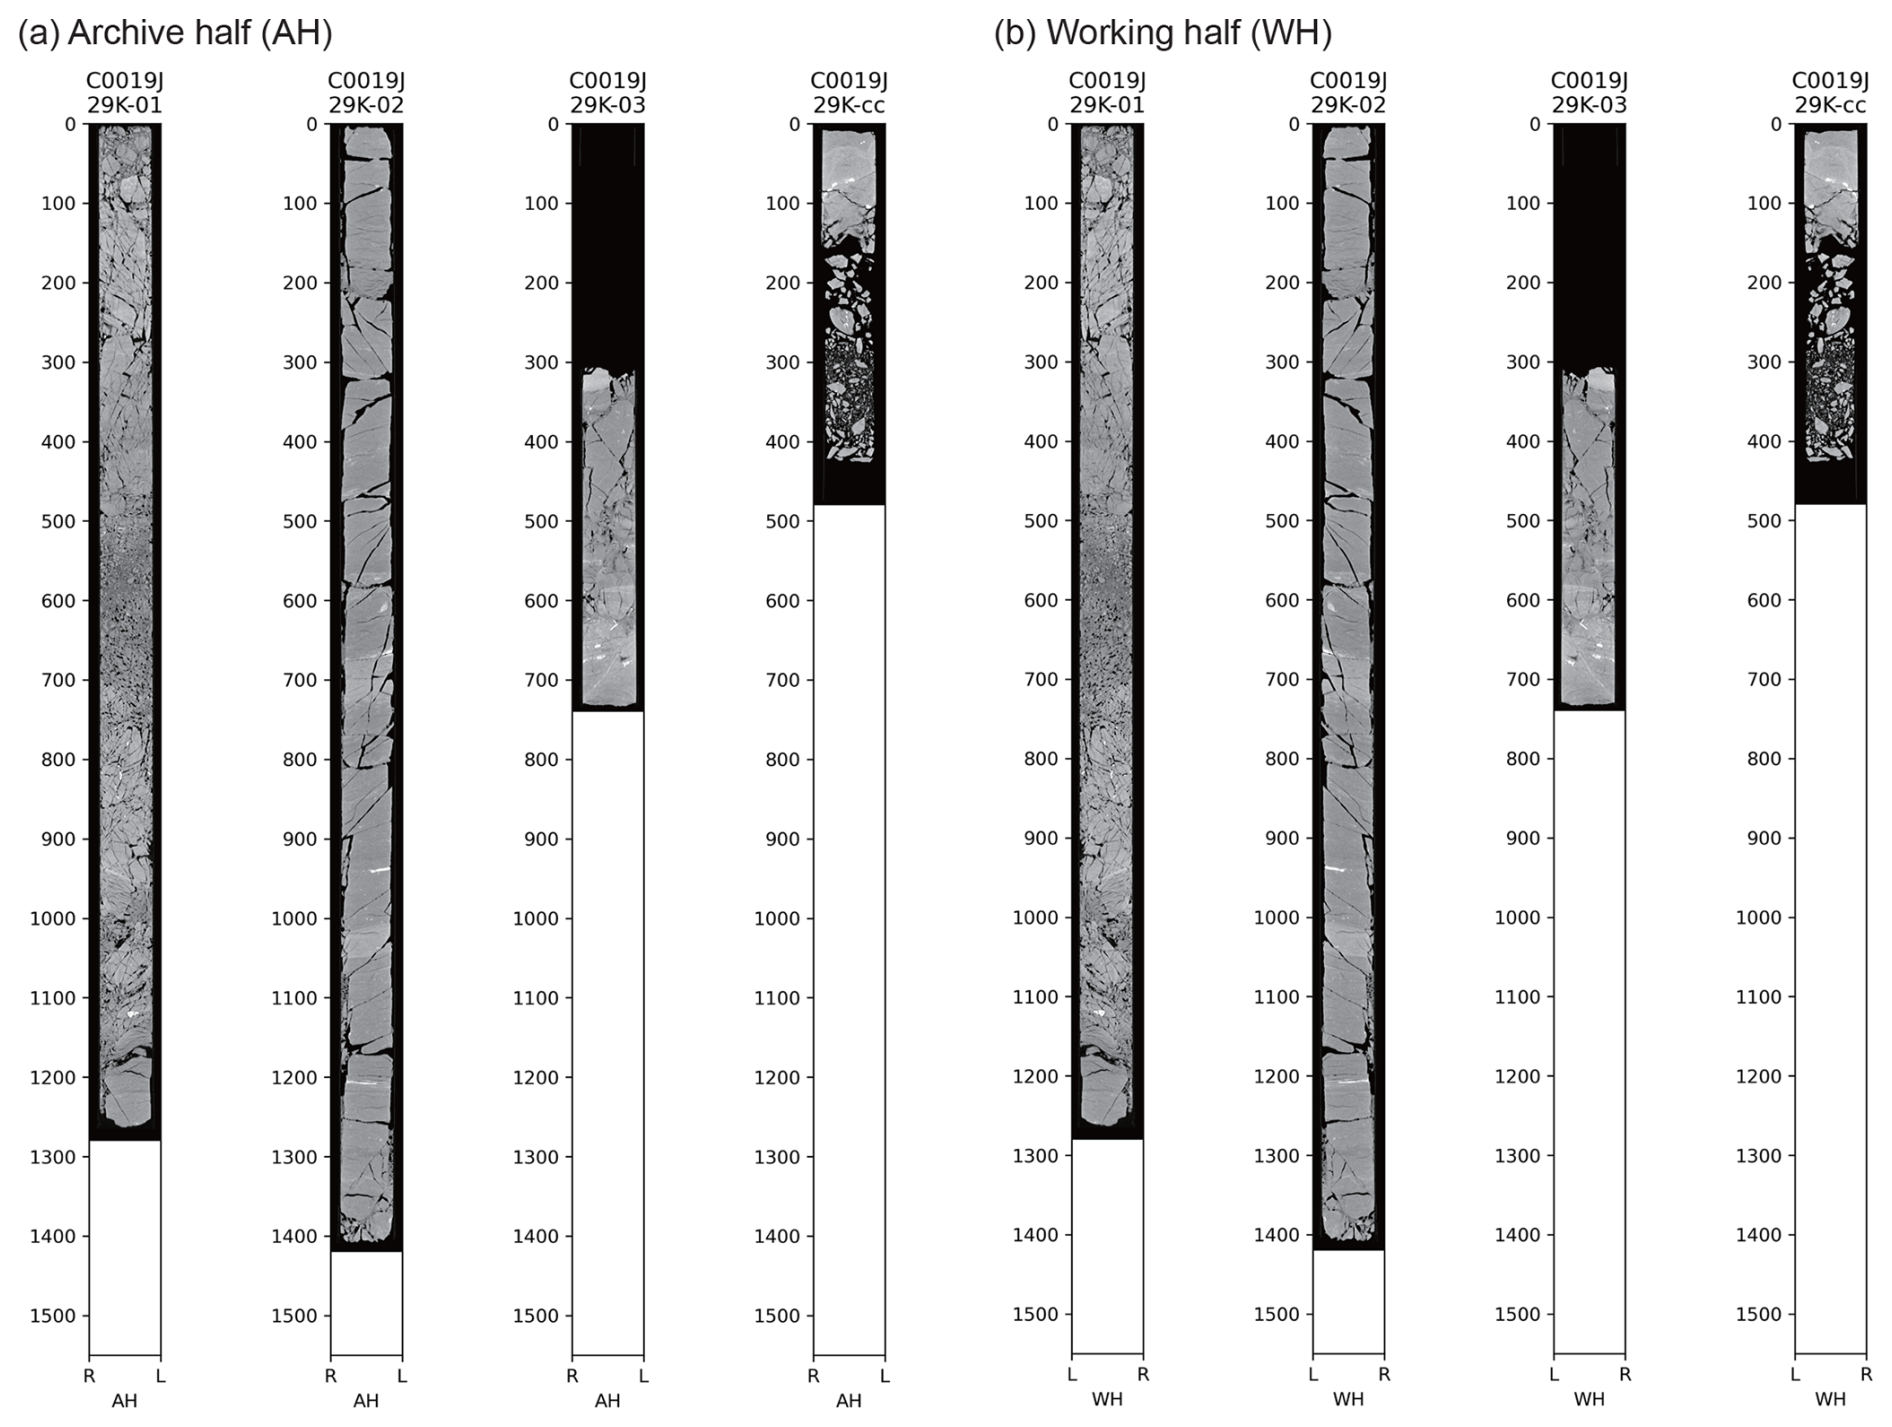
Figure 4Examples (C0019J 29K) of the core summary of (a) the archive half (AH) and (b) the working half (WH).
On D/V Chikyu, DICOM data are made accessible for shipboard scientists in three different ways: (1) via the Advanced Workstation version 4.7 on Linux, (2) via the Horos DICOM viewer on a Macintosh computer, and (3) via zipped files containing all DICOM data belonging to one section. After an XCT scan, data are firstly transferred to the Advanced Workstation for the watchdog duties regarding WR sampling. There is no option to export data from the Advanced Workstation for the postprocessing. Almost simultaneously, the DICOM data are stored in a designated server (namely the XCT server) that can be accessed via the Horos viewer. Since the Horos viewer has fairly prompt access to the DICOM data on the XCT server and can export data to local or network folders, we selected a shipboard Macintosh computer running the Horos viewer to operate visualization processes (Mac mini, 3.2 GHz 6-Core Intel Core i7, OSX Sequoia 15.7.2). The zipped files are typically delivered to shipboard scientists after the cruise; therefore, they cannot be used for prompt visualization as part of the shipboard core workflow. In addition, the DICOM data in these zipped files are compressed and occasionally cannot be opened by a widely used software such as ImageJ. Therefore, we decompress the DICOM data and save them in the standard uncompressed Explicit VR Little Endian format, which facilitates further investigation of these data during post-cruise research.
All of the above procedures were developed using Python, with several additional modules. The biggest obstacle for implementation is setting up the environment because it requires some knowledge and consideration regarding compatibility with pre-existing environments. For a smooth and safe implementation, we prepared a Docker™ image that is independent from pre-existing environments and that composites all of the modules required to run the codes. This containerized digital ecosystem can be run from every computer using the open-source Docker software.
Each core section has an 18-digit unique identification number on board (J-CORES ID). As the exported DICOM files are stored in a folder with the name of J-CORES ID, a look-up table between the J-CORES ID and corresponding core section information is required. This can be done by reading the first DICOM file in a folder. Once the look-up table is created automatically in the program, the codes start to run and generate all plots required for the section, core, and hole summaries. The CT number range to display the CT images can be set manually for every core, although the best practice is to choose a consistent range for all of the cores in a hole (e.g. 1000–2500 HU for sediment cores in the Japan Trench) as the core and full downhole summaries refer to the images generated during the process for each core. Diameters for unwrapping and calculating averaged CT number can also be manually modified in the Python code. It typically takes a few minutes to process everything on the Macintosh computer as the code is parallelized to process over 2000 DICOM files in one core section using multiple processes on all of the cores on the computer. There are two other similar codes that are for the core- and full-downhole summaries, both of which typically take 1 min to complete, although it depends on the number of sections displayed in the summaries.
The overall workflow summarized in Fig. 3 was implemented and tested during IODP3 Expeditions 502 (Yamaguchi et al., 2026) and 503 (Ikehara et al., 2025). Unfortunately, the visualization cannot be provided before the time-sensitive WR samplings as not all of the core sections are scanned by then. Still, shipboard scientists are able to access the XCT scan summaries even before non-time-sensitive WR sampling for personal post-expedition sampling requests and splitting of core sections. This has become possible owing to the implementation on a shipboard computer because all of the shipboard scientists are able to generate the summaries regardless of the science team and of the working shift. The original unwrapping methodology was developed during IODP Expedition 405, but, as it largely relied on manual maintenance, it was not used to its full potential during the cruise (Doan et al., 2026). The usage of Docker image allows the visualization workflow to be operated in any type of environment by only installing Docker. Such a system-independent implementation enables user-friendly utilization of new methods for the shipboard core workflow. Although the Docker image in this study is highly adjusted to the workflow on D/V Chikyu, a similar visualization strategy can be applied to other research using core samples, enabling rapid and consistent visualization of large datasets.
A remaining issue is that some structural information is lost when a 3D volume is sliced along a given cross-section. For example, an irregular-shaped, subvertical structure at the outer side of a core (e.g. injection structure) which is not cut by any slice planes cannot be monitored by the proposed visualization strategy. For this reason, we recommend that, in addition to our proposed visualization strategy, cores should also be examined using a 3D DICOM viewer. In future expeditions, the method of integration with logging data should be further considered. In particular, the unwrapped image can be directly compared with borehole images (Doan et al., 2026). Development and integration of machine-learning techniques to detect key features from the XCT scan images (Boiger et al., 2024), as well as joint analysis using other continuous information such as core scan images or COMET data, will further enable shipboard scientists to maximize the real-time understanding of cores on board.
The Docker image is available at https://hub.docker.com/r/hanayaokuda/xct_quick_check (last access: 4 June 2026). The Python script is also available at https://doi.org/10.17632/dyb6t5b9gm.1 (Okuda, 2026) on Mendeley data.
No data sets were used in this article.
Hanaya Okuda: conceptualization, code development, implementation, initial writing. Charlotte Pizer: conceptualization, implementation, reviewing and editing. Mai-Linh Doan: conceptualization, code development, reviewing and editing. Michael Strasser: conceptualization, implementation, reviewing and editing.
The contact author has declared that none of the authors has any competing interests.
Publisher's note: Copernicus Publications remains neutral with regard to jurisdictional claims made in the text, published maps, institutional affiliations, or any other geographical representation in this paper. The authors bear the ultimate responsibility for providing appropriate place names. Views expressed in the text are those of the authors and do not necessarily reflect the views of the publisher.
We would like to thank the expedition project managers (Natsumi Okutsu, Lena Maeda, Nobu Eguchi, and Sean Toczko from JAMSTEC), the lab technicians from Marine Works Japan Ltd. (especially Atsushi Kurasawa and Tsumugi Ozawa), an operation geologist (Kan Aoike from JAMSTEC), and all of the shipboard scientists and crew members on D/V Chikyu for helping in the implementation and hands-on tests during IODP3 Expeditions 502 and 503.
This paper was edited by Thomas Wiersberg and reviewed by Virginia Toy, J. T. Titschack, and Ann Cook.
Boiger, R., Churakov, S. V., Llagaria, I. B., Kosakowski, G., Wüst, R., and Prasianakis, N. I.: Direct mineral content prediction from drill core images via transfer learning, Swiss. J. Geosci., 117, 8, https://doi.org/10.1186/s00015-024-00458-3, 2024.
Carlson, W. D.: Three-dimensional imaging of earth and planetary materials, Earth Planet. Sci. Lett., 249, 133–147, https://doi.org/10.1016/j.epsl.2006.06.020, 2006.
Doan, M.-L., Brunet, M., Pizer, C., Okuda, H., Chang, Y.-C., Satolli, S., Nicholson, U., Yamamoto, Y., Conin, M., Fukuchi, R., Kirkpatrick, J., Toczko, S., and the IODP Expedition 405 Scientists: Real-time unwrapping of 3D X-ray CT scans for visual core description, Sci. Dril., 35, 55–60, https://doi.org/10.5194/sd-35-55-2026, 2026.
Emmanouilidis, A., Messaris, G., Ntzanis, E., Zampakis, P., Prevedouros, I., Bassukas, D. A., and Avramidis, P.: CT scanning, X-ray fluorescence: Non-destructive techniques for the identification of sedimentary facies and structures, Revue de Micropaléontologie, 67, 100410, https://doi.org/10.1016/j.revmic.2020.100410, 2020.
Gupta, L. P., Tanikawa, W., Hamada, Y., Hirose, T., Ahagon, N., Sugihara, T., Abe, N., Nomura, S., Masaki, Y., Wu, H. Y., Lin, W., Kinoshita, M., Yamada, Y., and NGHP Expedition 02 JAMSTEC Science Team: Examination of gas hydrate-bearing deep ocean sediments by X-ray Computed Tomography and verification of physical property measurements of sediments, Mar. Petro. Geol., 108, 239–248, https://doi.org/10.1016/j.marpetgeo.2018.05.033, 2019.
Hounsfield, G. N.: Computerized transverse axial scanning (tomography): Part 1. Description of system, Brit. J. Rad., 46, 1016–1022, https://doi.org/10.1259/0007-1285-46-552-1016, 1973.
Ikehara, K., Strasser, M., and Maeda, L.: IODP3 Expedition 503 “Hadal Trench Tsunamigenic Slip History” Scientific Prospectus, Proc. Int. Ocean Drill. Prog., 503, 1–18, https://doi.org/10.5194/piodp-503-1-2025, 2025.
IODP3 Depth Scale Terminology: https://iodp3.org/documents/iodp3-depth-scale-terminology/ (last access: 15 May 2026), 2025.
Kirkpatrick, J., Fulton, P., Ujiie, K., Conin, M., Regalla, C., Kodaira, S., Okutsu, N., Maeda, L., Toczko, S., Eguchi, N., Bellanova, P., Brown, C., Brunet, M., Castillo, M., Chang, Y.-C., Doan, M.-L., Everard, J., Fintel, A., Ford, J., Fukuchi, R., Gough, A., Guo, H., Gürer, D., Hackney, R., Hagino, M., Hamada, Y., Hosono, H., Ijiri, A., Ikari, M., Ishikawa, T., Iwai, M., Jeppson, T., Jurado, M.-J., Kamiya, N., Kanamatsu, T., LaPlante, A., Lin, W., Miyakawa, A., Morono, Y., Nakamura, Y., Nicholson, U., Okuda, H., Pei, P., Pizer, C., Rasbury, T., Robertson, R. V. M., Ross, C., Satolli, S., Savage, H., Schaible, K., Shreedharan, S., Sone, H., Sun, C., Turel, C., Uchida, T., Yamaguchi, A., Yamamoto, Y., Yoshimoto, T., Zhang, J., Wspanialy, A., Le Ber, E., Rydzy, M. B., and Schuba, N.: Expedition 405 methods, in: Tracking Tsunamigenic Slip Across the Japan Trench (JTRACK), edited by: Kodaira, S., Conin, M., Fulton, P., Kirkpatrick, J., Regalla, C., Ujiie, K., Okutsu, N., Maeda, L., Toczko, S., Eguchi, N., and the Expedition 405 Scientists, Proc. Int. Ocean Discov. Prog., 405, https://doi.org/10.14379/iodp.proc.405.102.2025, 2025.
Okuda, H.: Python script for XCT visualization on D/V Chikyu, Mendeley Data [code], https://doi.org/10.17632/dyb6t5b9gm.1, 2026.
Reilly, B. T., Stoner, J. S., and Wiest, J.: SedCT: MATLAB™ tools for standardized and quantitative processing of sediment core computed tomography (CT) data collected using a medical CT scanner, Geochem. Geophys. Geosyst., 18, 3231–3240, https://doi.org/10.1002/2017GC006884, 2017.
Strasser, M., Ikehara, K., Pizer, C., Itaki, T., Satoguchi, Y., Kioka, A., McHugh, C., Proust, J.-N., Sawyer, D., IODP Expedition 386 Expedition Management Team, and IODP Expedition 386 Expedition Science Party: Japan Trench event stratigraphy: First results from IODP giant piston coring in a deep-sea trench to advance subduction zone paleoseismology, Mar. Geol., 477, 107387, https://doi.org/10.1016/j.margeo.2024.107387, 2024.
Titschack, J., Baum, D., De Pol-Holz, R., López Correa, M., Forster, N., Flögel, S., Hebbeln, D., and Freiwald, A.: Aggradation and carbonate accumulation of Holocene Norwegian cold-water coral reefs, Sedimentology, 62, 1873–1898, https://doi.org/10.1111/sed.12206, 2015.
Titschack, J., Fink, H. G., Baum, D., Wienberg, C., Hebbeln, D., and Freiwald, A.: Mediterranean cold-water corals – an important regional carbonate factory?, Depo. Rec., 2, 74–96, https://doi.org/10.1002/dep2.14, 2016.
Tonai, S., Kubo, Y., Tsang, M-.Y., Bowden S., Ide, K., Hirose, T., Kamiya, N., Yamamoto, Y., Yang, K., Yamada, Y., Morono, Y., Heuer, V. B., Inagaki, F., and Expedition 370 Scientists: A new method for quality control of geological cores by X-ray computed tomography: application in IODP Expedition 370, Front. Earth Sci., 7, 117, https://doi.org/10.3389/feart.2019.00117, 2019.
Vandorpe, T., Collart, T., Cnudde, V., Lebreiro, S., Hernández-Molina, F. J., Alonso, B., Mena, A., Antón, L., and Van Rooij, D.: Quantitative characterisation of contourite deposits using medical CT, Mar. Geol., 417, 106003, https://doi.org/10.1016/j.margeo.2019.106003, 2019.
Williams, J. N., Toy, V. G., Massiot, C., McNamara, D. D., and Wang, T.: Damaged beyond repair? Characterising the damage zone of a fault late in its interseismic cycle, the Alpine Fault, New Zealand, J. Struct. Geol., 90, 76–94, https://doi.org/10.1016/j.jsg.2016.07.006, 2016.
Yamaguchi, A., Kitajima, H., and Okutsu, N.: IODP3 Expedition 502 “Impact of Petit-Spot Magmatism on Subduction Zone Seismicity and Global Geochemical Cycles” Scientific Prospectus, Proc. Int. Ocean Drill. Prog., 502, 1–11, https://doi.org/10.5194/piodp-502-1-2026, 2026.
Yan, Y. T., Chua, S., DeCarlo, T. M., Kempf, P., Morgan, K. M., and Switzer, A. D.: Core-CT: A MATLAB application for the quantitative analysis of sediment and coral cores from X-ray computed tomography (CT), Comput. Geosci., 156, 104871, https://doi.org/10.1016/j.cageo.2021.104871, 2021.
Zonta, R., Fontolan, G., Cassin, D., and Dominik, J.: X-ray Computed Tomography as a Tool for Screening Sediment Cores: An Application to the Lagoons of the Po River Delta (Italy), J. Mar. Sci. Eng., 9, 323, https://doi.org/10.3390/jmse9030323, 2021.