

the Creative Commons Attribution 4.0 License.
the Creative Commons Attribution 4.0 License.
 | 16 Oct 2026
A 500 m deep multipurpose research borehole and monitoring station in Delft, the Netherlands

Hemmo A. Abels
Auke Barnhoorn
Stijn Beernink
David Bruhn
Jens van den Berg
Alexandros Daniilidis
Anne-Catherine Dieudonné
Guy Drijkoningen
Pieter Geris
Ties de Jong
Pauline Kruiver
Susanne Laumann
Dirk Munsterman
Erika Neeft
Pieter Pauw
Tobias Schmiedel
Evert Slob
Liliana Vargas Meleza
Denis Voskov
Kees Wapenaar
The 500 m deep DAPGEO-02 multifunctional research borehole and monitoring station was drilled in Delft in spring 2022. Dinoflagellate biostratigraphy reveals that the borehole goes through the Neogene Upper North Sea Group, including the Waalre, Maassluis, Oosterhout, Diessen, and Groot Heide formations. Below, a stratigraphic gap exists between the late Miocene Diessen and the middle Miocene Groote Heide formations, followed by a much larger gap between the Groote Heide and the lower Eocene Dongen formations. The Dongen is preceded by the Landen Formation, and the borehole ends in marl of the Danian to possibly Upper Cretaceous Ommelanden Formation. The drilling had an extensive coring programme using the Smet coring system sampling in PVC core liners and Shelby tubes with a total of around 75 m of recovered core. Core shoe samples were taken where possible, and cuttings were taken every metre. The downhole logging programme included short and normal resistivities, spontaneous potential, induced polarisation, single-point resistance, electromagnetic induction, deviation, total and spectral gamma ray, full waveform sonic, P- and S-wave suspension, acoustic borehole imaging, and nuclear magnetic resonance. The borehole makes up the central location of a seismic-monitoring station with the lower 70 m uncased and equipped with geophones. These three-component geophones at 440 and 490 m depth are accompanied by an immediately adjacent 200 m deep borehole with geophones every 50 m depth and two orthogonally oriented 100 m laterally offset boreholes, each with a single geophone at 50 m depth. Optical fibres laterally connect the boreholes and are also placed in the 50 and 200 m boreholes. DAPGEO-02 has several scientific aims, including the detection and characterisation of any seismicity from nearby geothermal projects, as well as an investigation of the subsurface properties and the changes therein, providing material to allow an investigation of the impact of heterogeneity on high-temperature storage and an investigation into the hydro-chemo-mechanical properties of the Neogene and Paleogene clays. The data from this borehole are publicly available at the 4TU data repository, and physical sample requests can be made.
- Article
(13749 KB) - Full-text XML
- BibTeX
- EndNote


A geothermal project with joint scientific and heat production aims is being installed on and around the Delft University of Technology campus, Delft, the Netherlands (Vardon et al., 2020). The project aims at having a geothermal doublet producing heat from an Early Cretaceous sedimentary sandstone reservoir with an unprecedented level of instrumentation and data collection. This includes a fibre-optic measurement suite, a comprehensive logging and coring programme, and an extensive monitoring network.
As part of this monitoring network, a local seismic-monitoring network has been installed, shown in Fig. 1. This network comprises four stations that include instrumentation, the majority of which is geophones, at up to 500 m depth designed to detect and locate seismic events. The most southerly station, named ZH03, has been installed and equipped by the Royal Netherlands Meteorological Institute (KNMI), who operate the national seismic network (KNMI, 1993). Two other stations, named DAPGEO-01 and DAPGEO-03, have been installed and equipped by Delft University of Technology. The fourth station, named DAPGEO-02, which is the subject of this paper, is made up of a series of different depth boreholes, with the deepest being ∼ 500 m, with a detailed wireline logging data set collected and coring programme executed during installation, addressing a series of scientific ambitions, schematically outlined in Fig. 2. Of the seismic stations, it has the most comprehensive sensing equipment installed, including geophones, an accelerometer, and an orthogonally installed fibre-optic cable. The geophones and accelerometer are also connected to the KNMI national seismic network as station ZH08. A factual report on the installation is available in Vardon et al. (2022; https://doi.org/10.4233/uuid:fde70c00-cf65-4174-9cd3-89585a5e61bd), and the objective of this paper is to further detail the objectives, choices, and initial results of the drilling.
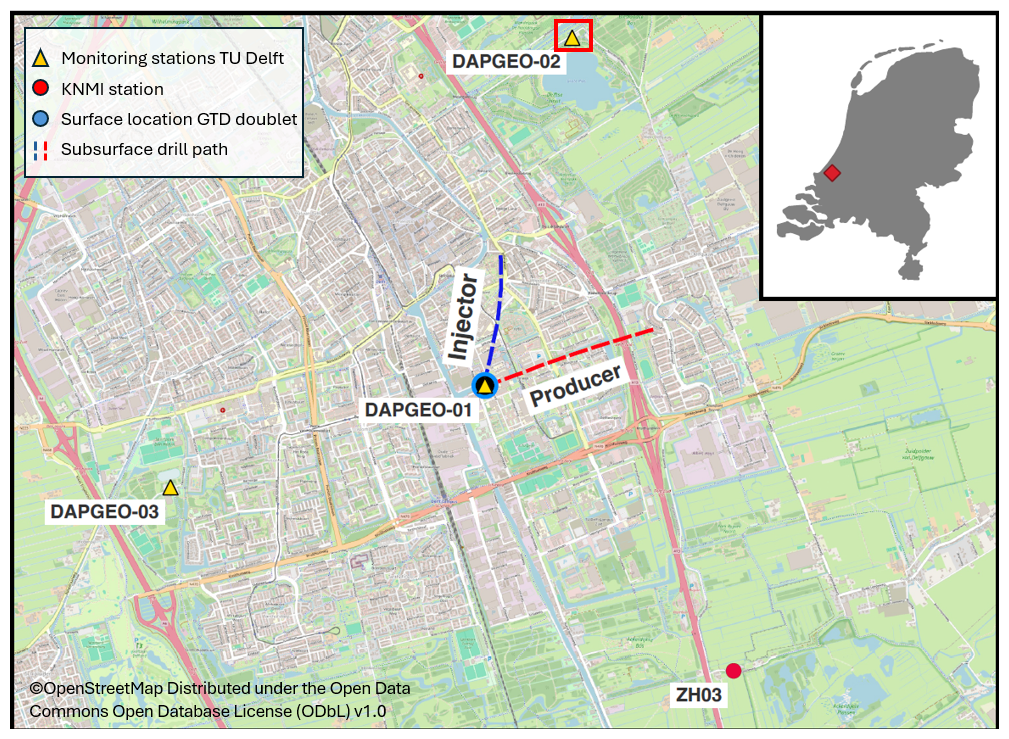
Figure 1Locations of seismic-monitoring stations for the geothermal doublet on the TU Delft campus (central). The insert gives the location of Delft in the Netherlands. The red rectangle represents the area shown in Fig. 3a (base maps © OpenStreetMap, distributed under the Open Data Commons Open Database License (ODbL) v1.0 (for further information, please see https://www.openstreetmap.org/copyright/en, last access: 10 August 2026)).
DAPGEO-02 was originally conceived as a research seismic-monitoring station accompanying the geothermal project on the Delft University of Technology campus. It is located in a relatively noisy urban environment; hence it was designed to be as deep as possible to reduce the impact of surface noise while staying within legal and practical limits of under 500 m deep. A major part of the scientific aims of the geothermal project was to collect information and cores of the full lithostratigraphic column from the Early Cretaceous reservoir to the Quaternary top. These activities were originally planned to take place in one of the two geothermal wells at TU Delft campus, but moving some of the coring and logging programme to the separate monitoring station DAPGEO-02 offered substantial cost and risk efficiencies, while having a limited horizontal offset.
The aims for DAPGEO-02 were to
-
enable monitoring of induced seismicity during long-term deep geothermal operations;
-
improve characterisation of formation properties, in particular geomechanical and thermal properties, via the petrophysical log response and the regional geological understanding;
-
investigate the properties of the subsurface for geo-energy applications, such as high-temperature aquifer thermal energy storage (HT-ATES) and radioactive waste disposal;
-
sample and measure the North Sea Group sediments for curiosity-driven research.
DAPGEO-02 consists of four boreholes and a fibre-optic installation, as schematically shown in Fig. 2, with the site layout shown in Fig. 3. The installation comprised the following.
-
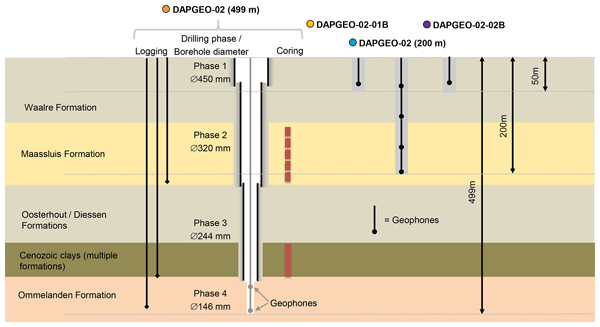
The deepest borehole DAPGEO-02 (499 m): where the majority of the data collection activities were focused and which is the main subject of this paper. Drilling was undertaken between February and May of 2022 by the SMET Group. Rotary direct circulation drilling was used, and this borehole was drilled in four phases, with details shown below.
-
Phase 1: final depth 43 m below ground level (b.g.l.), 450 mm borehole diameter, 406 mm casing diameter. Data collection activities: cuttings collection.
-
Phase 2: final depth 230 m b.g.l., 320 mm borehole diameter, 273 mm casing diameter. Data collection activities: cuttings collection, coring, logging.
-
Phase 3: final depth 427 m b.g.l., 244 mm borehole diameter, 168 mm casing diameter. Data collection activities: cuttings collection, coring, logging.
-
Phase 4: final depth 499 m b.g.l., 146 mm borehole diameter, uncased. Data collection activities: cuttings collection, logging, geophone installation.
-
-
DAPGEO-02 (200 m): final depth 200 m b.g.l. Drilling was undertaken in February 2022 by Rossingh Drilling. Flush rotary drilling was used with a 6 in. (152 mm) borehole diameter. A limited logging campaign was carried out, and geophones were installed. Cuttings were used for lithological description only and not preserved due to the anticipated high level of mixing in flush drilling.
-
DAPGEO-02-01B and DAPGEO-02-02B: final depth 50 m b.g.l. Drilling was undertaken in February 2022 by Rossingh Drilling. Flush rotary drilling was used with a 6 in. (152 mm) borehole diameter. A single geophone was installed in each. Cuttings were used for lithological description only and not preserved.
-
Single-mode optical fibres were installed to enable distributed acoustic sensing (DAS) in and between DAPGEO-02 (200 m) and both DAPGEO-02-01B and DAPGEO-02-02B, in an “L” shape. These optical fibres are in both a straight and helically wound geometry. The fibre-optic cable was also attached to the geophone cables at 100 m b.g.l. of DAPGEO-02 (200 m) and at full depth of DAPGEO-02-01B and DAPGEO-02-02B.
During drilling, borehole condition and drilling fluids were monitored by the drilling company. Drilling fluids were based on fresh water with limited additives to improve drilling performance and ensure a slight overpressure. No borehole stability issues were reported, indicating stable conditions throughout. All boreholes were grouted to surface after drilling, research activities, and geophone installation, with surface equipment installed in a small cabinet.
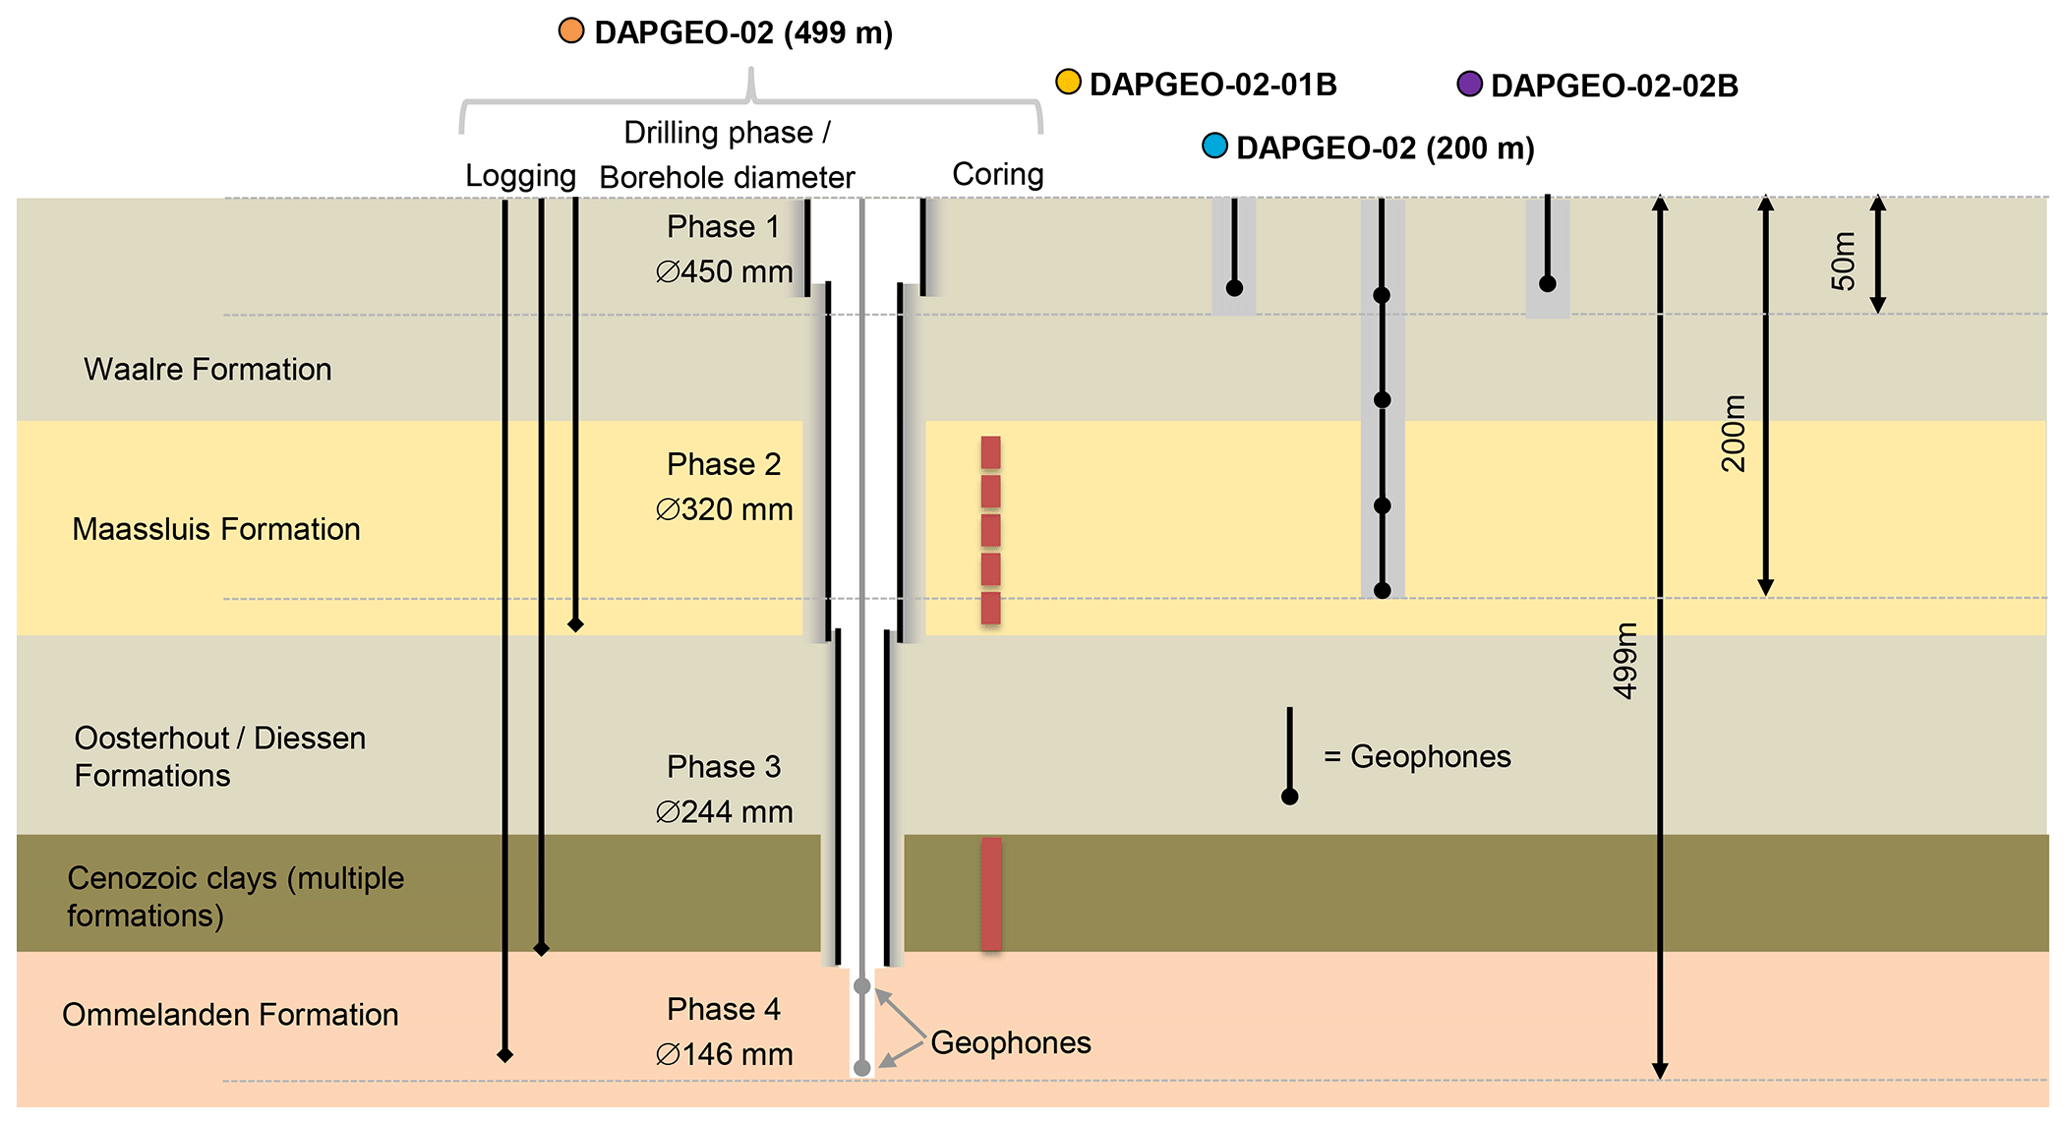
Figure 2Schematic of activities in DAPGEO-02, including the drilling phases, logging campaigns, and coring. See Fig. 3 for a site overview of the borehole locations.
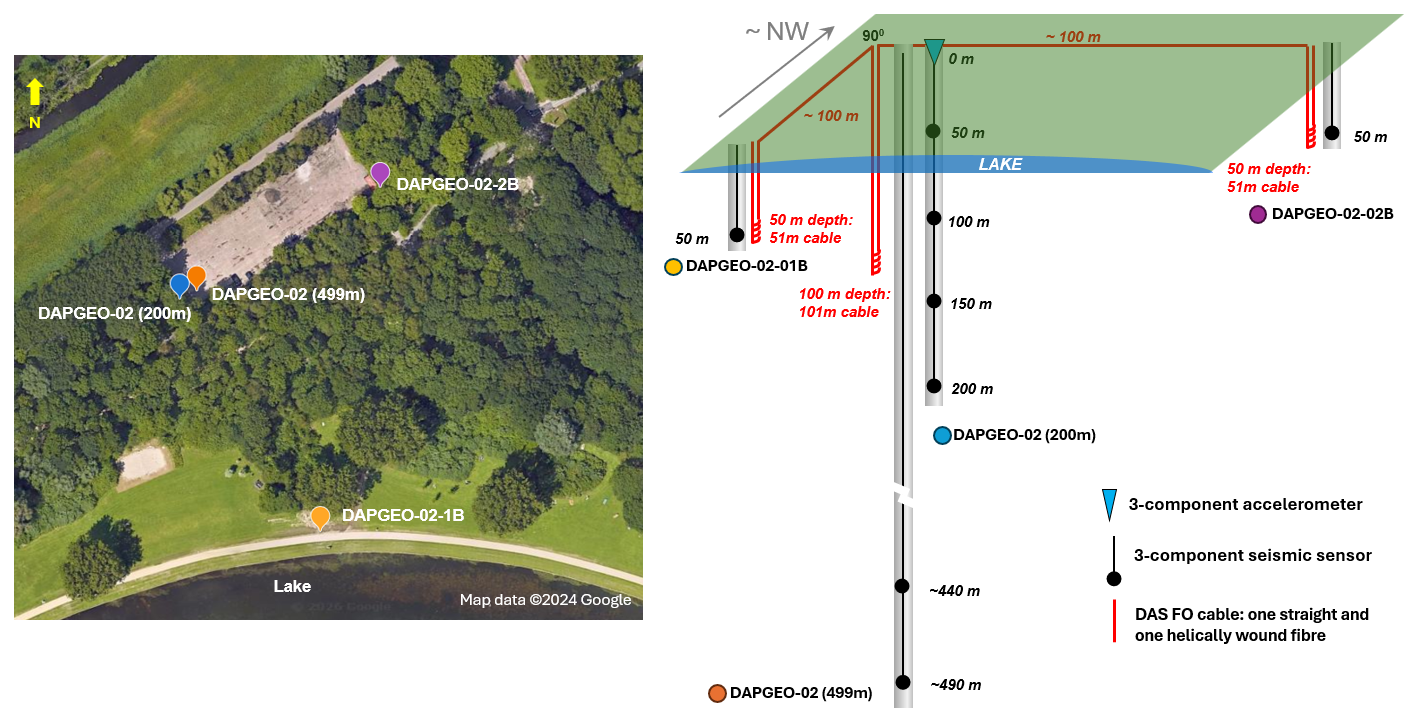
Figure 3Location of boreholes, geophones, and fibre-optic cable of DAPGEO-02 in Delft, the Netherlands (left); location corresponds to the red rectangle in Fig. 1 (map data ©2024 Google). Schematic layout of geophones and fibre-optic cable (DAS) at the site (right).
3.1 Cutting samples
In DAPGEO-02 (200 m), cutting samples were all described by Rossingh Drilling, which provided the lithological information needed to couple to other measurements, such as coring and well logging. As these were taken using flush rotary drilling, which is less controlled than rotary drilling, these were not preserved. In DAPGEO-02 (499 m), cutting samples were recovered from the ground surface until 430 m b.g.l. at 1 m intervals and at 4 m intervals from 430 to 498 m depth. Samples were taken by filling a bucket with drilling fluid returning from the well. A total of 477 samples were collected and transported to TU Delft, where they were dried and stored in a dedicated storage room located in the basement of the Civil Engineering and Geoscience (CEG) faculty building (Stevinweg 1, 2628 CN Delft); see Vardon et al. (2022) for a list of the samples. Labelling was produced on site identifying the date, location, a unique ID, depth below surface, and the individual taking the sample. Quality control was undertaken by TU Delft during the drilling process.
3.2 Cores
3.2.1 Coring method
Coring was focused on two main stratigraphic zones; see Fig. 2 for an overview. Firstly, during Phase 2 of the drilling, the Neogene Upper North Sea Group below the Waalre Formation was targeted. These sediments are the target of a technology known as high-temperature aquifer thermal energy storage (HT-ATES), with the Maassluis Formation being the primary target. The underlying Oosterhout Formation was planned to be cored if reasonably thick sand layers were encountered; however, during drilling, sufficiently thick sand layers were not found in the Oosterhout Formation; therefore no cores were taken. Secondly, during Phase 3 of the drilling, the Cenozoic clays were targeted, which can act as a cap rock for heat-storage projects and are of interest to unravel static and dynamic characteristics of clays at different depths. This needs to be known, for example, for radioactive waste disposal in such clay formations (Neeft et al., 2024; Hades lab, 2026). It should be noted that a priori the drilling location was known to be not suitable for the disposal of radioactive waste because of the thin clay formations present and was targeted to only provide material at a representative disposal depth for high-level waste.
Table 1Overview of coring undertaken: intervals, core types, and number.
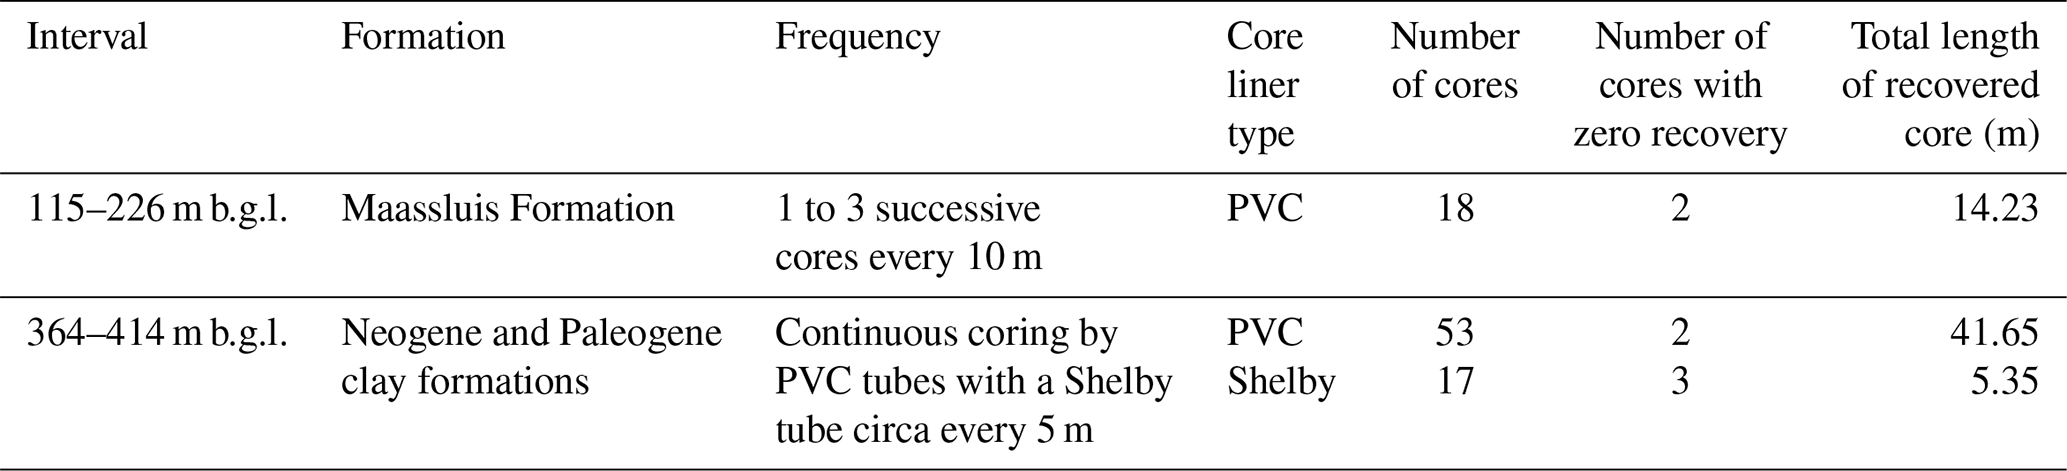
In both intervals, avoiding disturbance of the cores (mechanically, chemically, and hydrologically) was a key design consideration. The unconsolidated sands of the Maassluis Formation and the poorly indurated (plastic) Cenozoic clays could both be substantially disturbed using typical rotary coring. Therefore, a push and over-drill system, called the SMET coring system (SCS), was used. This allows either a thin-walled steel tube, known as a Shelby tube (0.55 m long), or a steel core barrel with an internal PVC tube (1.0 m long) to be pushed into the formation. Both sampling tubes had an internal diameter of 100 mm. Due to the depth and formation properties, we used a thicker wall than in standard Shelby tubes, i.e. 3 mm thick, to avoid mechanical deformation of the Shelby tube. After pushing, the formation is drilled around the pushed core barrel or Shelby tube to relieve the stress and allow the removal of the core via wireline. This process is designed to minimise the contact of the core with the drilling fluid and maintains in situ stresses as far as possible with the least amount of mechanical alteration of the sediments as possible.
The Shelby tubes have a lower wall thickness than the core barrel with PVC tubes and therefore a lower sample disturbance. The core barrel with PVC liner was preferred for sandy formations as a slightly undersized coring shoe was used to stop the core leaving the barrel, which provides a lower disturbance in unconsolidated sands than a core-catcher mechanical device. A combination of the two methods was used to allow a longer total cored interval at a reasonable cost through both sandy and clayey formations. Originally coring was also planned in the Ommelanden Formation, starting at ∼420 m b.g.l., in order to investigate possible secondary permeability; however, due to the discovery of dissolved gas and slightly artesian conditions, this was removed from the programme of activities.
3.2.2 Recovery and storage
A total of 18 cores consisting of unconsolidated deposits were taken between 115 and 226 m depth in the Maassluis Formation. This coring was all done with the SCS in PVC core liners. During coring, the starting and ending depth was automatically monitored by the drilling rig. The drilled length varied between 0.64 and 1 m. Of the total of 18 cores, 14 cores had more than 75 % core recovery, meaning that more than 75 cm of the 1 m core barrel was filled. The percentage of core recovery was measured in the bottom of the core after drilling with a measuring ruler. Four cores, situated below each other between 146 and 166 m depth, had less than 33 % core recovery, of which the two deepest cores had zero recovery of drilled material. Poor recovery was thought to be related to failed or poor core retention, i.e. loose material falling out of the core barrel, and to stiff formations, which required multiple pushes from the drill rig. The number of pushes of the drilling rig that were needed for 1 m of core varied between 1 in a clayey core at 190 m depth and 262 in a coarse sandy core at 166 m depth. For the latter, coring was stopped at 72 % recovery.
Between 362 and 415 m depth a total of 69 cores were collected, including 17 with Shelby tubes, with the others using the core barrel and PVC tubes. Cored deposits from this interval date to the Neogene and Paleogene. Coring was deemed impossible with the push-in coring system below 415 m depth (due to formation stiffness) and was difficult in a series of intervals above that. The first three Shelby tubes were thin-walled, after which thick-walled tubes were used due to deformation of the thin-walled tubes.
The number of pushes required to core a 1 m interval with the SCS system was highly dependent on the lithology. In the clayey Diessen Formation, one push often sufficed, whereas the sandy Oosteind Member required an average of 36 pushes per 1 m interval. In the lower Landen Formation (407–415 m b.g.l.), an average of 25 pushes yielded approximately 52 cm of cored formation. The Shelby tube system was used selectively, based on indications of clay presence from the core shoes. All but one core sample taken with this system were obtained with a single push, indicative of both the clay formation properties and due to the thin wall of the Shelby tube.
Some core samples show recovery of up to 20 % more than the cored length. In the sandy core samples, this is attributed mainly to the reorganisation of grains due to the stress relief, often accompanied by visible, coring-induced fractures. For pushed-in core samples in clay, it is also not uncommon to have recovery rates above 100 %, which is mainly attributed to stress relief of the cored material and to mechanical deformation immediately below the sampler, where a larger zone of the formation can be displaced by the sampler than the internal area of the sampler (Monforte et al., 2022), meaning more material may enter the sampler than strictly the inner area of the sampler. In addition, material from either the borehole wall or previous cores may fall to the base of the borehole during the transport of the core to the surface and following run-in of the coring tool. This is easily identifiable in the CT scans detailed below. Table 1 provides an overview of the number of cores collected in the two intervals.
Core sealing and low-temperature core storage were used for all retrieved cores to limit oxidation, microbial activity, and drying of the sands and clays, which could substantially impact their characteristics and behaviour. Therefore, both the Shelby tubes and the PVC core liners were sealed, first by filling any void at the ends of the core barrel with an inert sand, then adding low-melting-temperature paraffin. After applying end caps and labelling the core barrel, they were further sealed with a higher-melting-temperature polymer, which is less susceptible to cracking and is stronger. The cores were then transported to the laboratory in a vertical orientation, with the cores from the Cenozoic vacuum sealed in composite aluminium–plastic bags and both sets of cores stored vertically at 4 °C. The cores were labelled on the core barrel and outside of the sealing packaging of the core.
During coring with the SCS system, a core shoe is used with a diameter which is slightly less than the inner diameter of the PVC, which is a tube through which the soil is pushed into the PVC core liner. The core shoe width varied between 93 and 96 mm, depending on the expected soil expansion. The material remaining in the core shoe after retrieval of the core was collected, described, and then stored in containers without extra measures for preservation. These samples are used for analyses that do not require preservation measures (e.g. grain size analysis and palynology).
3.2.3 Processing
All core samples were scanned at the TU Delft using a macro-CT scanner (Siemens Somatom Volume Zoom CT scanner), using a voltage of 140 kV and an exposure of 250 mAs. The scans produced CT slices perpendicular to the core axis, with 512 × 512 voxels, covering a 120 mm × 120 mm area. Each voxel measures 0.234 mm × 0.234 mm, with a 0.6 mm spacing between slices. After scanning, data were processed according to two procedures: “normal' and “extended”. The normal procedure used the standard greyscale settings of medical scanners of −1000 to +3000 HU. In the scanned samples, sediments were obtained that exceeded the 3000 HU scale. Therefore, the extended scale was also produced ranging from −10 000 to +30 000 HU in steps of 10 HU each. The raw CT-scan data and processed images (i.e. vertical cross-sections) are publicly available (Vardon et al., 2023b) and can be downloaded from https://doi.org/10.4121/21528819.
CT-scan data were visualised and interpreted based on the principle that higher-density materials produce greater attenuation coefficients and thus higher CT numbers (e.g. Tanaka et al., 2011; de Jong et al., 2025), enabling the assessment of lithological changes and core sample integrity (with a selection shown in Fig. 4). Core samples in Shelby tubes were also scanned (Fig. 4e), although the steel casing affects CT numbers, and internal structures are only partially visible.
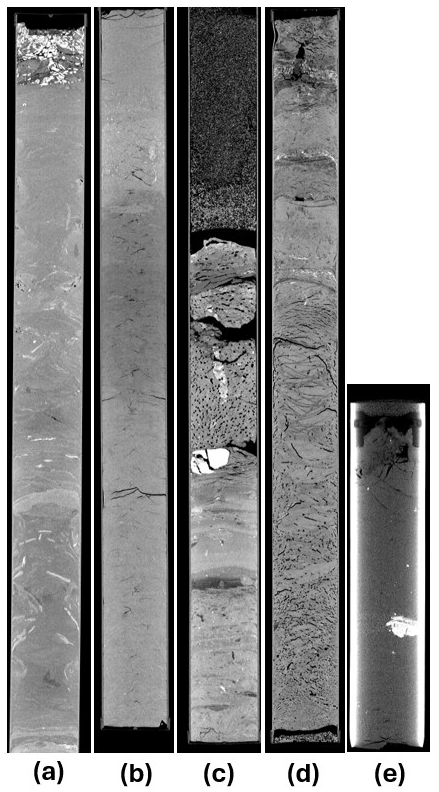
Figure 4Selection of CT scans of core material. Visualisations are made with a greyscale ranging from 450 to 1600 HU (a–d) or 1500 to 3000 HU (e). The cores and corresponding top depths are (a) DAPGEO-02-C6 – 136.0 m b.g.l., (b) DAPGEO-02-C45 – 387.9 m b.g.l., (c) DAPGEO-02-C55 – 391.2 m b.g.l., (d) DAPGEO-02-C64 – 398.6 m b.g.l., and (e) DAPGEO-02-C70 – 402.6 m b.g.l.
3.2.4 Core integrity
The CT scans are useful to assess core quality prior to core extraction and testing. Deformation due to the drilling process of the Maassluis Formation cores is observed mainly at the top and bottom and edges of the cores. Wedges of higher density reveal the compressive forces that acted on the sides of the core due to the pushes of the drilling rig. In addition, the top ∼ 5 cm of the core is often filled with very coarse material seemingly consisting of gravel and shells (Fig. 4a). These materials likely fell down in the borehole in the period between stopping the destructive drilling and the start of the coring.
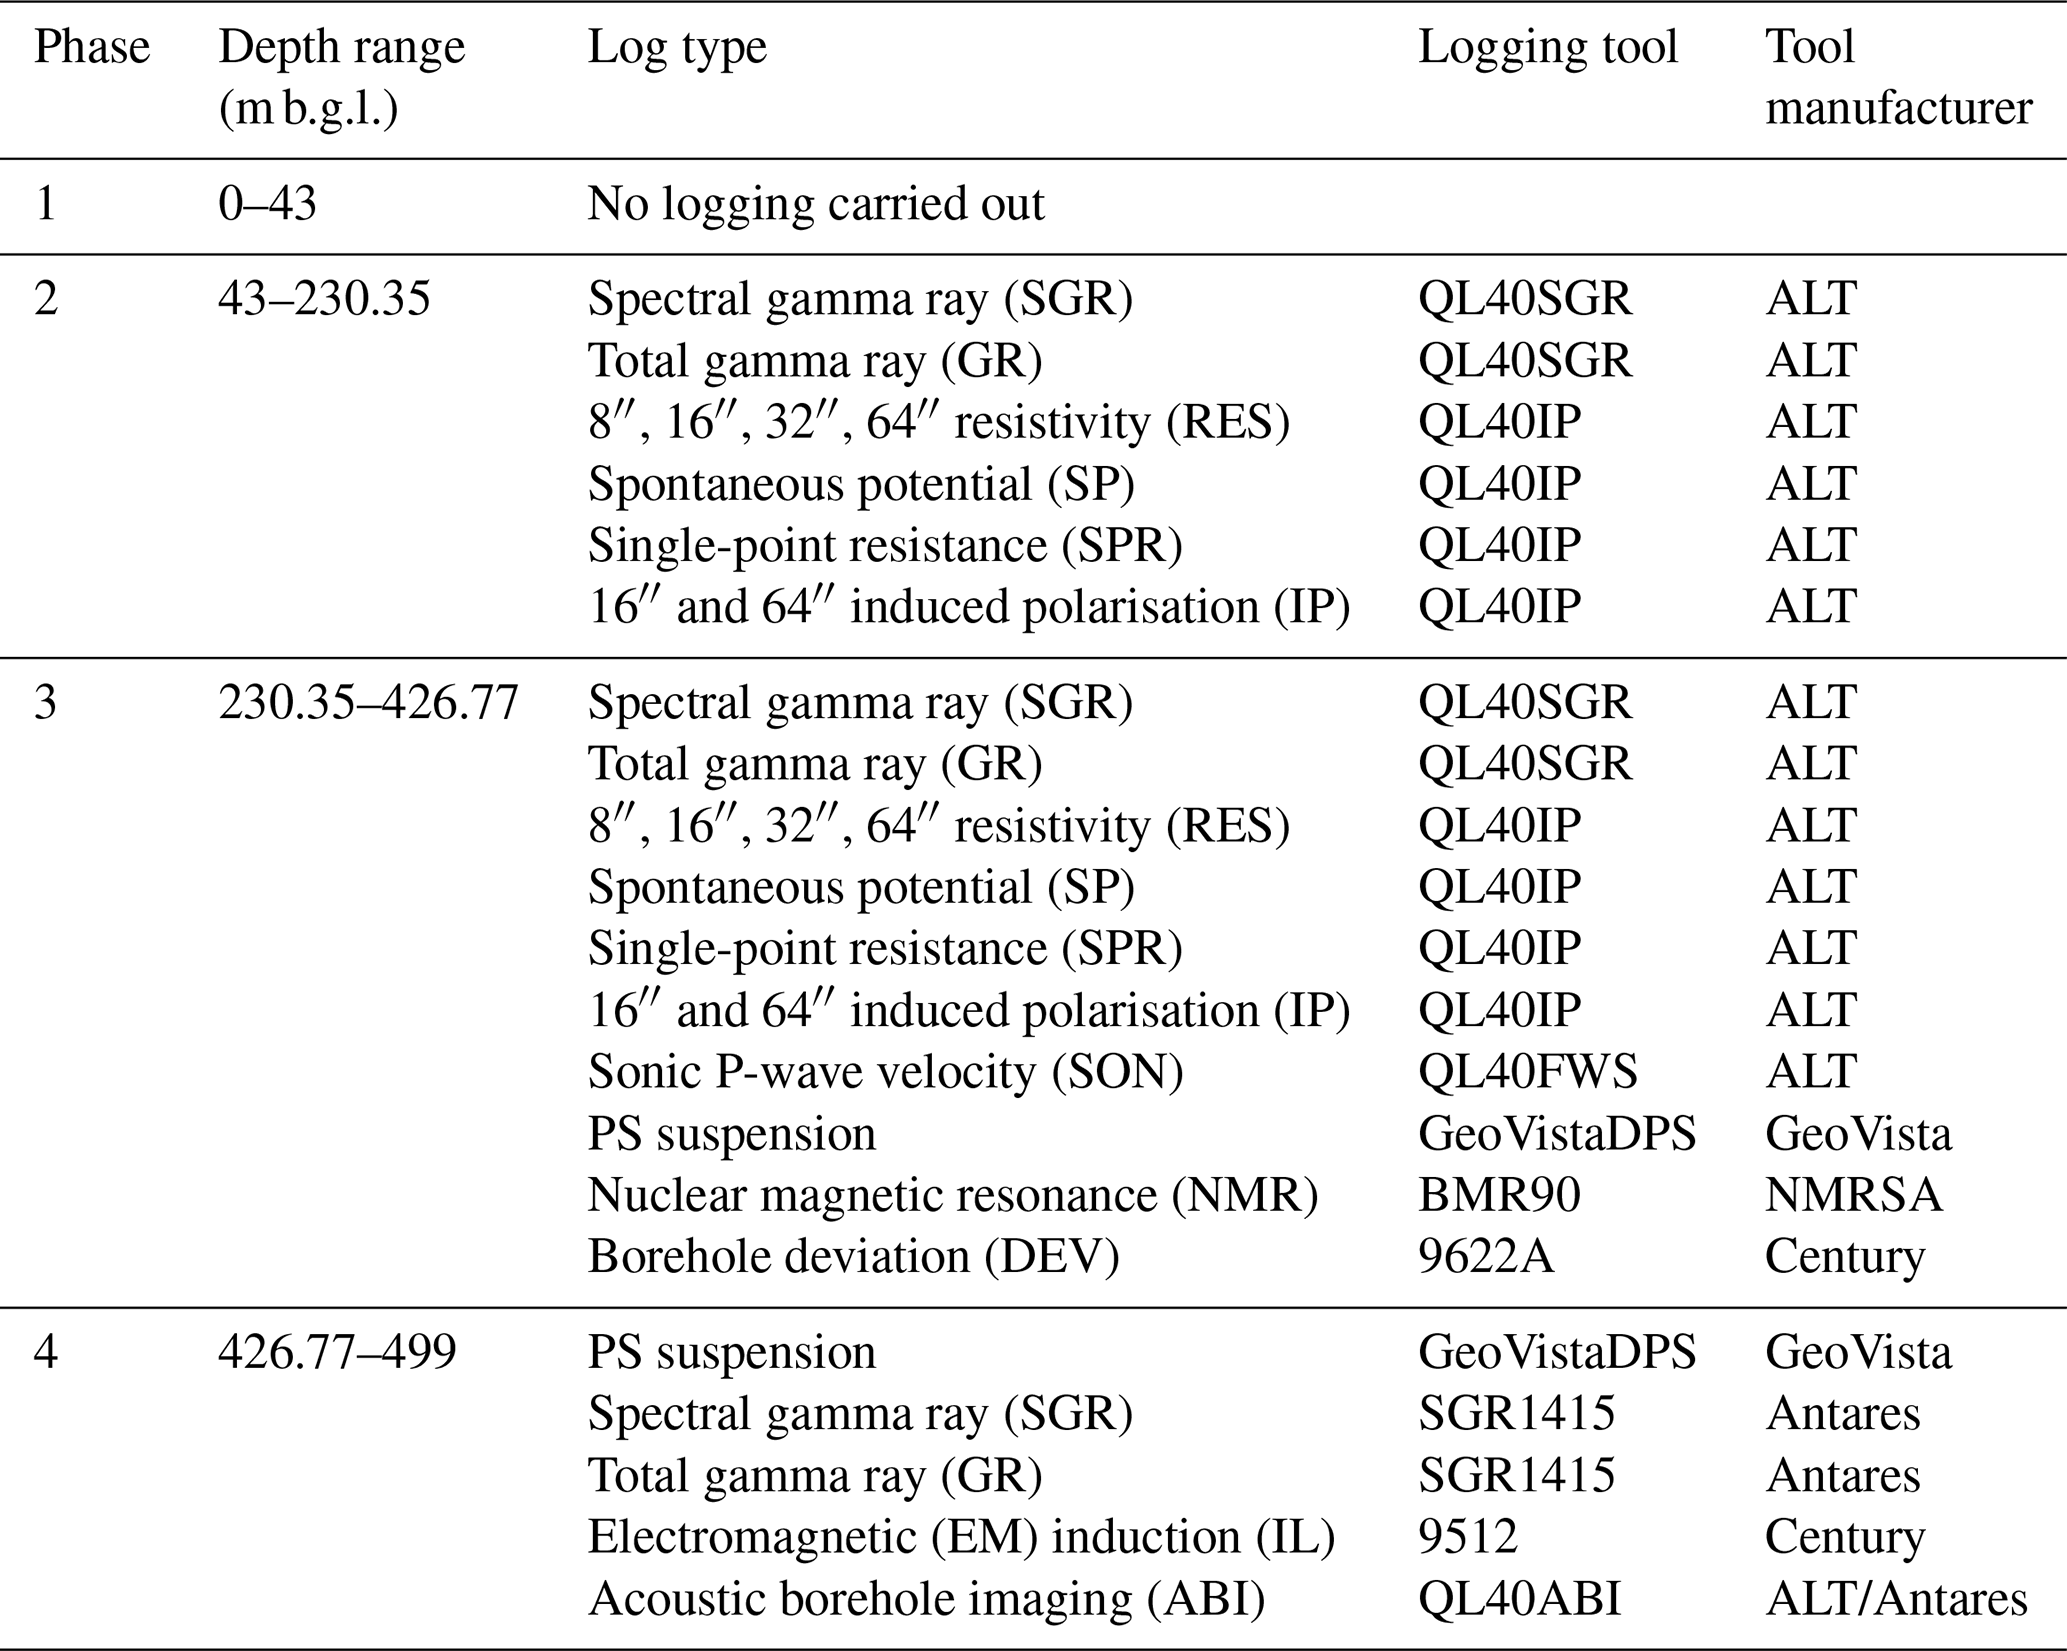
Table 2Overview of well logging in the drilling phases: log types, tools, and tool manufacturers.
Some of the CT scans of the cores containing Neogene and Paleogene clays showed coring-induced artefacts such as shear zones (∼1 cm wide) around the tube and conical fracture patterns (e.g. as shown in Fig. 4b), as also found by Adriaens et al. (2024) using the same SCS system. There is a clear relation between the integrity of the core material and the number of pushes needed to push the material in the sampler. In the more clayey parts of the stratigraphy, which required only a single push, little coring-induced disturbance is visible, while the stiffer or more sandy parts of the formations requiring more pushes showed more fractures and shearing. In the lower part of the series, symmetrically distributed bubbles in the cores seem to point to degassing of the pore fluids during or after coring, possibly during lifting to the surface (Fig. 4c). This could be methane or CO2 formation gas. Distinct fracture patterns are visible in core material belonging to the Oosteind Member (Fig. 4d) and are attributed to degassing and not necessarily caused by coring-induced stresses. Some cores show upward-arching contacts at the liner, caused by shearing between the core material and the liner (Fig. 4d).
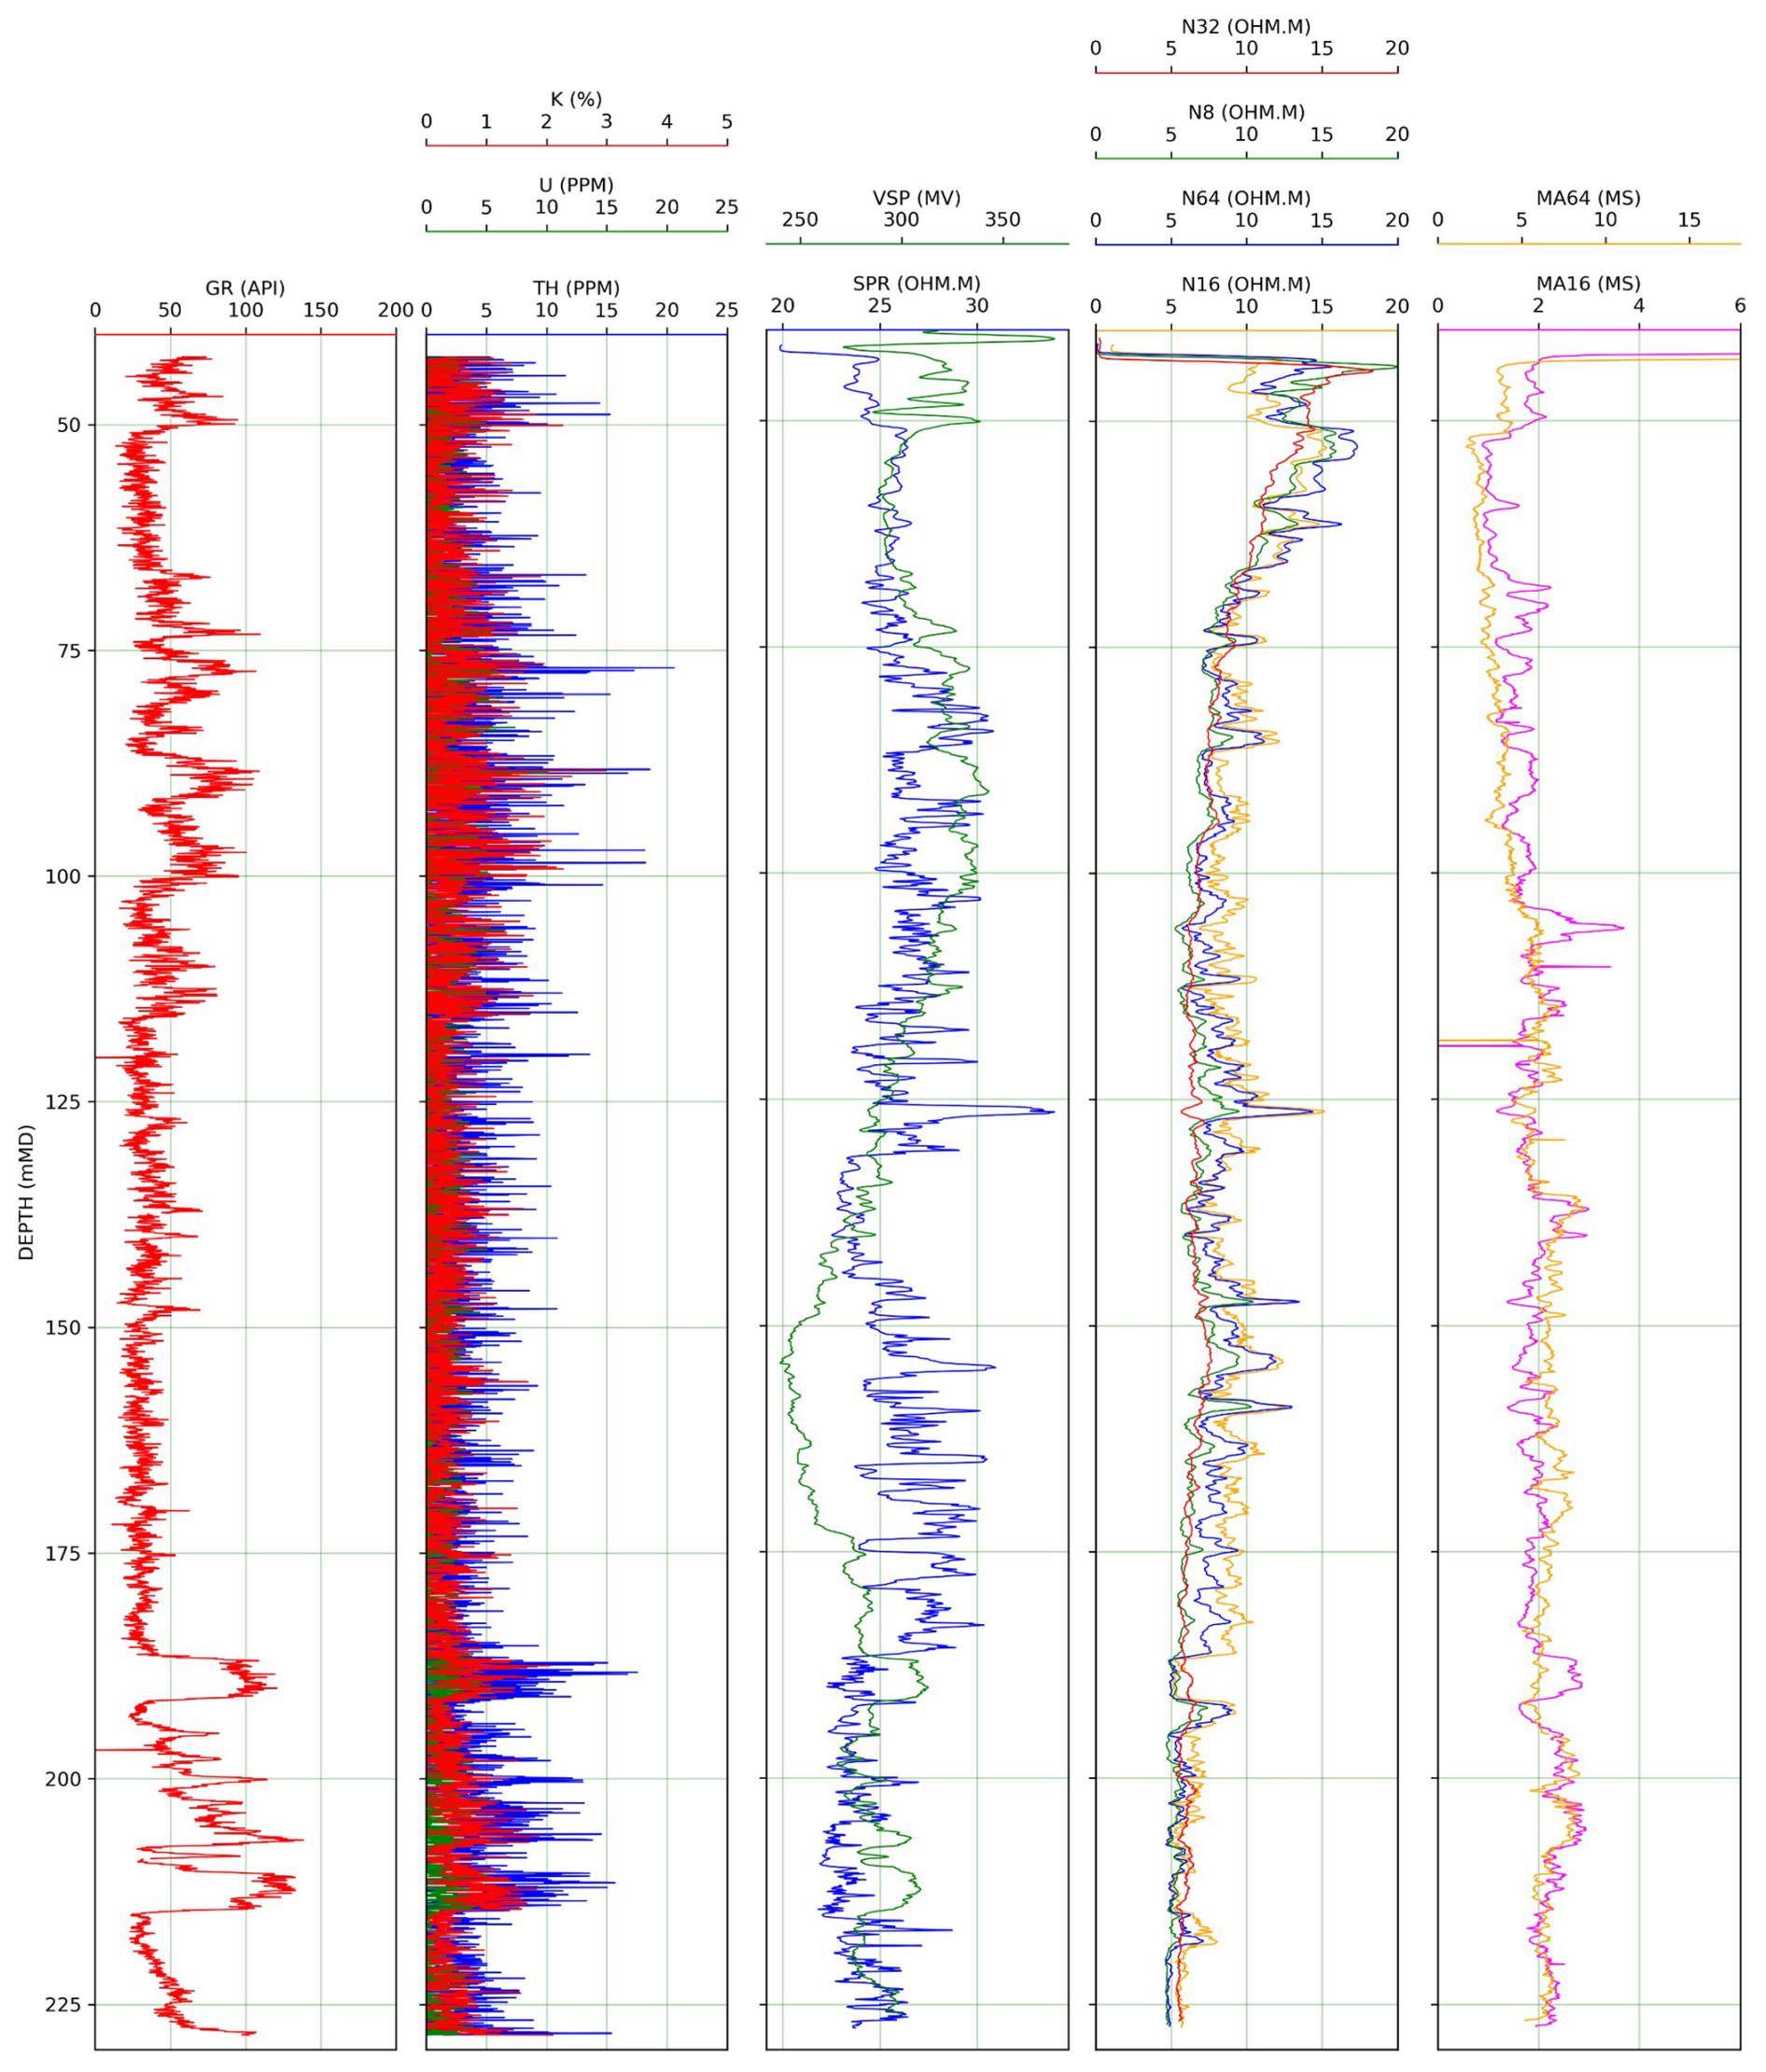
Figure 5DAPGEO-02 wireline logs collected in Phase 2. From left to right: gamma ray (GR); potassium (K), uranium (U), and thorium (TH); spontaneous potential (VSP) and single-point resistance (SPR); 8′′, 16′′, 32′′, and 64′′ components of electrical resistivity (RES); 16′′ and 64′′ components of induced polarisation (IP). Raw data available from Vardon et al. (2023a).
Logging was undertaken via wireline after drilling in two of the boreholes. A total gamma ray log was taken in DAPGEO-02 (200 m) in order to initially plan coring and confirm casing planning for the deeper DAPGEO-02 (499 m). This is not reported due to the lower borehole quality anticipated due to the flush-drilling technique. A more comprehensive logging suite was carried out in DAPGEO-O2 (499 m) which is reported below. No monitoring while drilling logs was performed.
The geophysical well logging activities were carried out by Deltares during the drilling phases (Phases 2, 3, and 4) of the DAPGEO-O2 (499 m) borehole, covering a depth range between 230 m and 495 m b.g.l., as described in Table 2.
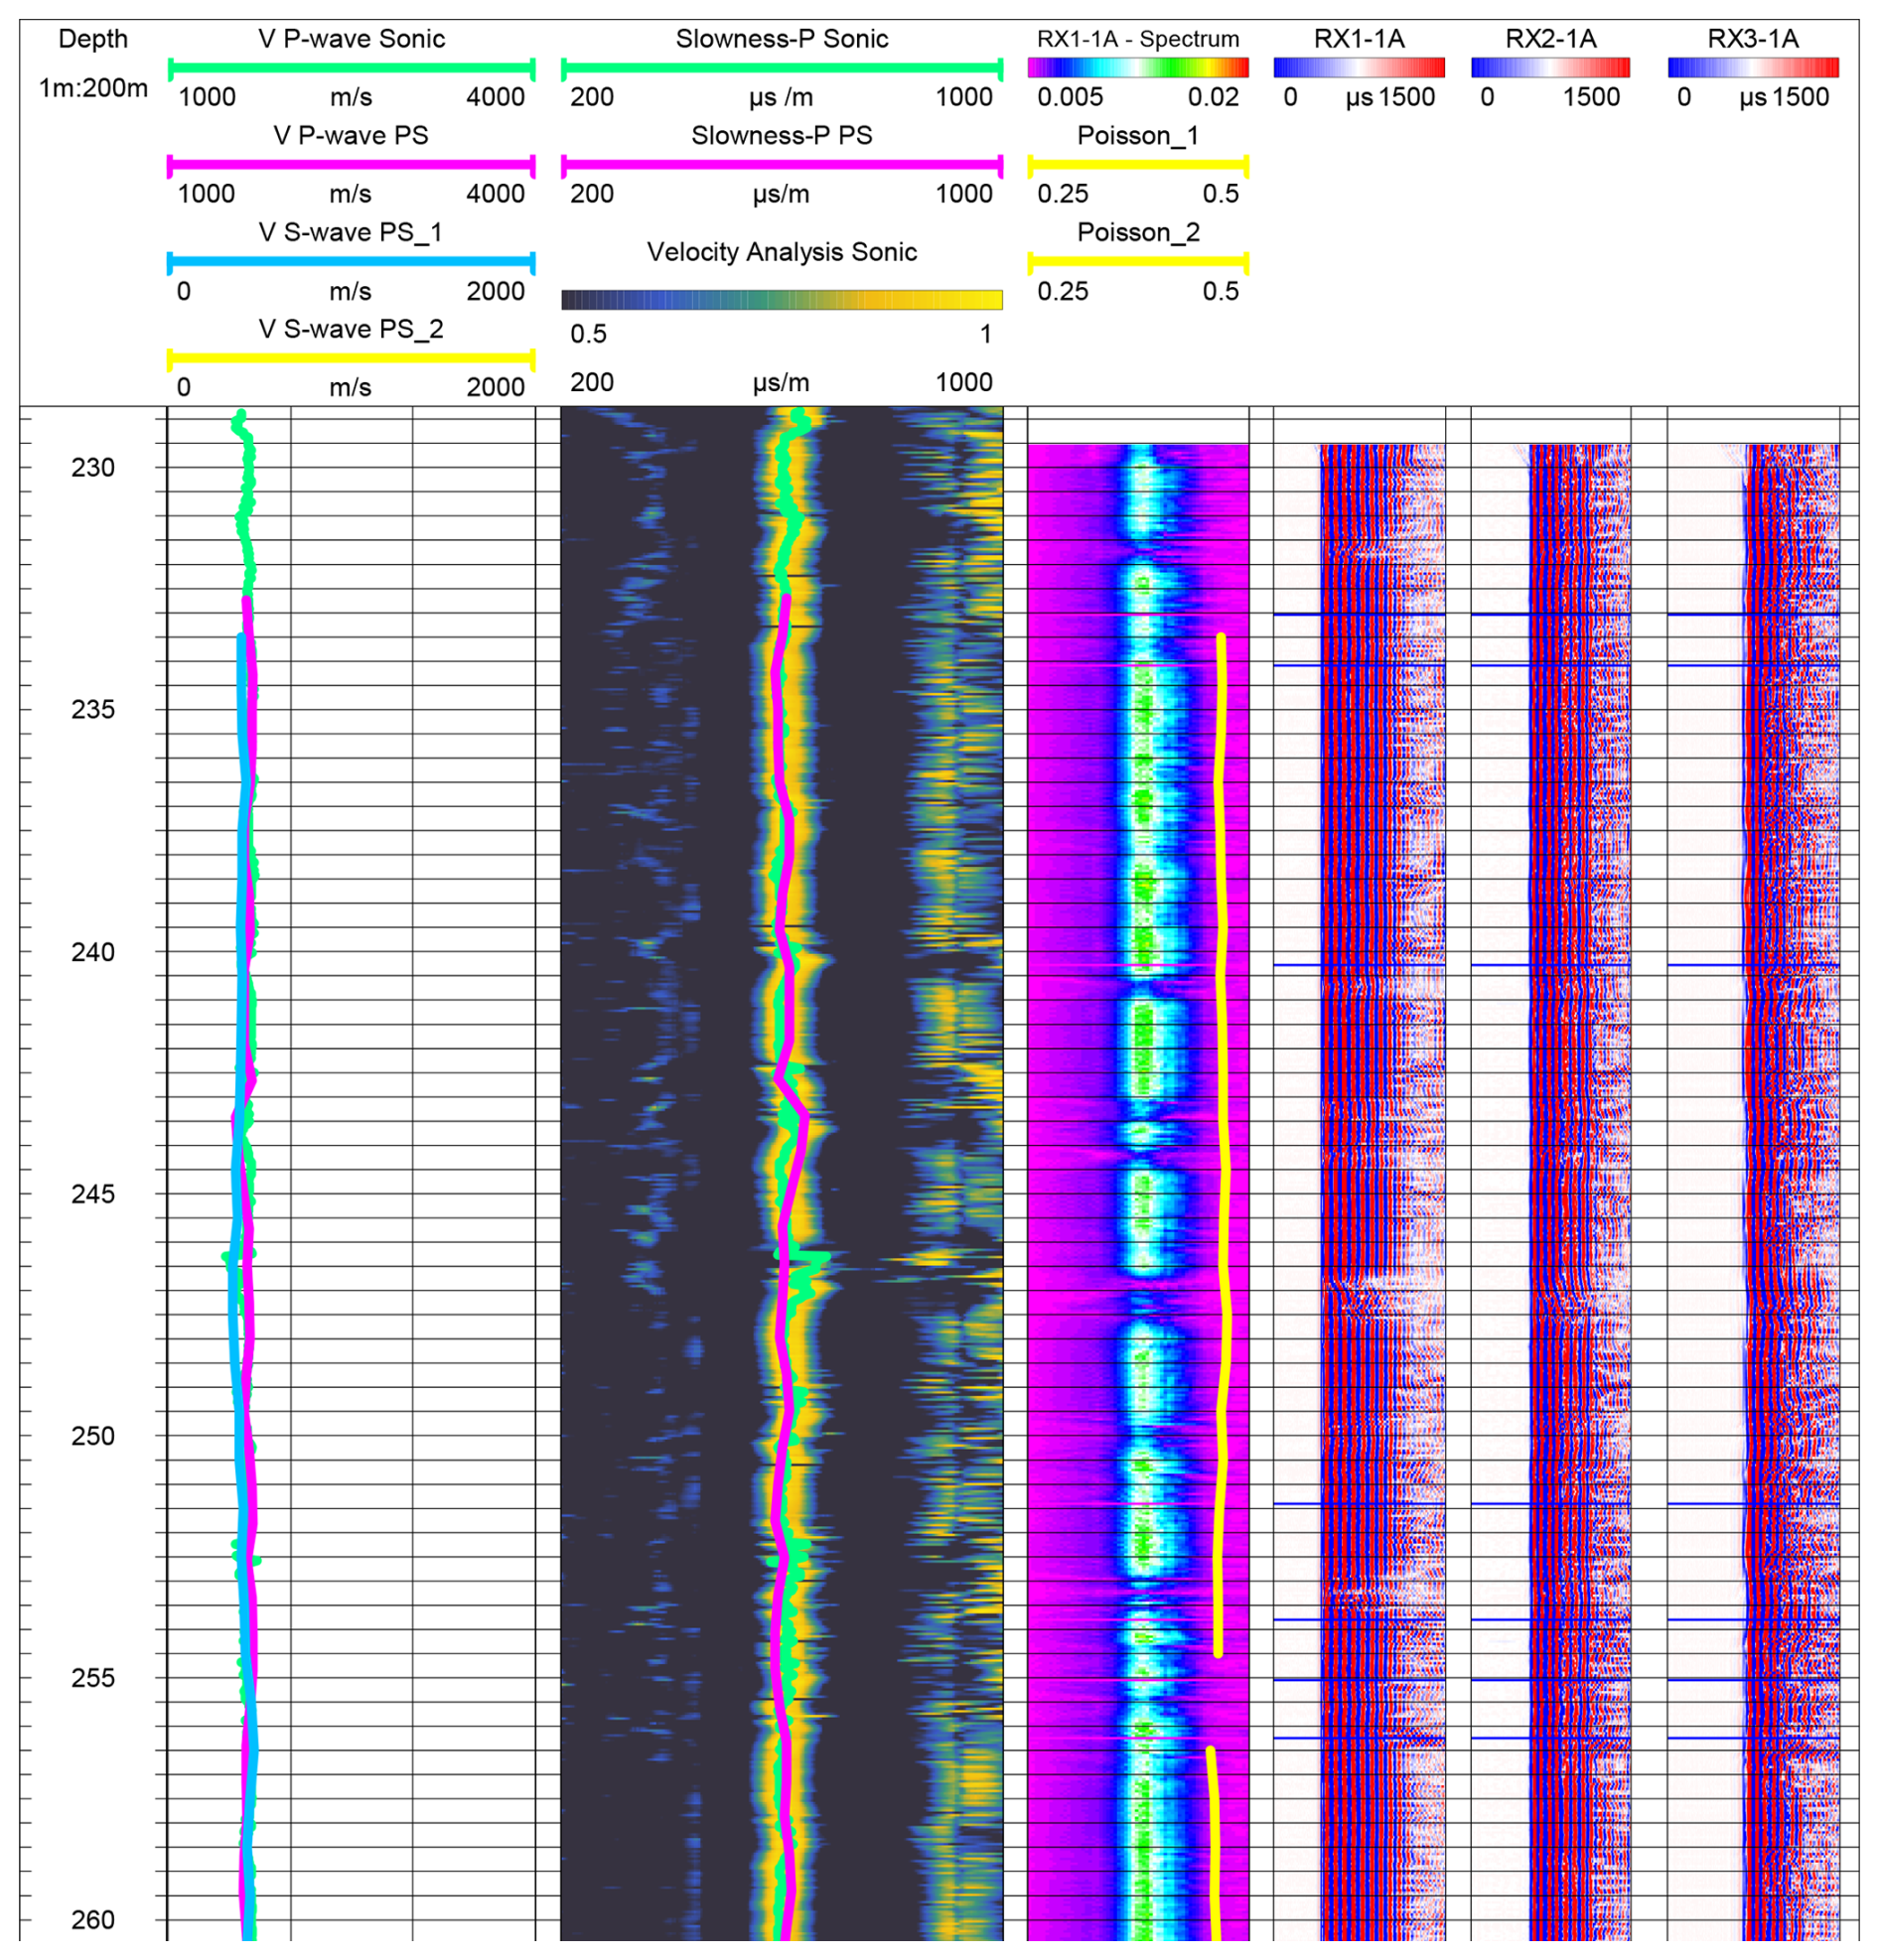
Figure 6DAPGEO-02 sonic and PS suspension wireline logs collected in Phase 2. Extract of the first 30 m from the original image produced by Deltares. See the drilling report for more information (raw data available in Vardon et al., 2023a, and Barnhoorn et al., 2024).
In Phase 1, there was limited scientific value in logging due to the top ∼50 m of the ground being reasonably well explored for civil engineering purposes. In Phase 2, a limited logging suite was deployed, due to the relatively large borehole diameter and tool availability. In Phase 3, five different tools were used, resulting in a total measuring time of almost 1 d (continuous logging). The following logging parameters were collected: spectral gamma ray (SGR); total gamma ray (GR); 8′′, 16′′, 32", and 64′′ normal resistivity (RES); spontaneous potential (SP); single-point resistance (SPR); 16′′ and 64′′ induced polarisation (IP); sonic P-wave velocity (SON); PS suspension (P- and S-wave velocities); nuclear magnetic resonance (NMR); and borehole deviation (DEV). In particular, the PS suspension tool was used due to very limited shear velocity data in this depth domain, and the NMR was used to investigate the properties of the Cenozoic clays. In Phase 4 (the Ommelanden Formation), fewer tools were again used, mainly due to limited tool availability. However, an acoustic borehole imager (ABI) was used in the anticipation of fractures in the marl and an electromagnetic (EM) induction (IL) tool to determine the conductivity of the stratigraphy and pore fluid content.
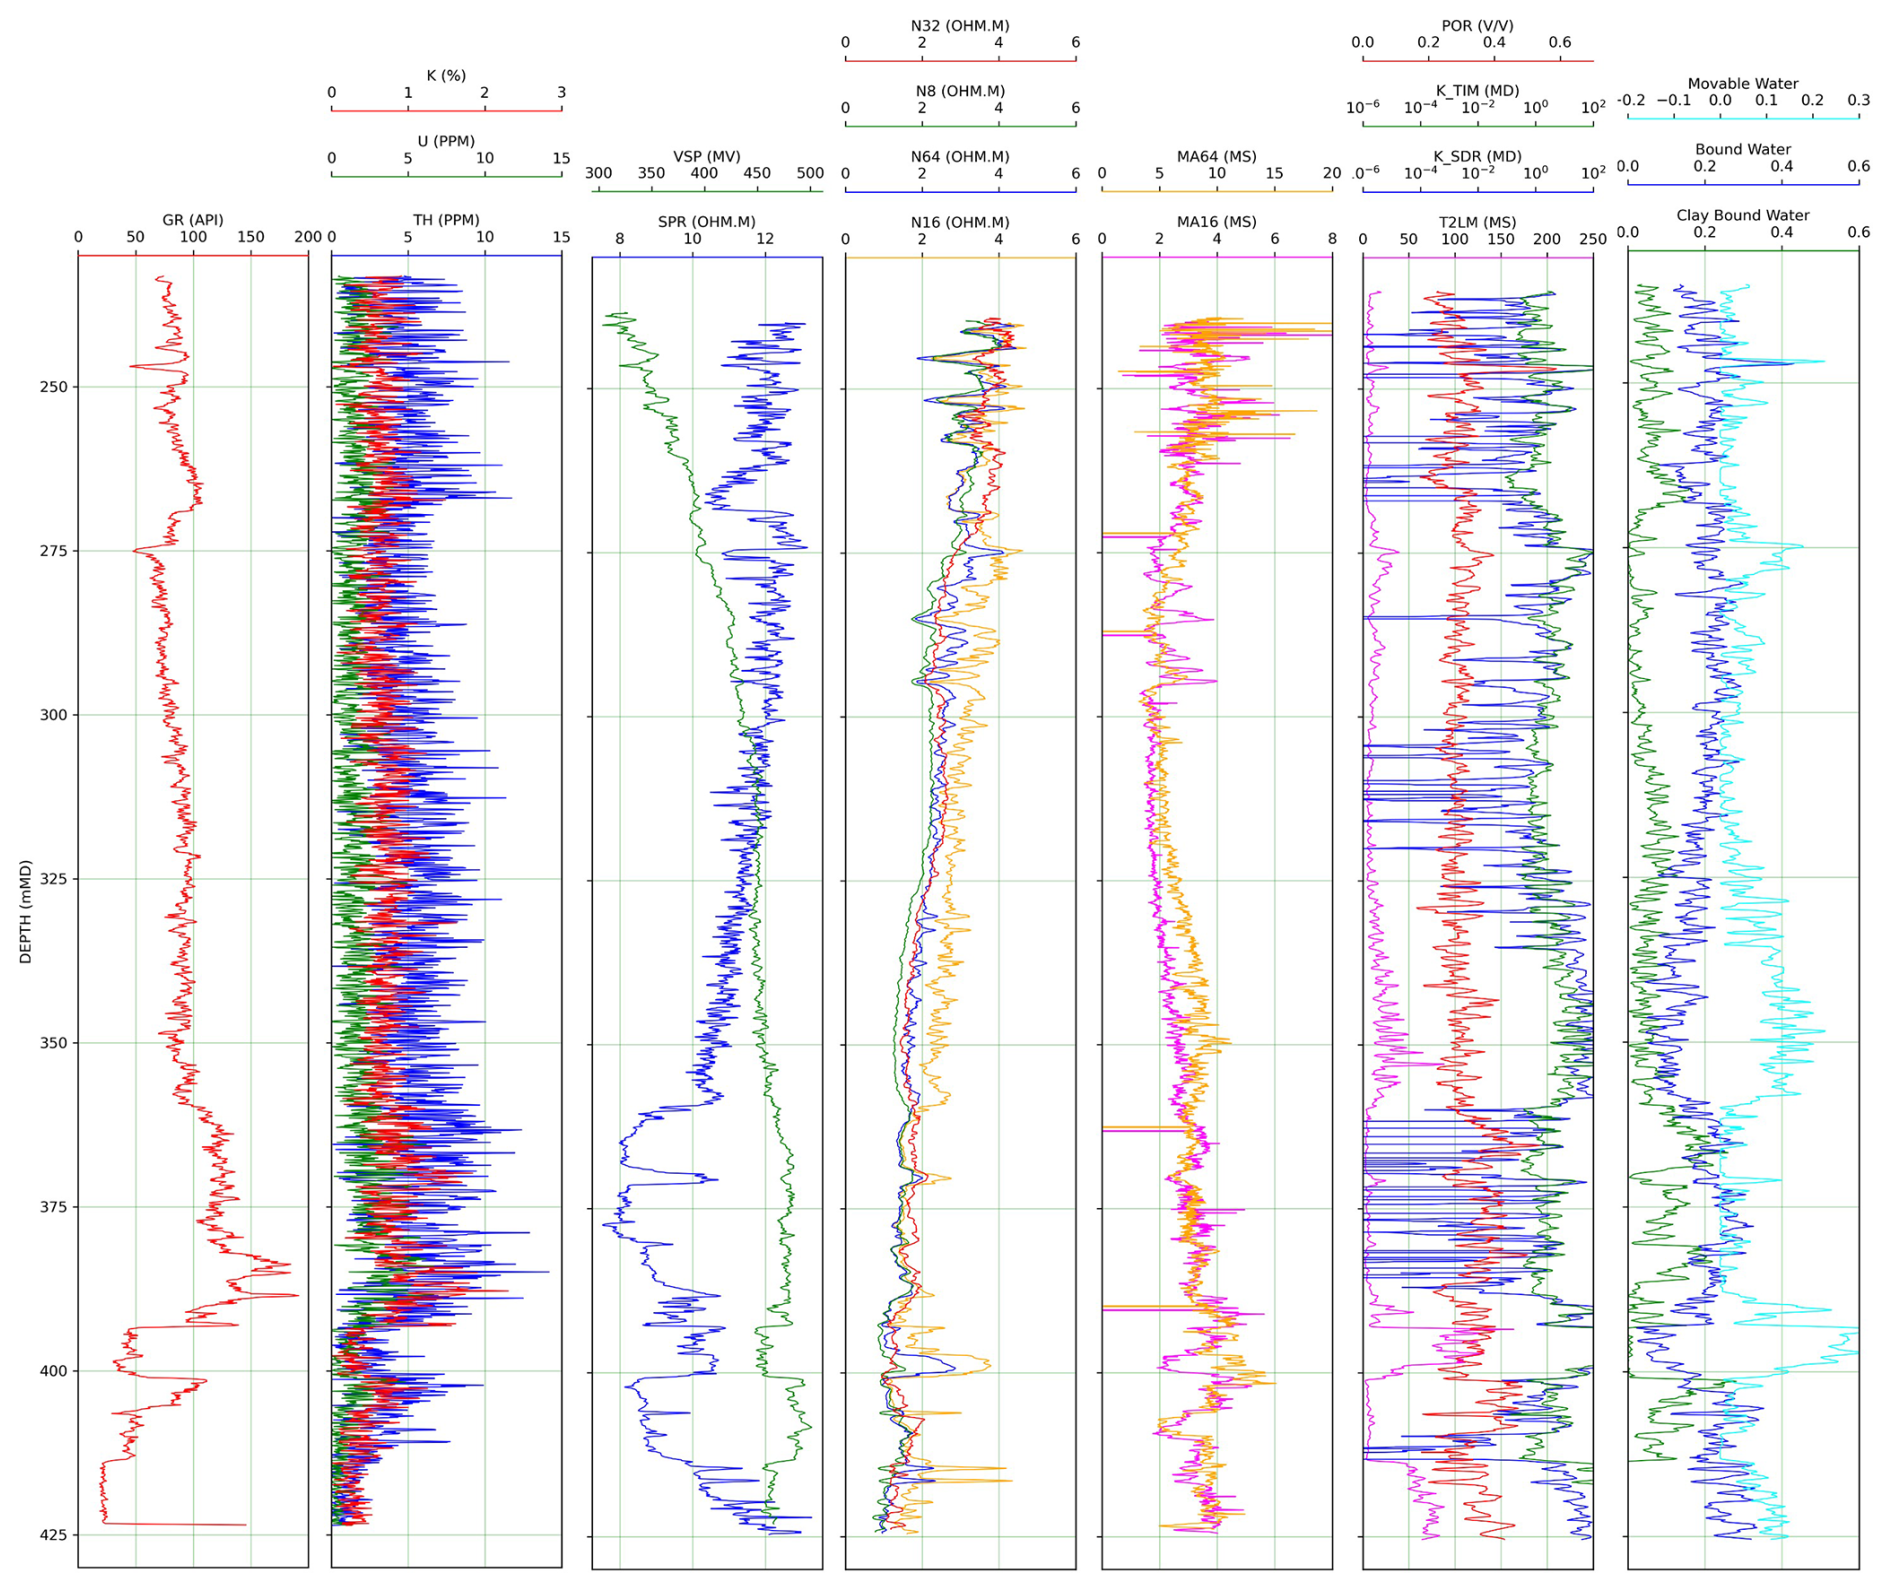
Figure 7DAPGEO-02 wireline logs collected in Phase 3. From left to right: gamma ray (GR); potassium (K), uranium (U), and thorium (TH); spontaneous potential (VSP) and single-point resistance (SPR); 8′′, 16′′, 32′′, and 64′′ components of electrical resistivity (RES); 16′′ and 64′′ components of induced polarisation (IP); porosity (POR), two types of permeability (K_TIM;K_SDR) and log mean transverse relaxation time (T2) from the nuclear magnetic resonance (NMR, T2LM); water content interpreted from NMR logging (raw data available in Vardon et al., 2023a, and Barnhoorn et al., 2024).
Initial uninterpreted logging data for the different logging campaigns are depicted in Fig. 5 (Phase 2), Fig. 6 (sample sonic and suspension logs in Phase 2), Fig. 7 (Phase 3), and Fig. 8 (Phase 4). No corrections have generally been performed, except for limited noise filtering and depth correction.
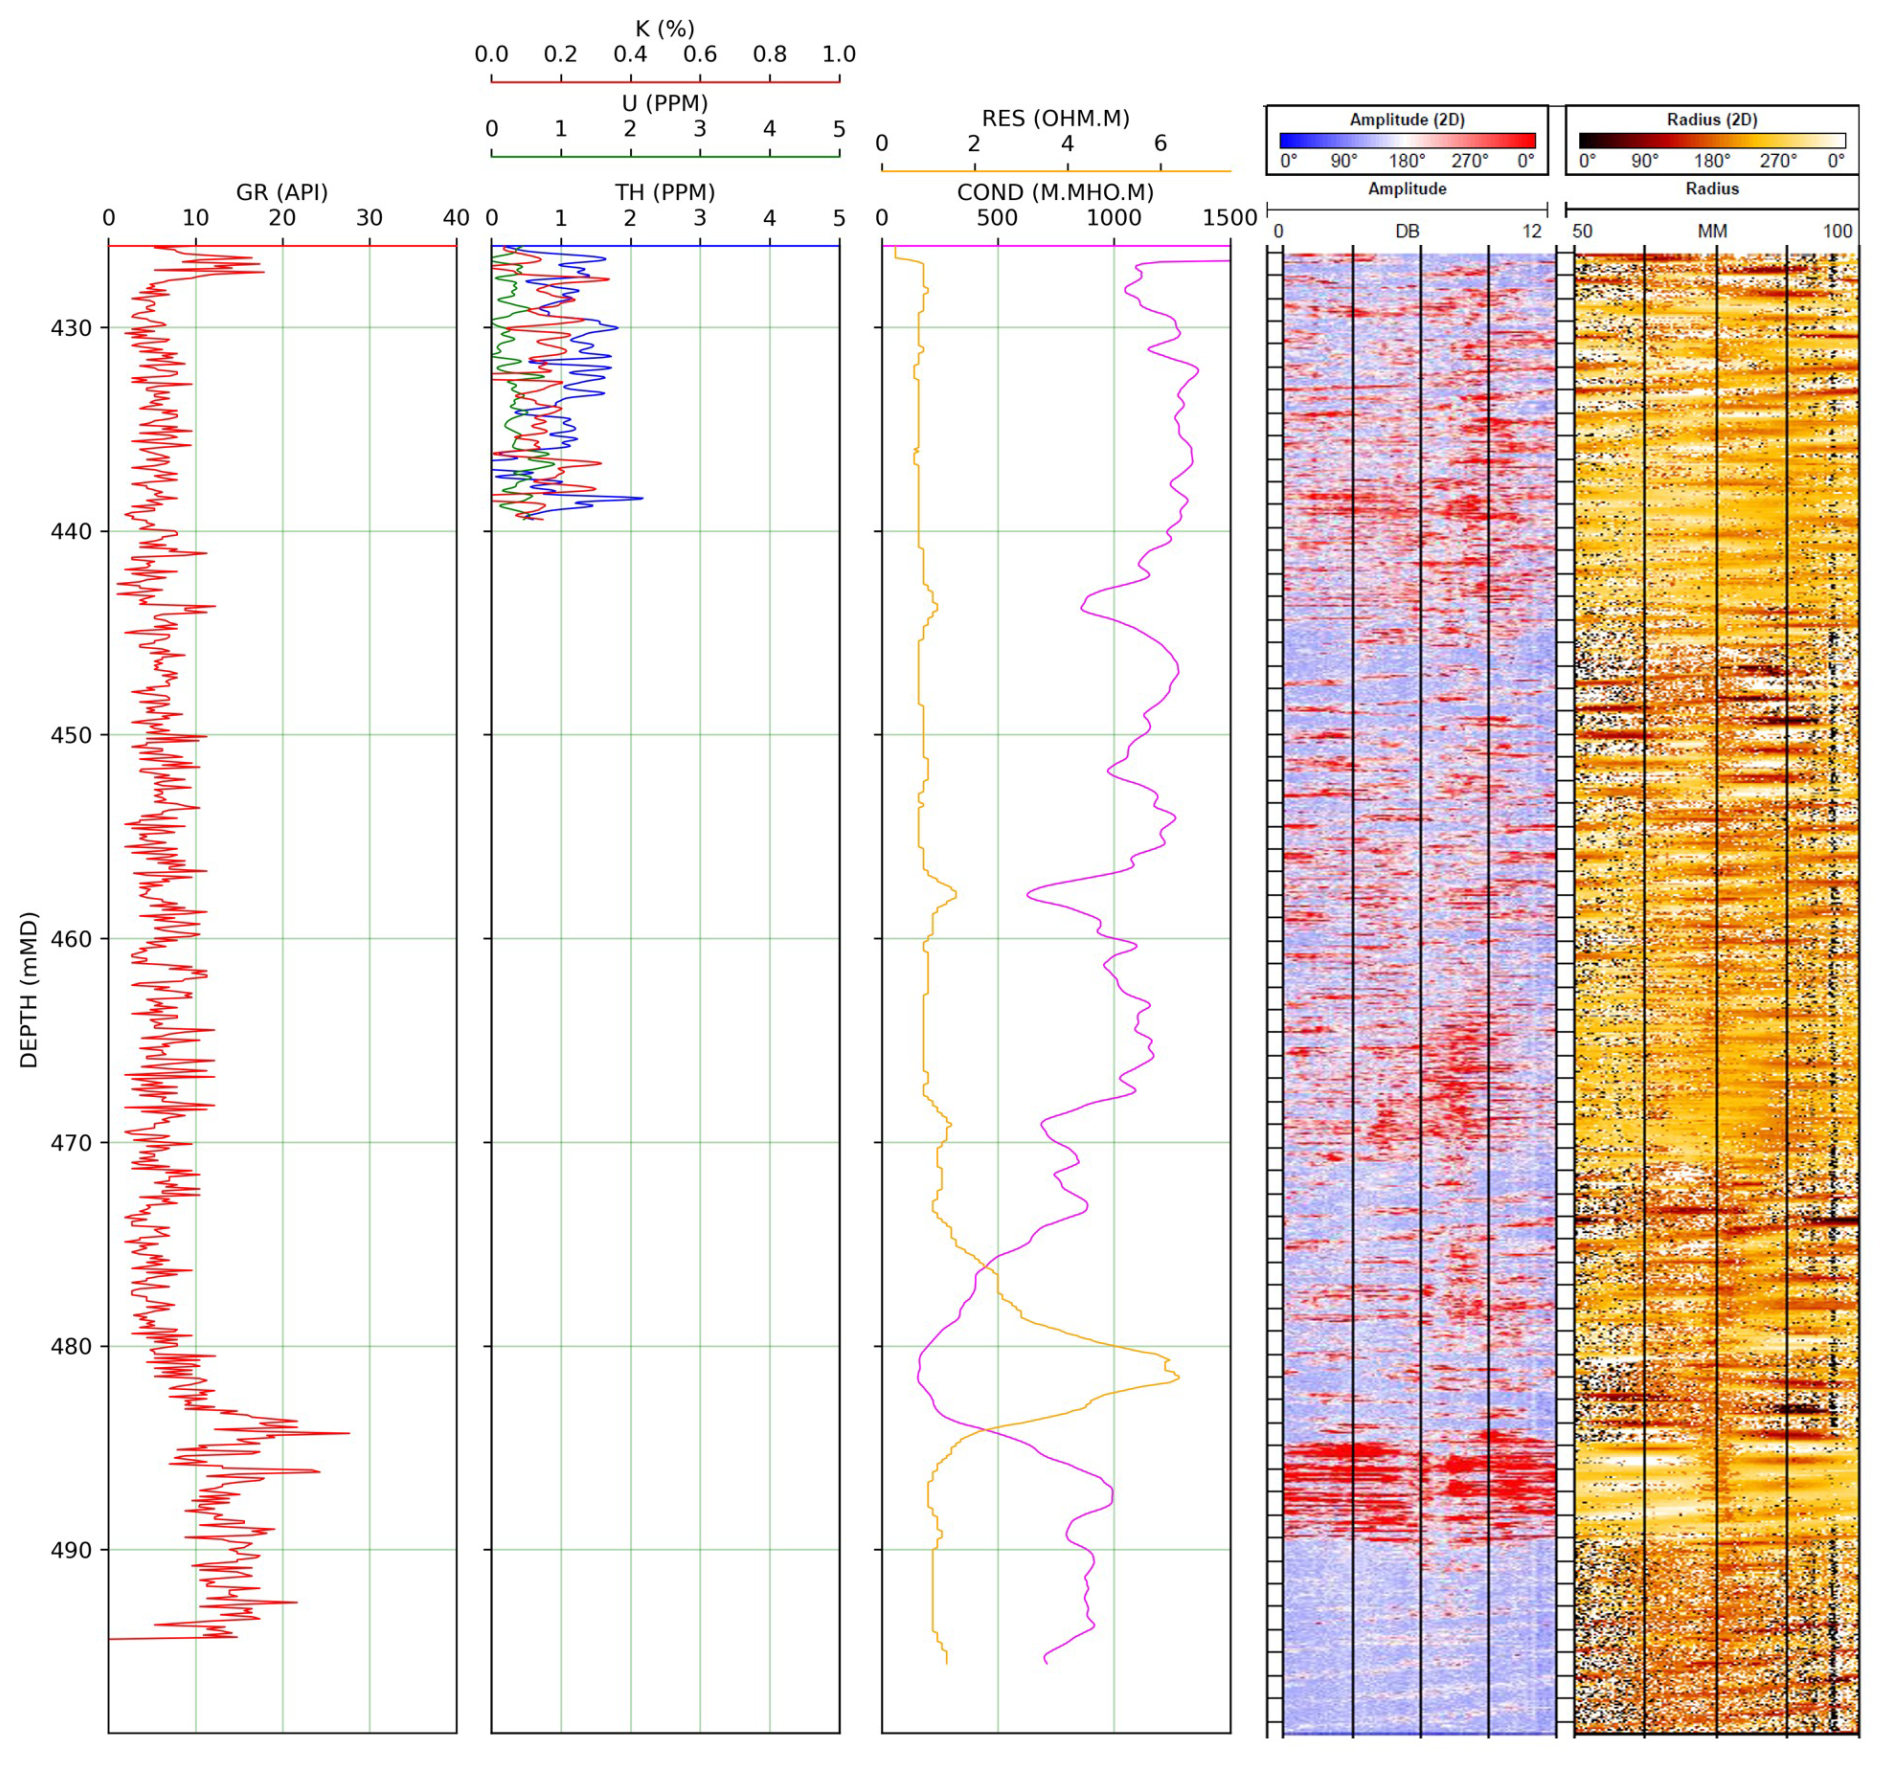
Figure 8DAPGEO-02 wireline logs collected in Phase 4. From left to right: gamma ray (GR); potassium (K), uranium (U), and thorium (TH); electrical resistivity (RES) and conductivity (COND); amplitude and radius from the acoustic borehole imaging (ABI) tool (raw data available in Vardon et al., 2023a).
The logs were made publicly available in two batches: (i) the GR, SGR, RES, SPR, SP, and IP logs (Vardon et al., 2023a; https://doi.org/10.4121/20299644) and (ii) the three sonic and NMR logs (Barnhoorn et al., 2024; https://doi.org/10.4121/e74d650d-31e5-441f-bde5-aaa4338e9d10).
The logs are seen to correlate well with core data, with the heterogeneities in lithology and detailed sedimentology well captured with combined logging data. Of note, this is the first use of PS suspension logging in the Dutch subsurface to our knowledge, which is able to yield shear and compressional wave velocity profiles at shallow depths.
5.1 Lithostratigraphy
Figure 9 presents an overview of the interpreted stratigraphy, including the depth, stratigraphy, gamma ray coloured by drilling phase, the lithography, and coring locations.
The drilling in Phase 2 between 43 and 230 m b.g.l. depth focussed on the clayey and sandy layers of the Maassluis Formation that occurs roughly between 100 and 230 m depths. Between 43 and 100 m depth, fluvial deposits were found belonging mainly to the Waalre Formation. In this section, the main lithology is fine sand with many clear, multiple-metres-thick, clayey layers indicated by high GR signal, such as at 75, 90, and 98 m depth (as shown in Fig. 9).
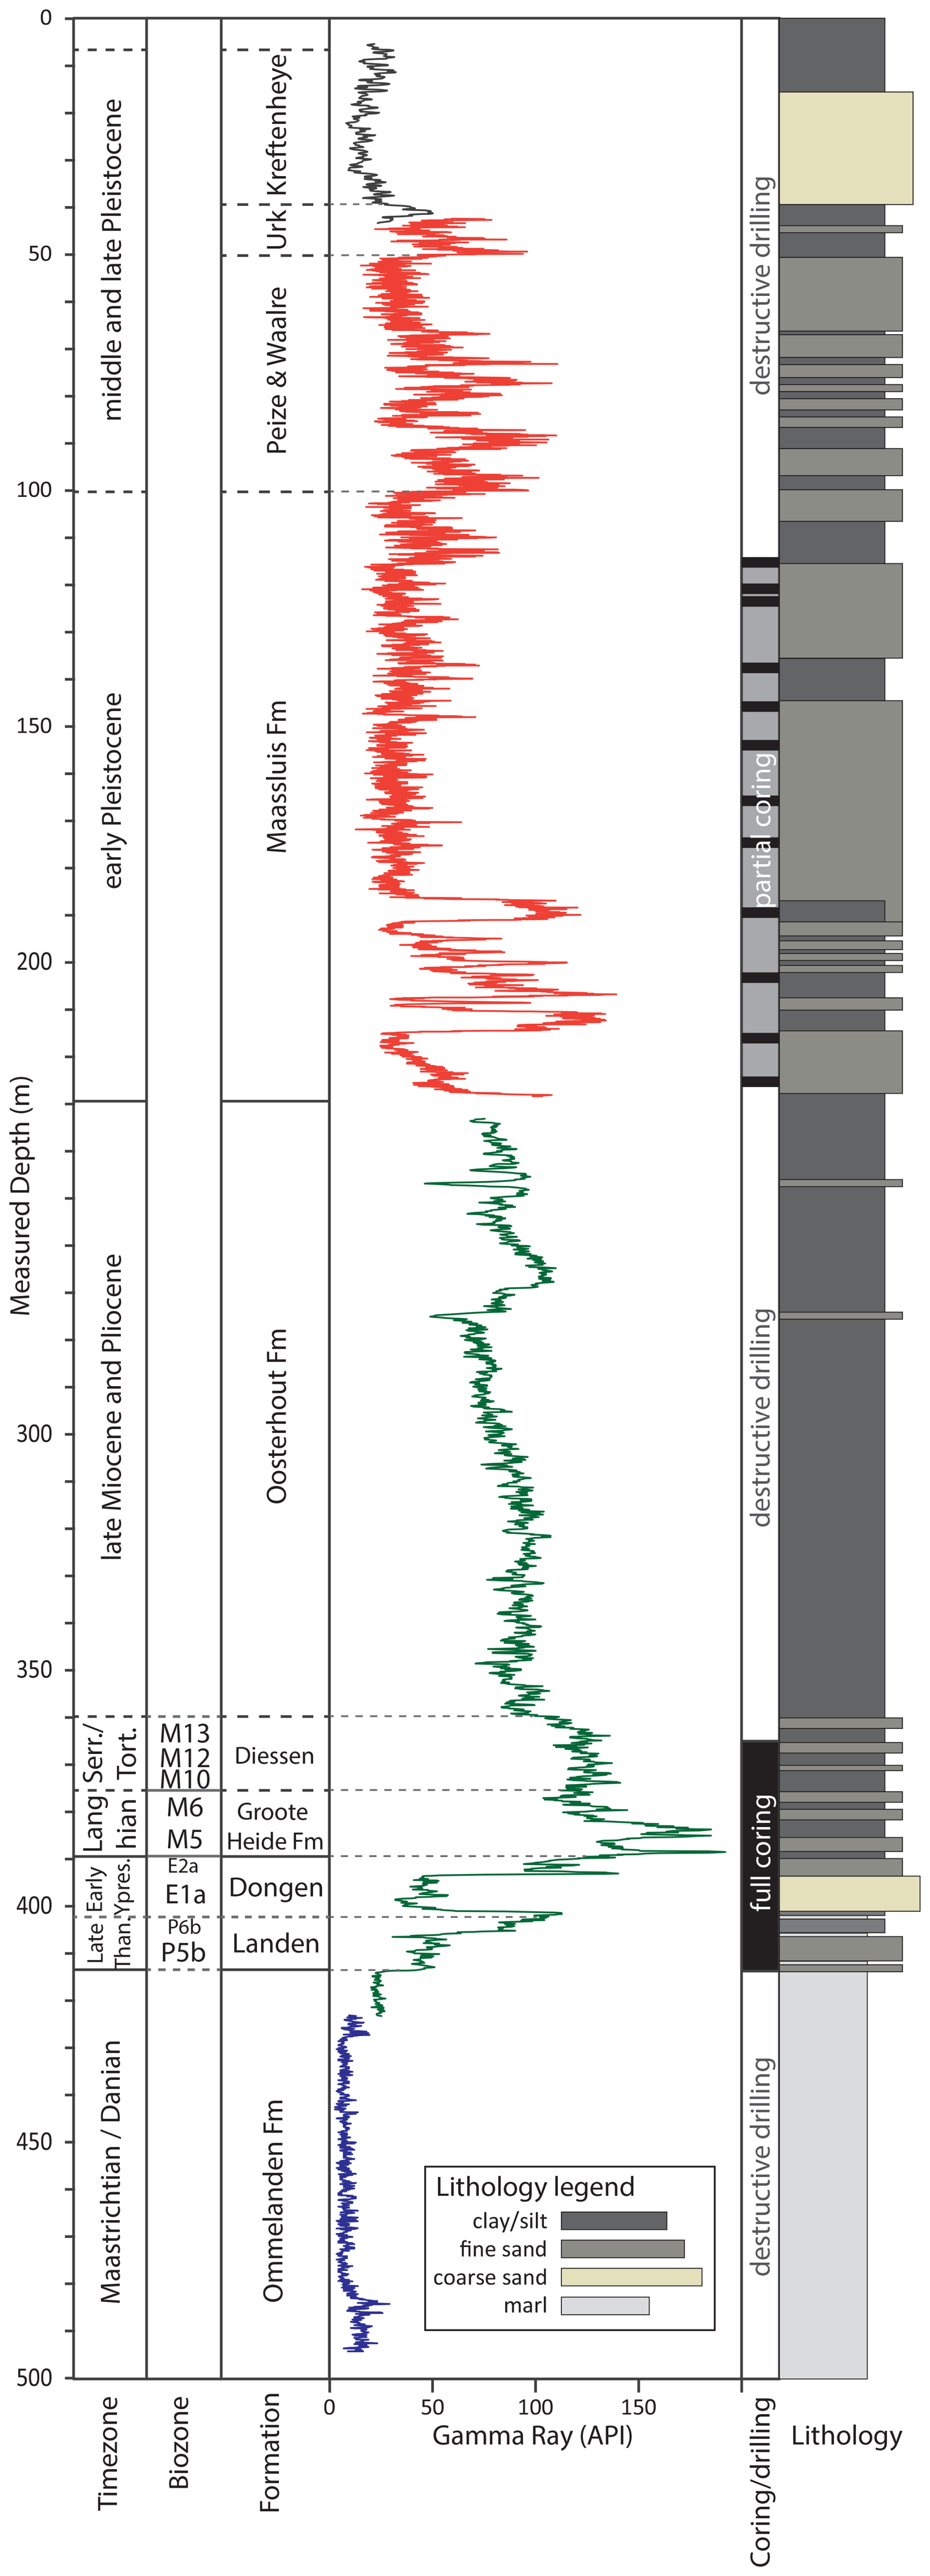
Figure 9Stratigraphic overview of the DAPGEO-02 well. From left to right: measured depth in metres below surface, the geological time zones, interpreted biozones, formations, downhole gamma ray wireline logs with different runs in different colours, cored intervals, and interpreted lithology based upon cuttings and core shoe descriptions and well logs.
In the interval below, between 100 and 230 m b.g.l. depth, unconsolidated, shallow marine sediments are encountered that likely belong to the Maassluis Formation. The top part of this section up to a depth of 189 m consists mainly of fine sands, with more clayey and silty zones present between 107 and 115 m and between 135 and 143 m depth. Cores taken between 115 and 125 m depth indicate that the fine sands often (1 to 2 per metre of core) contain clay layers/lenses of ∼0.5–2 cm thick. In addition, some wood fragments (0.2–2 cm) are found in these cores. Shell fragments (0.1–0.5 cm) are observed in most cores, with some having relatively high concentrations, such as at 125 m depth. The cores taken in the zone with relatively high GR at 135 to 143 m depth are relatively heterogenous and show a higher content of clayey and silty layers (e.g. Fig 4a). At 140 m depth, a layer with high shell content is found, ranging from fine to coarse shell fragments (0.1 to 5 cm). The largest, relatively homogeneous and low-GR section occurs from ∼150 to 185 m depth; shows less heterogeneity; and, based on two cores and the cuttings, mainly consists of medium fine sands and silts. Higher concentrations of shell fragments are found in this zone compared to the shallower and deeper part of the Maassluis Formation in this well. Between 189 and 230 m depth a clay-dominated section occurs, consisting of plastic clays and sections with layers of clay and sand. Between 215 and 220 m depth, a less clayey zone consisting of fine sands mixed with clay layers or alternations between thin fine sand and clay layers is found.
The first part of Phase 3 (230 to 360 m depth) is the Oosterhout Formation, which is dominated by very clayey deposits. Until a depth of ∼ 265 m, this layer is characterised by increasing GR. This is related to the high clay contents with low sand fraction and to the occurrence of glauconite with varying concentrations, identified macroscopically. The highest glauconite content occurs between 230 and 250 m depth. Between 268 and 280 m depth, a fining upward sequence is recognised in the logs and cuttings with a thin (∼ 3 m), less clayey, very fine sandy layer at the base. Below this, very clayey sediments occur with varying mixed-in fractions of very fine sands. This continues until a depth of 360 m. Below 320 m depth, the clays start to be more lithified as indicated by the fact that these were harder to drill. At 360 m depth, a clear increase in mainly the NMR and GR signal indicates a higher amount of clay-bound water and the transition from the Neogene Oosterhout Formation towards the Diessen Formation below.
The interval below 360 m was targeted for its clay properties, with full coring between 362 and 415 m. Within this section, a rather heterogeneous lithology consisting of clays, silts, sands, and marl was encountered. Between 362 and 384 m, the sequence is dominated by clay-rich lithologies belonging to the Diessen Formation, although a 2 m thick glauconitic sand layer is present at around 370 m depth (Fig. 10a). Above the sand layer, clay minerals make up two-thirds of the mineral population, while below this sand layer this is only one-third. In the GR log, the sand layer and the two clay-rich layers are not distinguishable, which is attributed to the presence of glauconite. In the first few metres (362–366 m) of this section some shell fragments are present.
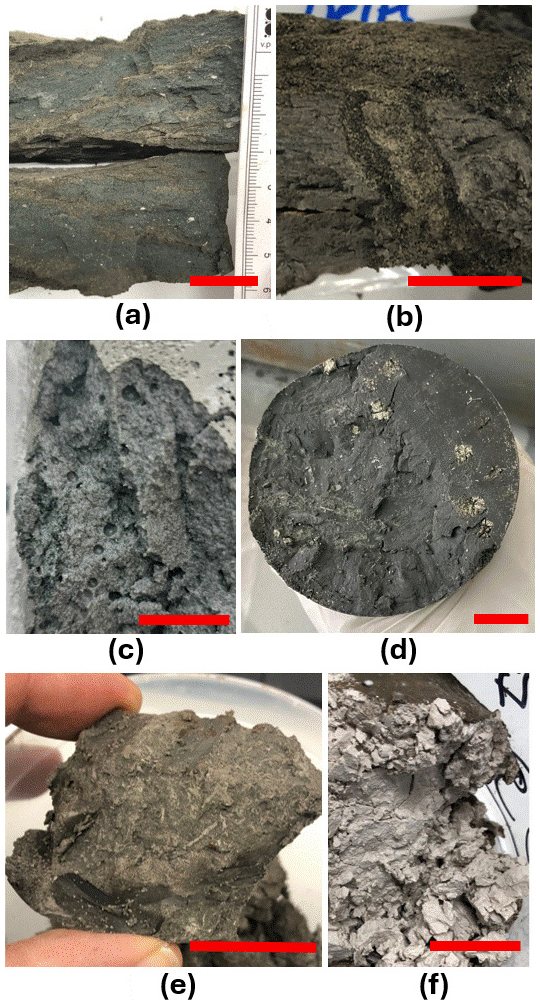
Figure 10Selection of sediment photographs. The red scale bar represents 2 cm. (a) Glauconite-rich sediments (370.2 m b.g.l.), (b) sand-filled burrow (390.7 m b.g.l.), (c) gas bubbles in poorly consolidated sediment (391.7 m b.g.l.), (d) pyrite nodules (403.5 m b.g.l.), (e) pyrite-filled burrows (406.1 m b.g.l.), and (f) marl (414.6 m b.g.l.).
From 384 to 389 m, the lithology coarsens downward into fine sands, which are increasingly less consolidated and have increasing glauconite content with depth. This section belongs to the Groote Heide Formation (identified by the biostratigraphy in Sect. 5.2). There are no indications for a sharp transition in lithology between the Diessen and Groote Heiden formations, even though this represents the middle Miocene unconformity.
The interval between 390 and 393 m is highly heterogeneous, comprising interbedded clays, silts, and sands, including 3–5 cm alternations of clay and sand in some parts. Burrows of 1–2 cm diameter are recognised (as seen in Fig. 10b). At 392 m, a poorly consolidated and very soft section of clay was found with what appears to be degassing bubbles in the core (Fig. 10c); see Sect. 3.2.3. Below this, the sandy Oosteind Member (Dongen Formation) extends down to 401 m. It is poorly consolidated and features blackish and brown laminations rich in organic matter. This member is deposited during the Palaeocene–Eocene boundary interval.
Table 3Overview of samples selected for palynological analyses and the interpret age.
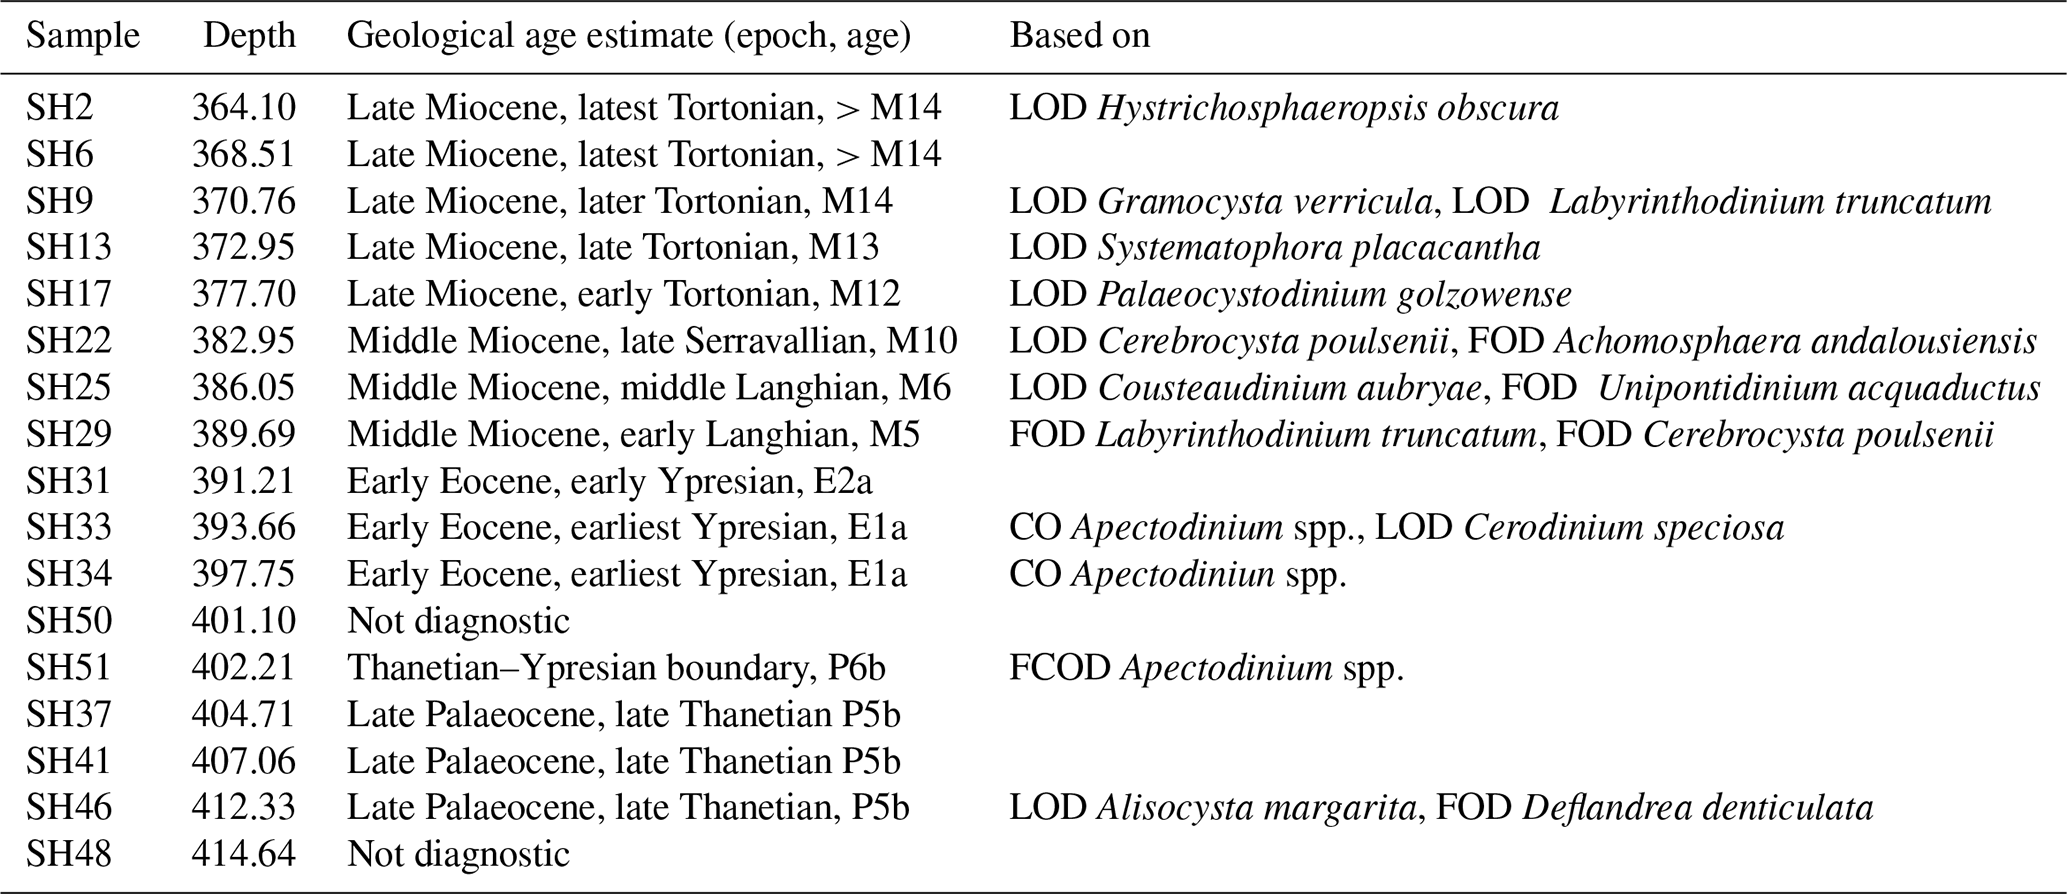
Table 4Interpreted stratigraphy of the cored Neogene-to-Paleogene interval.
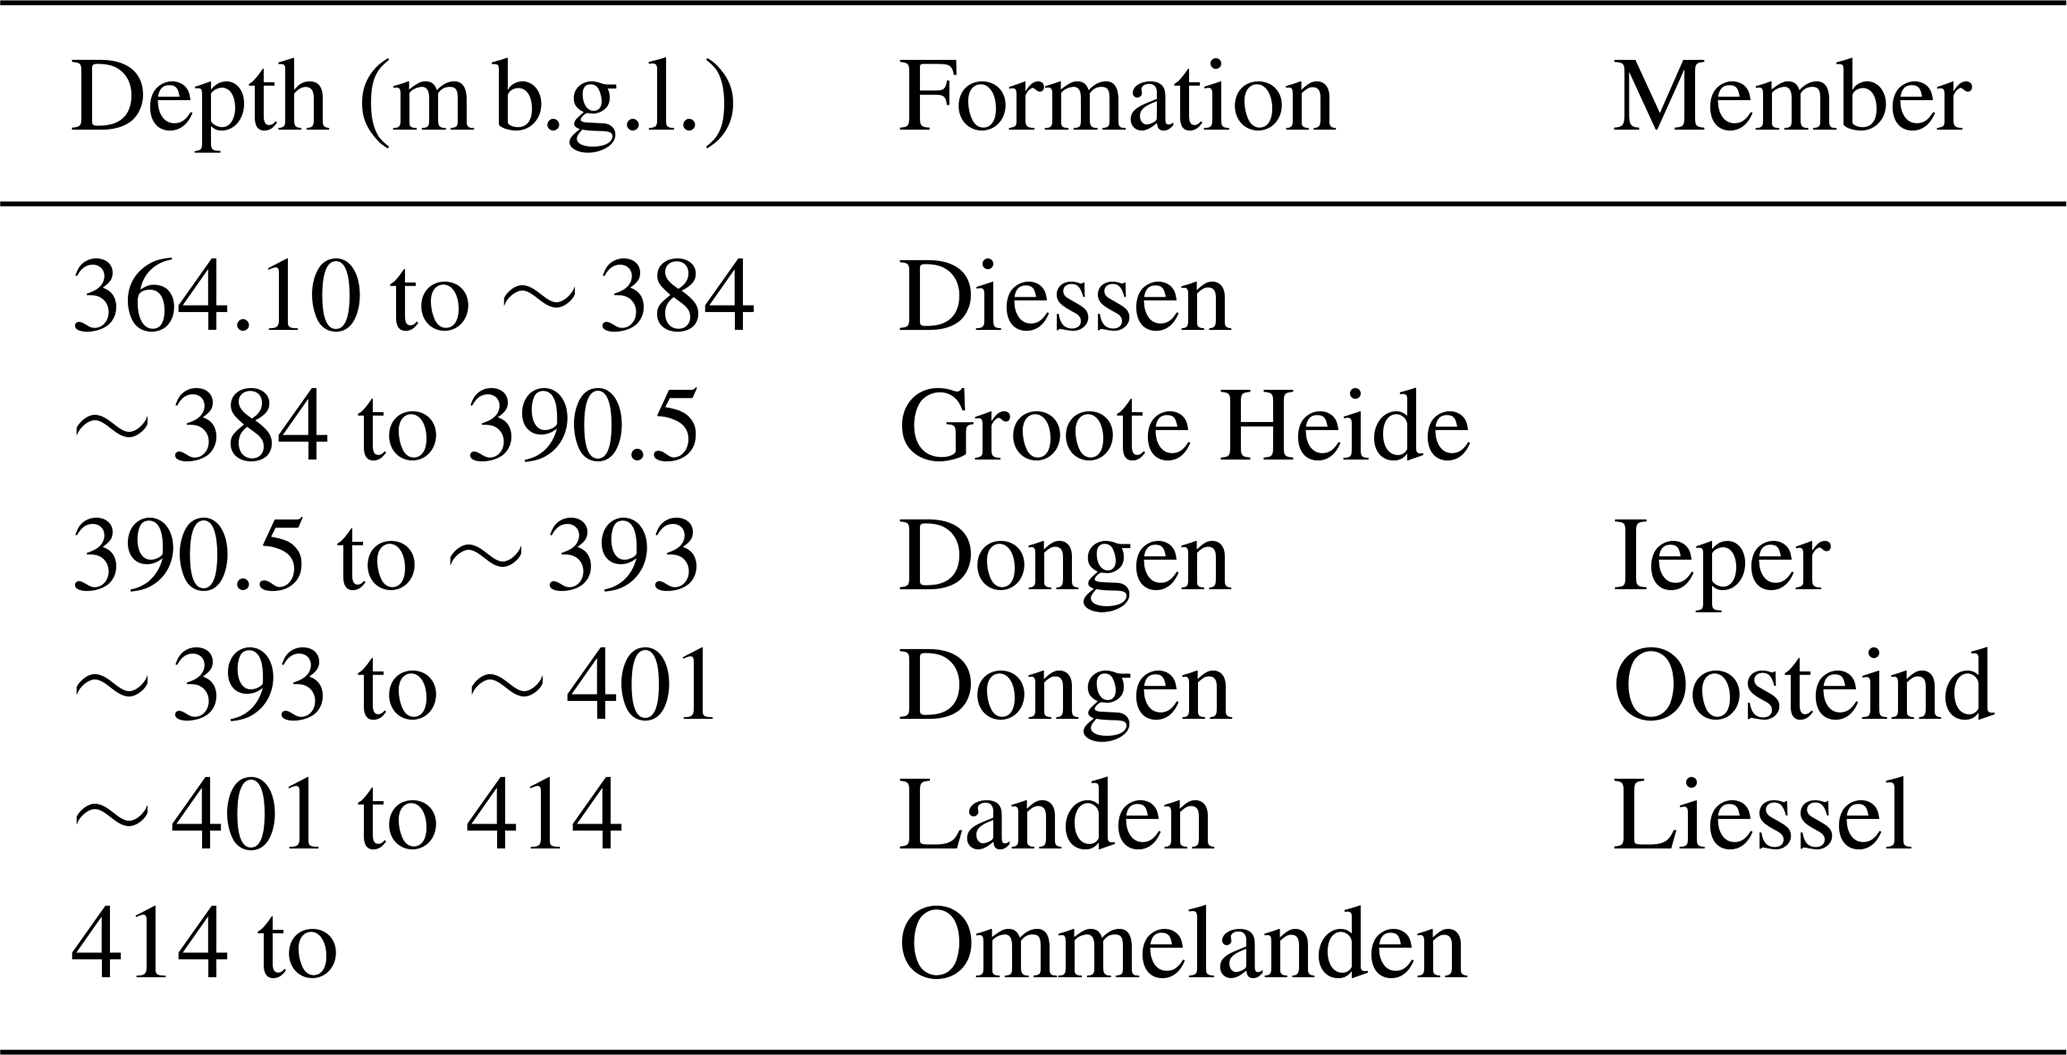
The section between 401 and 414 m (Landen Formation) is relatively indurated and fine-grained and shows a downward increase in both grain size and carbonate content. Pyrite nodules are present with multiple-millimetre diameters (Fig. 10d) as well as pyrite-filled fractures. Small burrows (millimetre-scale diameter) filled with pyrite are present (Fig. 10e). Within this interval, three hard, indurated marl layers approximately 0.5–1 m thick were encountered during coring which had to be destructively drilled. In the GR log, a sharp drop of GR occurs at 405 m, corresponding with one of the marl layers. The section on top of this marl layer (403–405 m) consists of 80 % clay minerals, while for the section below this is 40 %. Beneath the Landen Formation, marl is present (Fig. 10f) and extends to at least 499 m. This formation is interpreted as the Ommelanden Formation.
5.2 Biostratigraphy
A palynological study has been performed on 11 core shoe samples from the Neogene–Paleogene interval ranging from 364–414 m b.g.l. The palynological study has been carried out by TNO (Munsterman, 2023), and an additional six samples are reported here. The age estimation is based on the first occurrence date (FOD), last occurrence date (LOD), common occurrence (CO), and first common occurrence date (FCOD) of dinoflagellate cysts. A summary of the palynological analysis is presented in Table 3. Based on these age estimates, combined with the lithological descriptions and the logging data, the lithostratigraphic classification is interpreted and presented in Table 4.
The Miocene Diessen and Groote Heide Formation belong to the Breda Subgroup (Munsterman, 2019), formerly known as the Breda Formation. The Diessen and Groote Heide Formation are split by the Middle Miocene Unconformity. In the well, this should be around 384 m depth, between the biostratigraphic samples at 382.95 and 386.05 m depth. Below, between the Groote Heide and Dongen formations, a large hiatus occurs corresponding to both the Savian and Pyrenean phases. This should occur in the well between the biostratigraphic samples at 389.69 and 391.21 m depths. Based on these biostratigraphic constraints and the well log responses, we provisionally place this hiatus slightly above 390 m. In the time gap, the entire Veldhoven and Rupel as well as large parts of the Dongen Formation (the Asse Member) appear to be absent. Below, biostratigraphic constraints indicate the presence of the earliest Eocene and the Palaeocene–Eocene Thermal Maximum indicated by the Apectodinium spp. acme.
Table 5Description of the borehole seismic-monitoring sensors deployed at Delftse Hout connected to the KNMI seismic network. The three-component (3-C) geophones are of the type 4.5 Hz 3500-Ω (HG-6), connected to an Obsidian™ system. The 3-C accelerometer is the one as integrated into the Etna™ system.
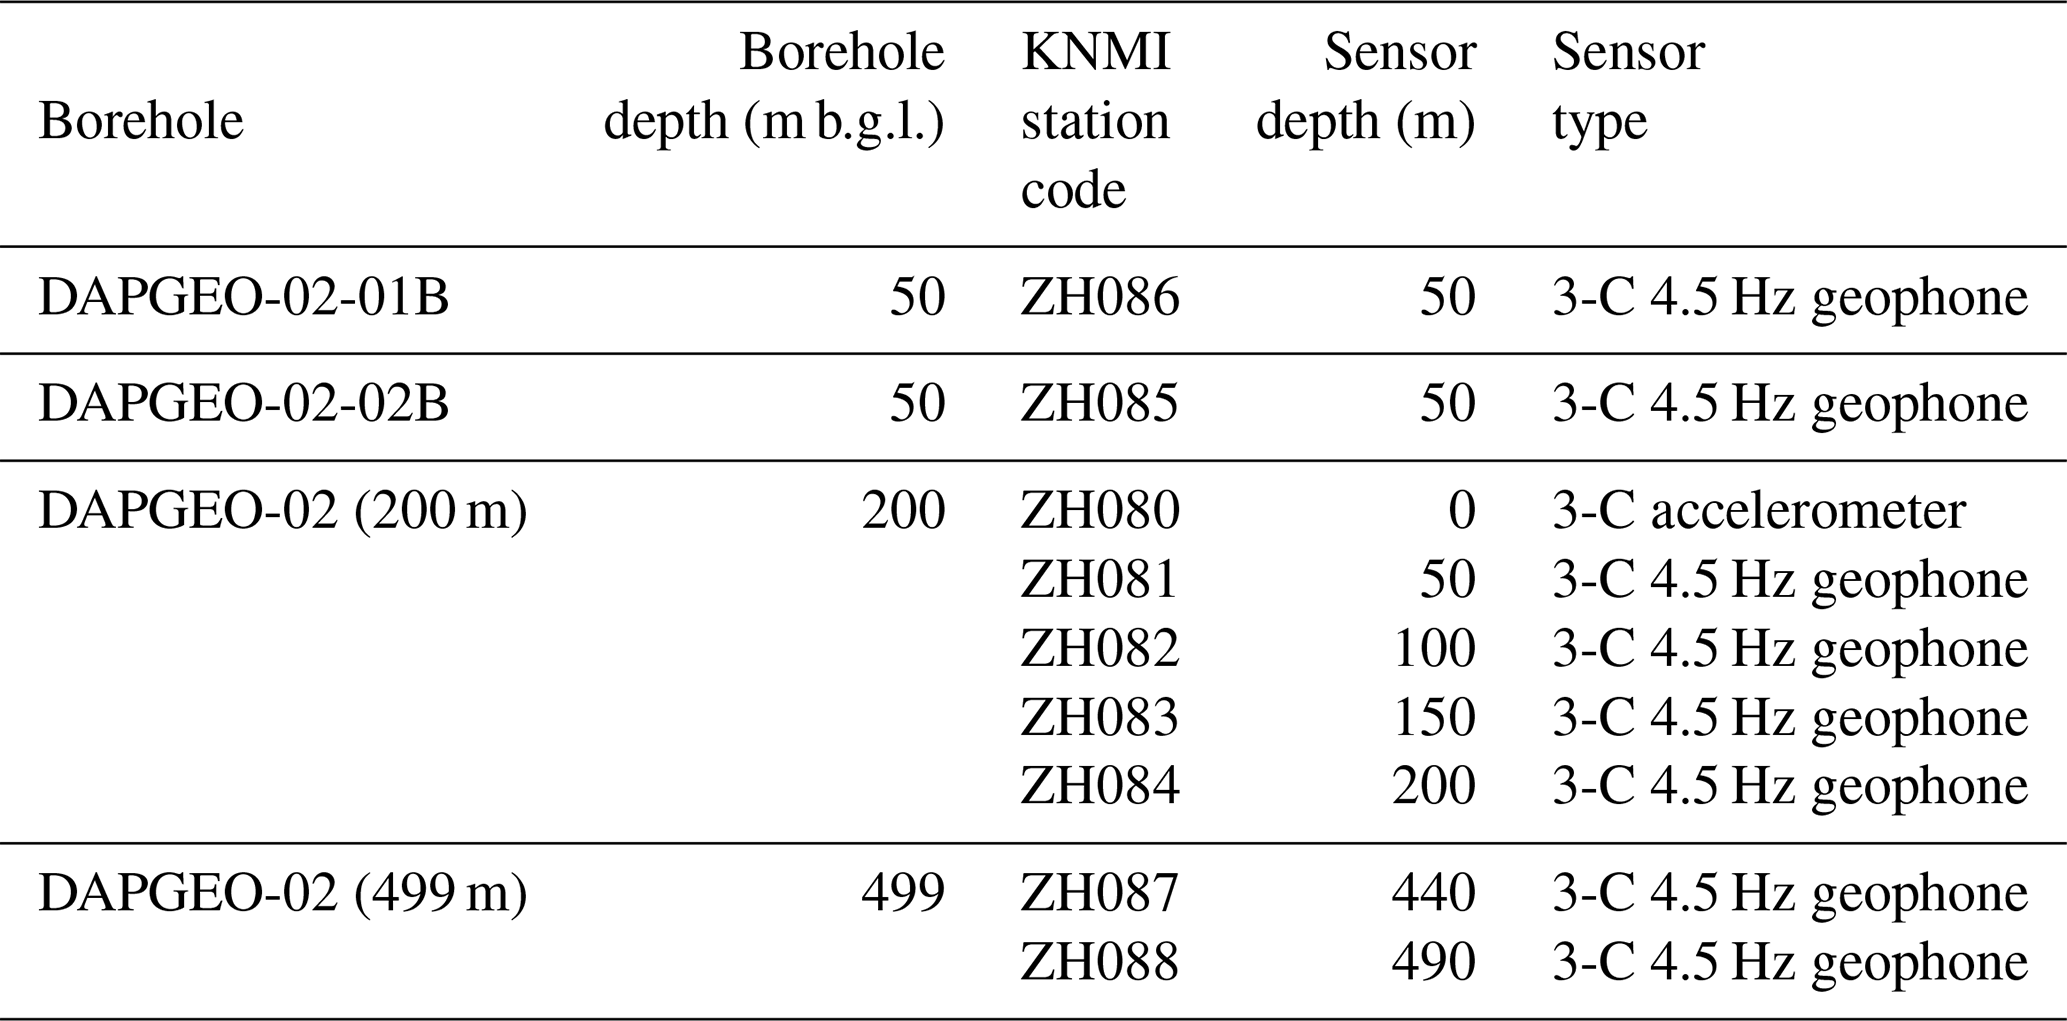
The seismic-monitoring station layout utilises all the boreholes drilled and the installed optical fibres. Via an L-shaped geometry it was designed to improve on the azimuth of possible seismic events (see Fig. 3). Geophones were installed in a “central location” made of two boreholes drilled close together (DAPGEO-02 (499 m) and DAPGEO-02 (200 m)) and two 100 m laterally offset, 50 m deep boreholes (DAPGEO-02-01B and DAPGEO-02-02B). All the sensors were grouted in to ensure optimal coupling to its surroundings. The orientations of the geophones at depth have yet to be established. Details of the instrumentations installed in the boreholes are included in Table 5. In the deep (DAPGEO-02, 499 m) borehole at the “central location” the geophones were installed in uncased borehole sections to improve the sensitivity for detection of seismicity. That borehole was drilled in stages for stability to allow other research activities and has casing in all sections except for the last; therefore in Phase 4 two geophones were installed there (440 and 490 m b.g.l.). The shallower 200 m deep borehole (DAPGEO-02 (200 m)) has four geophones installed with a vertical spacing of 50 m between them. A surface accelerometer is also installed at ground level above DAPGEO-02 (200 m). The two 50 m deep boreholes (DAPGEO-02-01B and DAPGEO-02-02B) both have a single geophone installed at full depth.
All nine seismic sensors deployed at Delftse Hout are connected to the KNMI national seismic network (KNMI, 1993; https://www.knmi.nl/nederland-nu/seismologie/stations, last access: 10 August 2026; see also Table 5), while live data streaming can be accessed at https://www.knmi.nl/nederland-nu/seismologie/stations/live-seismogrammen (last access: 10 August 2026). These data are openly available and can be retrieved in the standard seismological mseed format via FDSN web services from KNMI at https://rdsa.knmi.nl/fdsnws/dataselect/1/ (last access: 10 August 2026).
Each borehole location was also equipped with a fibre-optic cable, with the fibres (inside the cable) looped at the bottom together forming a single continuous fibre inside the cable that can be connected to a laser interrogator to allow for seismic monitoring, also called distributed acoustic sensing (DAS). Such acoustic sensing is able to measure along the entire fibre, but only in the direction of the fibre (a single direction). The surface L-shape geometry targets the detection of seismic events in its azimuthal direction, and the borehole targets the third direction. The central location, DAPGEO-02 (200 m), had two 100 m length fibre-optic cables installed from the surface and with the fibres connected at the bottom; one cable was installed with a “straight” fibre and the second with a helically wound fibre in a tube cable. The helically wound fibre was installed to investigate whether the winding could be used to detect longitudinal (P) waves in multiple directions. The fibre-optic cables were connected horizontally and buried in shallow trenches of around 60 cm depth, with one section horizontally drilled to avoid protected zones, to a maximum of 6.4 m b.g.l.
7.1 Data handling and database
Data management during the installation of DAPGEO-02 included capturing data and metadata of the drilling activities and sample curation information. A relational database was created to build a complete data set linking all data sources: drilling data, mud logging, core inventory, core CT scans, core shoe samples, wireline logs, and initial lithology descriptions. The purpose of the database is to document and administrate initial measurements and reports during the operation phase as well as to maintain a tracking system of sample material. Metadata curation includes the following elements.
-
Borehole information: borehole name, longitude, latitude, ground level, start date, and end date.
-
Core: core ID, section number, core type, top depth, bottom depth, section length, diameter, recovery, in situ remarks, preservation conditions, whole-core CT scan, storage location.
-
Core shoe: core shoe ID, associated core ID, depth, initial lithologic description, image.
-
Cuttings: depth, lithology description.
-
Downhole log: log type, drilling phase, start depth, end depth, ground level reference, drill bit diameter, tool, manufacturer.
The relational database for DAPGEO-02 (Delft University of Technology, 2024a) is publicly available to download at https://gse-comp.citg.tudelft.nl/dapwell/sample-db.html (last access: 10 August 2026).
Downhole logging data were not entered directly into the database, but their metadata have been. These include a link to the repository where they can be downloaded (see “Data availability” section). A Python package was developed for visualisation and quick analysis of conventional well logs. Logging data were analysed and quality-assured first by Deltares and then by Delft University of Technology before uploading to the repository.
To enable information flow between the researchers, laboratories, and organisations conducting analysis on DAPGEO-02 samples, we standardised our sample naming system. Sample names (IDs) are both human- and machine-readable, suitable for databases and reconstruction of sample lineage. The sample-naming convention has been published alongside several other procedures on sample handling and storage; they are available to download at https://gse-comp.citg.tudelft.nl/dapwell/sample-management.html (last access: 10 August 2026; Delft University of Technology, 2024b).
7.2 Sample and data access
Measurements and data derived from sample analyses will be made available with the least restrictive licence (https://creativecommons.org/licenses/by/4.0/deed.en, last access: 10 August 2026) to ensure the widest possible data reuse. This licence lets others distribute, modify, and build upon our work, even commercially, if they give credit for the original work, which is the preferred licensing model of us and our funders to maximise reusability.
Core material is limited and valuable; therefore, we welcome requests for core examination and sampling by submitting a request (more details on our website: https://www.tudelft.nl/citg/over-faculteit/afdelingen/geoscience-engineering/research/geothermal/geothermal-science-and-engineering/research/delft-subsurface-urban-energy-laboratory-dsuel/sample-and-data-access, last access: 15 September 2026). The proposal for sample access will be evaluated by an evaluation committee based on scientific relevance, material availability, and other requests/planned use. When access to core and other samples is granted, the evaluation committee shall request a user consent agreement under which users agree to share their research output openly by depositing resulting data sets in public repositories, with appropriate citation of the data source. New results derived from DAPGEO-02 samples and data sets will be made accessible via TU Delft institutional repositories.
A multifunctional research and seismic-monitoring station was drilled in Delft in spring 2022, called DAPGEO-02, comprising four boreholes and a fibre-optic DAS system. An L-shaped site design has eight geophones at depths up to 490 m b.g.l. and at lateral offsets of up to 100 m, as well as a surface accelerometer. A logging, coring, and cutting sampling programme has been carried out, resulting in a comprehensive data set and sampled material available for further research. A focus was given to ensuring that data are compiled in such a way that they can be widely used and integrated together and are available publicly. Geophones and accelerometer data are available via the national KNMI website, with all other current (and future) data publicly available via the 4TU repository. Samples are available for further work upon application.
All data from the drilling campaign are archived in the Geothermal Project in the TU Delft Campus Collection in the 4TU repository and are available at https://doi.org/10.4121/85b3725b-80fa-4b0b-9db2-475bfd8f0265 (Vardon et al., 2026), which includes the drillers borehole records, wireline logs and sample inventory (direct link https://doi.org/10.4121/20299644.V2, Vardon et al., 2023a) and the core CT scan data (direct link https://doi.org/10.4121/21528819.V2, Vardon et al., 2023b). The installation and all activities are described in detail in a drilling report which is available at https://doi.org/10.4233/uuid:fde70c00-cf65-4174-9cd3-89585a5e61bd, Vardon et al., 2022). All real-time seismic data are available via FDSN web services from KNMI at https://rdsa.knmi.nl/fdsnws/dataselect/1/ (last access: 10 August 2026).
The core material and cutting samples are stored at Delft University of Technology, Delft, the Netherlands. Access for scientific purposes can be possible, with an internal committee evaluating requests against scientific objectives and competing needs. Please visit our website https://www.tudelft.nl/citg/over-faculteit/afdelingen/geoscience-engineering/research/geothermal/geothermal-science-and-engineering/research/delft-subsurface-urban-energy-laboratory-dsuel/sample-and-data-access (last access: 10 August 2026) to know more about the sample request procedure.
PJV led the project conceptualisation, investigation, and the writing process. SL and TS were responsible for project administration, including site planning, procurement and management, and scientific integration, with PG responsible for the drilling methodology and execution. HAA and A-CD led the coring methodology, execution, and analysis, with key contributions from SB and TdJ. AB and PP led the logging methodology and execution. GD led the seismic-monitoring methodology and execution, with contributions from JvdB. HAA led the stratigraphy methodology and execution, with DM carrying out the biostratigraphy analysis. PK was responsible for obtaining funding and connecting seismic sensors to the national network. LVM was responsible for data curation and visualisation of the logging data. PJV, DB, A-CD, and KW obtained funding. All authors contributed to the project conceptualisation, management, and supervision of site activities and contributed to the writing process.
The contact author has declared that none of the authors has any competing interests.
Publisher's note: Copernicus Publications remains neutral with regard to jurisdictional claims made in the text, published maps, institutional affiliations, or any other geographical representation in this paper. The authors bear the ultimate responsibility for providing appropriate place names. Views expressed in the text are those of the authors and do not necessarily reflect the views of the publisher.
Alongside the detailed involvement of the research team in the author list, we would like to acknowledge our colleagues and partners, without whom this drilling would not have been so successful. These include the following: our colleagues at TU Delft (including Timo Heimovaara, Jan Dirk Jansen, and Marc Friebel) for their technical and financial support and enthusiasm for the project, SMET (Hans Smet and the rest of the SMET team), ANTEA (Aad Kant, GertJan ter Schure), Rossingh Drilling BV (Wim Slomp and team), Deltares (Pieter Doornenbal, Edwin Obando), PanTerra (Albert Hebing and Cor Laffra), COVRA (Ewoud Verhoef), EBN (Raymond Godderij), KNMI (Gert-Jan van den Hazel), GTD and their partners (in particular Leendert-Jan Ursem and Bas van Schravendijk), Spidron (Rien Bootsma), and ONDRAF/NIRAS (Hervé Van Baelen and Laurent Wouters, who shared their experience on coring poorly indurated clays).
This research has been supported by the Nederlandse Organisatie voor Wetenschappelijk Onderzoek (EPOS-NL (184.034.005) grant), the Rijksdienst voor Ondernemend Nederland (WarmingUP (TEUE819001) grant), the Koninklijk Nederlands Meteorologisch Instituut, and the Technische Universiteit Delft.
This paper was edited by Thomas Wiersberg and reviewed by Volker Wittig and Albert Genter.
Adriaens, R., Van Baelen, H., Vandenberghe, N., and Wouters, L.: Drilling- and coring-induced artefacts in poorly indurated clays, Geoenergy, 2, 2024–001, https://doi.org/10.1144/geoenergy2024-001, 2024.
Barnhoorn, A., Vardon, P. J., Laumann, S., Drijkoningen, G., and Vargas Meleza, L.: Geothermal Project on TU Delft Campus – DAPGEO-02 Sonic and NMR logs, Version 2, 4TU.ResearchData [data set], https://doi.org/10.4121/e74d650d-31e5-441f-bde5-aaa4338e9d10.v2, 2024.
de Jong, T., Toshniwal, V., Vardon, P. J., and Dieudonné, A. C.: Using X-ray computed tomography to characterise the composition and integrity of clay cores, 3rd International Conference on Energy Geotechnics, https://hal.science/hal-05344070 (last access: 10 August 2026), 2025.
Delft University of Technology: Geothermal Well Wiki: Sample Databases, https://gse-comp.citg.tudelft.nl/dapwell/sample-db.html (last access: 10 August 2026), 2024a.
Delft University of Technology: Geothermal Well Wiki: Sample Management, https://gse-comp.citg.tudelft.nl/dapwell/sample-management.html (last access: 10 August 2026), 2024b.
HADES lab: Why do we need HADES?, HADES lab, https://www.hadeslab.be/en/about/why (last access: 10 July 2026), 2026.
KNMI: Netherlands Seismic and Acoustic Network, Royal Netherlands Meteorological Institute (KNMI), Other/Seismic Network, https://doi.org/10.21944/e970fd34-23b9-3411-b366-e4f72877d2c5, 1993.
Monforte, L., Arroyo, M., Carbonell, J. M., and Gens, A.: Large-strain analysis of undrained smooth tube sampling, Géotechnique, 72, 61–77, https://doi.org/10.1680/jgeot.19.P.354, 2022.
Munsterman, D. K., ten Veen, J. H., Menkovic, A., Deckers, J., Witmans, N., Verhaegen, J., Kerstholt-Boegehold, S. J., van de Ven, T., and Busschers, F. S.: An updated and revised stratigraphic framework for the Miocene and earliest Pliocene strata of the Roer Valley Graben and adjacent blocks, Neth. J. Geosci., 98, https://doi.org/10.1017/njg.2019.10, 2019.
Neeft, E., Vuorio, M., Bartol, J., Verhoef, E., McCombie, C., and Chapman, N.: COPERA clay 2024: a conditional safety case and feasibility study, COVRA https://www.covra.nl/app/uploads/2025/03/COPERA-CLAY-2024_web.pdf (last access: 10 August 2026), 2024.
Tanaka, A., Nakano, T., and Ikehara, K.: X-ray computerized tomography analysis and density estimation using a sediment core from the Challenger Mound area in the Porcupine Seabight, off Western Ireland, Earth, Planet. Space, 63, 103–110, https://doi.org/10.5047/eps.2010.12.006, 2011.
Vardon, P. J., Bruhn, D. F., Steiginga, A., Cox, B., Abels, H., Barnhoorn, A., Drijkoningen, G., Slob, E., and Wapenaar, K.: A Geothermal Well Doublet for Research and Heat Supply of the TU Delft Campus, World Geothermal Congress, https://worldgeothermal.org/pdf/IGAstandard/WGC/2020/28025.pdf (last access: 10 August 2026), 2020.
Vardon, P. J., Laumann, S. J., Schmiedel, T., Vargas Meleza, L., Barnhoorn, A., Abels, H. A., Drijkoningen, G. G., Dieudonné, A. C., Beernink, S. T. W., and van den Berg, J. J.: Drilling report: Delftse Hout multipurpose research borehole – DAPGEO-02, Delft University of Technology [data set], https://doi.org/10.4233/uuid:fde70c00-cf65-4174-9cd3-89585a5e61bd, 2022.
Vardon, P. J., Abels, H. A., Barnhoorn, A., Beernink, S., Dieudonne, A.-C., Drijkoningen, G., Laumann, S., and Vargas Meleza, L.: Geothermal Project on TU Delft Campus – DAPGEO-02 Initial Borehole Dataset (Version 2), 4TU.ResearchData [data set], https://doi.org/10.4121/20299644.V2, 2023a.
Vardon, P. J., Dieudonne, A.-C., Abels, H. A., Beernink, S., Meijvogel-de Koning, E., Barnhoorn, A., Laumann, S., and Vargas Meleza, L.: Geothermal Project on TU Delft Campus – DAPGEO-02 Core CT-Scan Data (Version 2), 4TU.ResearchData [data set], https://doi.org/10.4121/21528819.V2, 2023b.
Vardon, P. J., Laumann, S., Abels, H. A., Barnhoorn, A., Bloemendal, M., Daniilidis, A., Drijkoningen, G., Koulidis, A., Vargas Meleza, L., Rulff, P., Sahin, M., and Voskov, D.: Geothermal Project on TU Delft Campus Collection, Version 9, 4TU.ResearchData [data set], collection, https://doi.org/10.4121/85b3725b-80fa-4b0b-9db2-475bfd8f0265.v9, 2026.
- Abstract
- Introduction
- Purpose and borehole design
- Physical samples
- Open-hole wireline logging
- Stratigraphy
- Seismic monitoring
- Data management
- Summary and conclusions
- Data availability
- Sample availability
- Author contributions
- Competing interests
- Disclaimer
- Acknowledgements
- Financial support
- Review statement
- References