Understanding volcanic facies in the subsurface: a combined core, wireline logging and image log data set from the PTA2 and KMA1 boreholes, Big Island, Hawai`i
Dougal A. Jerram
John M. Millett
Jochem Kück
Donald Thomas
Sverre Planke
Eric Haskins
Nicole Lautze
Simona Pierdominici
To help understand volcanic facies in the subsurface, data sets that enable detailed comparisons between down-hole geophysical data and cored volcanic intervals are critical. However, in many cases, the collection of extended core intervals within volcanic sequences is rare and often incomplete due to challenging coring conditions. In this contribution we outline and provide initial results from borehole logging operations within two fully cored lava-dominated borehole sequences, PTA2 and KMA1, on the Big Island of Hawai`i. Data for spectral gamma, magnetic susceptibility, dipmeter resistivity, sonic, total magnetic field, temperature and televiewer wireline logs were successfully acquired for the open hole interval ca. 889 m to 1567 m within the PTA2 borehole. Spectral gamma was also collected from inside the casing of both wells, extending the coverage for PTA2 to the surface and covering the interval from ca. 300 to 1200 m for KMA1. High-quality core material was available for both boreholes with almost complete recovery which enabled high-resolution core-to-log integration. Gamma data are generally low commonly in the range ca. 7–20 gAPI but are shown to increase up to API of ca. 60 with some intrusions and with increases in hawaiite compositions in the upper part of PTA2. Velocity data are more variable due to alteration within porous volcanic facies than with burial depth, with a general degrease down-hole. The high-resolution televiewer data have been compared directly to the core, enabling a comprehensive analysis of the variations in the televiewer responses. This has enabled the identification of key features including individual vesicles, vesicle segregations, strained vesicles, chilled margins, rubble zones, intrusive contacts and pāhoehoe lobe morphologies, which can be confidently matched between the televiewer data and the full diameter core. The data set and results of this study include findings which should enable improved borehole facies analysis through volcanic sequences in the future, especially where down-borehole data and images but no core are available.
- Article
(21469 KB) - Full-text XML
- BibTeX
- EndNote
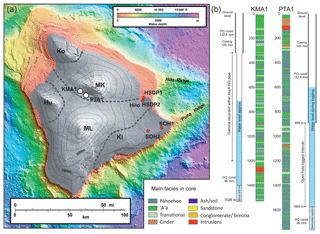
Figure 1(a) Location map of the PTA2 and KMA1 boreholes on a topographic and bathymetric map of Hawai`i (bathymetric map from USGS, Eakins et al., 2003). Locations of a selection of additional cored boreholes drilled on Hawai`i are also indicated (red dots) (SOH4 1989, 2.0 km; SOH1 1991, 1.7 km; HSDP1 1993, 1.1 km; HSDP2 1999, 3.1 km) (see also Garcia et al., 2007) (MK – Mauna Kea, ML – Mauna Loa, KI – Kilauea, HU – Hualālai, Ko – Kohala). (b) The cored sections of PTA2 and KMA1 are indicated with their generalized volcanic facies and well information.
Volcanic rocks (including intrusive and extrusive) occur in a variety of facies which reflect their composition, mode of emplacement and interaction with their host environment. The resultant volcanic units in turn comprise highly variable rock properties. When we examine the subsurface by remote geophysical tools we see an expression of these associated physical properties rather than the facies themselves, and where volcanic facies exist we can often be faced with a number of challenges in interpreting what we see, or in some cases cannot see. To this extent we can ask the following question: what are the key volcanic facies, what are their physical properties and how are these properties spatially distributed? Good onshore analogues provide an integral method of investigating these rock properties and heterogeneities in a way to help inform us as to their likely properties in the subsurface. Subsurface examples where fully cored sections through volcanic units combined with a comprehensive set of down-borehole remote data do exist, most notably from scientific drilling; however, examples where near-complete recovery exists are more limited (Ildefonse et al., 2007). This is in main part due to the highly variable physical properties of volcanic rocks and the consequence of these properties on drilling operations (Teagle et al., 2012; Millett et al., 2016), resulting commonly in challenging drilling conditions and incomplete core recovery. This is also compounded by many such drilling operations being conducted offshore, where ocean conditions make core recovery more challenging still. In consequence, our general understanding of volcanic facies in the subsurface is fairly comprehensive, but numerous gaps remain at the detailed level which require new data to better constrain the relationships between geophysical observations and formation characteristics.
Some significant studies do exist that have looked at the nature of volcanic rocks in the subsurface from borehole data (e.g., Planke, 1994; Helm-Clark et al., 2004; Bartetzko et al., 2005; Nelson et al., 2009). Perhaps some of the most significant developments in the interpretation of volcanic rocks from borehole data have come from the combined Ocean Drilling Program (ODP) and Integrated Ocean Drilling Program (IODP) literature which records the scientific findings of extensive offshore coring programs targeting both the oceanic crust and many of the world's volcanic rifted margins (e.g., Goldberg, 1997; Brewer et al., 1998; Teagle et al., 2012). In more recent years, offshore exploration for hydrocarbons in many of the world's rifted margins has also increased the number of data and studies relating to down-hole measurements through volcanic successions (e.g., Nelson et al., 2009, 2015; Andersen et al., 2009; Watton et al., 2014a; Millett et al., 2015; Fornero et al., 2018). In more direct relevance to this study, findings associated with drilling operations on Hawai`i including the over 3 km deep HSDP2 borehole have also led to significant advances in the identification and interpretation of volcanic rocks in the subsurface (e.g., Katz and Cashman, 2003; Garcia et al., 2007). Despite the many advances in volcanic borehole analysis, many challenges still remain. These include the delineation of volcanic intra-facies from remote-sensing data where a full core is not available along with an associated relative lack of high-quality petrophysical data for relevant volcanic intra-facies from variable depths and degrees of alteration. In most instances, the lack of fully cored intervals within the volcanic units hinders a full assessment of the volcanic facies present, especially in scenarios where large overlaps in petrophysical property ranges exist (e.g., Bartetzko et al., 2005; Nelson et al., 2009).
This contribution presents results from wireline logging operations undertaken in two fully cored boreholes within the Humu`ula Saddle region between the Mauna Kea and Mauna Loa volcanoes on the Big Island of Hawai`i (Fig. 1). The primary aim of this project was to attain high-quality wireline log data from the boreholes in order to undertake detailed core–log integrations for the penetrated volcanic facies. The two boreholes, PTA2 and KMA1, penetrated 1764 and 1528 m of subaerial lava-dominated sequences with subordinate minor intrusives and sediments respectively, with the entire sections fully cored. Lava facies include pāhoehoe, `a`ā and transitional types on a range of scales. The volcanic sequences comprise basaltic to picritic shield stage lavas of Mauna Kea capped by a thinner sequence of post-shield basalt-dominated (Hamakua Volcanics) to hawaiite-dominated (Laupahoehoe Volcanics) lavas (Frey et al., 1990). A wireline logging data set including spectral gamma, magnetic susceptibility, dipmeter resistivity, sonic, total magnetic field, temperature and televiewer images was acquired within the open hole interval ca. 889 to 1567 m of the PTA2 borehole. Additionally spectral gamma was collected from inside the casing of both wells, extending the coverage for PTA2 up to 0 m depth and covering the interval from ca. 300 to 1200 m for KMA1. The availability of a good-quality, near-continuous core for each well, along with the range and types of encountered volcanic facies, enabled a unique opportunity to improve our understanding of borehole characterization in volcanic sequences by comparison of remote data directly with cored intervals. This database, and in particular the comparison of image log data with core, highlights the potential for subsurface volcanic facies analysis where core data are not available.
The boreholes investigated within this paper were drilled as part of the Humu`ula Groundwater Research Project (HGRP), which commenced in 2013, affiliated with the Hawai`i Groundwater and Geothermal Resources Center (University of Hawai`i). One borehole (PTA2) was drilled on the Island of Hawai`i at the Pohakuloa Training Area (PTA) in 2013 and a second (KMA1) was drilled in 2015 ca. 11 km to the NW (Fig. 1). HGRP's primary scientific objective was to research and characterize the groundwater resources in Hawai`i Island's saddle region, which comprises a sequence of entirely subaerial lava flow with additional minor intrusions and sediments. The US Army, through the Army Corps of Engineers' Cooperative Ecosystem Studies Unit (CESU), provided funding for the drilling and core collection, whereas the US National Science Foundation provided funding for the initial characterization and logging of the core. The initial part of this project did not plan for any geophysical logging data acquisition.
Table 1Summary data of lithologies (facies) intersected in hole PTA2.
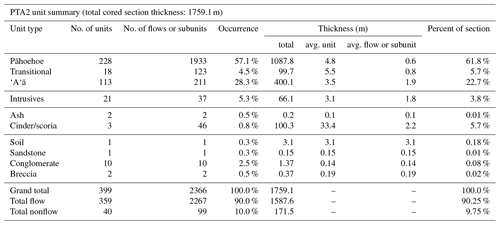
(1) There is one extremely thick laccolith or lopolith at the base of the
Laupahoehoe section that is 29.7 m thick, nearly doubling the overall
thickness of intrusives in the section.
(2) Cinder/scoria intervals are thought to represent cones or flanks of cones
built from this material during the post-shield stages of Mauna Kea's growth
(alternating with
pāhoehoe of constant lithology in the deeper cases; see
stratigraphic column).
(3) Potential ash and soil intervals are currently being interpreted by Dr.
Nicole Lautze; the number of these units may increase based on these
interpretations.
(4) While most of the conglomerate units are interpreted as fluvial or
colluvial, the uppermost (recovered in the first run of drilling) is thought
to be glacial in origin.
Discussions with Donald Thomas and Nicole Lautze (the principle project leaders) and Eric Haskins (core archive manager), from the University of Hawai`i, were initially sparked from scientific exchanges at the American Geophysical Union (AGU) 2013 meeting in San Francisco, USA. These exchanges identified the cored data set as a potentially valuable resource for further analysis. The idea of generating a complete core-to-remote-sensing suite for these wells was then further explored by Dougal Jerram (DougalEARTH Ltd. and University of Oslo), Sverre Planke (VBPR and University of Oslo) and John Millett (VBPR and University of Aberdeen) along with Donald Thomas. Funding for geophysical logging of the two boreholes was proposed and provided by the VMAPP (Volcanic Margin Petroleum Prospectivity) project (VBPR, DougalEARTH, and TGS) as part of the research module program. The aim was to generate one of the most complete data sets of fully cored volcanics with associated borehole measurements, to aid in our understanding of volcanic facies in the subsurface. The Operational Support Group (OSG) of ICDP (International Continental Scientific Drilling Program) at the GFZ German Research Centre for Geosciences in Potsdam (Germany) was then approached to undertake the logging. The logging project reported here was formed from a collaboration between VMAPP, the University of Hawai`i and OSG. Through this collaboration, the project gained full access to the core material enabling the unique opportunity of undertaking detailed core–log integration from a thick sequence of heterogeneous lava facies in order to improve our understanding of the geophysical response of these facies under differing subsurface regimes.
2.1 Borehole coring operations
The overall purpose of the project was an effort to better define hydrologic conditions in the central region of Hawaii Island. The prevailing hydrologic model for Hawaii is one of a relatively thin basal freshwater lens underlain by saltwater-saturated rocks below (e.g. Thomas et al., 1996). The findings of the Hawai`i Scientific Drilling Project (HSDP) for freshwater-saturated rocks at depths of ∼3 km below sea level near the Hawaii Island shoreline suggested that much more substantial freshwater resources were present within the interior of the island (Stolper et al., 2009). Surface resistivity surveys (Pierce and Thomas, 2009) identified subsurface conductive features that were consistent with high-elevation groundwater and two sites were selected for deep test holes. In light of the near absence of detailed stratigraphic data for the interior of Hawai`i Island, diamond wireline core drilling was selected as a means of both defining the elevation of the water table and recovering information on the stratigraphic features associated with high-elevation groundwater in the area.
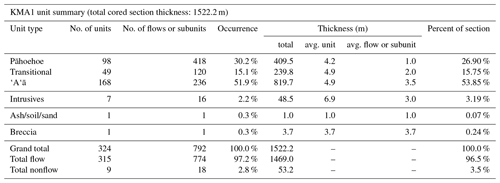
The drilling approach was to install shallow, large-diameter conductor casing, core to a depth of ∼65 m with PQ (122 mm diameter) coring tolls, open the hole with rotary tools and set surface (177 mm) casing to that depth, continue drilling with PQ to stable formations at one-third to one-half of the target depth, set (114 mm) casing to that depth, and continue to total depth (TD) with HQ (96 mm) coring tools. The PTA2 borehole was cored to a depth of 889 m (top of casing at 1943 m) with PQ tools and to at total depth of 1764 m with HQ tools. The KMA1 test hole was drilled to a depth of 298 m with PQ tools and to TD of 1531 m with HQ. Core recovery for the PTA2 hole averaged for the entire depth was about 97 %; core recovery for the KMA1 hole over the entire depth was about 91 %. A summary of the lithology of the cores from the PTA2 and KMA1 holes is presented in tabular form (see Tables 1 and 2).
More information about the project along with a complete photographic archive of the two borehole cores is available at the HGRP website (https://www.higp.hawaii.edu/hggrc/projects/humuula-groundwater-research-project/, last access: 2 February 2019). No geophysical logging data acquisition was planned as part of the HGRP project.
2.2 Logging operations
The initial logging project outline involved a single logging operation planned for December 2015 during which time logging of the open hole sections of both PTA2 and KMA1 was scheduled. Sonic, resistivity, spectral gamma, dipmeter, magnetic susceptibility, temperature, total magnetic field and televiewer tool logging were planned for both wells in order to allow detailed volcanic facies assessment and to test correlations between the two boreholes. Neutron and density tools have also been demonstrated to give important insights into volcanic facies (e.g., Planke, 1994; Shervais et al., 2013); however, due to the active radioactive sources in both tools, it was not possible to include these logs in the logging suite on Hawaii due to operational restrictions. In the end two logging trips were undertaken, the first in February 2016 and the second in June 2016, and only the open hole section of PTA2 was logged due to major complications associated with the final stages of drilling within KMA1 and subsequent efforts to resolve the resulting stuck pipe problem. In Fig. 2 selected photographs of the site and operations are presented.
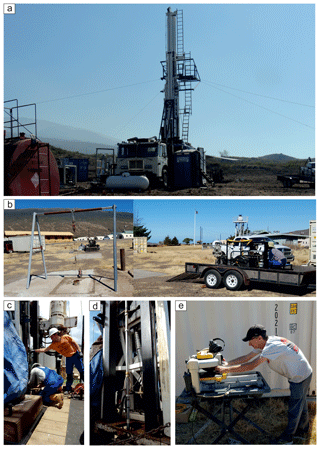
Figure 2(a) Drill truck at the KMA1 site. (b) Spectral gamma logging within casing at PTA2. (c) Jochem Kück and Marco Groh (GFZ) with the sonic sonde at PTA2. (d) Borehole televiewer sonde being lowered into the borehole at PTA2. (e) Eric Haskins cuts sections of core for additional sampling.
The slim hole wireline logging tools deployed during the logging operations were made by Antares, Germany, except for the acoustic televiewer ABI43, made by ALT, Luxembourg. All tool combinations included a natural total gamma ray (GR) measurement for depth correlation except for the ABI43. Logging was undertaken using a Comprobe electric winch with a Rochester 3/16′′, four-conductor cable provided by HGRP. The depth reference for all logging runs was ground level at ca. 1943 m above sea level (based on GPS elevation determination). Details of all the combined logging runs, logging speeds and measured intervals are given in Table 3.
2.3 Wireline log and televiewer processing
All borehole data were screened and processed by GFZ prior to interpretation. Depth corrections were applied to all logs primarily by gamma peak matching other than for the ABI43 which does not contain a gamma sensor. For depth correlation of the ABI43 logs the caliper data from the DIP meter proved useful in comparison with the televiewer travel time and amplitudes which are also highly sensitive to borehole size. The accuracy of this caliper match is even better than that of the GR match. Due to the very low total gamma response of the open hole section, the individual spectral gamma results for K, Th and U have been deemed below quantitative spectrum values and therefore only the total gamma is presented for this interval.
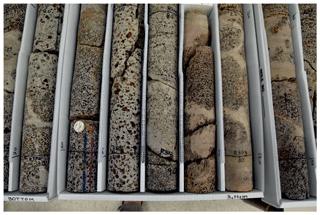
Figure 3Example of the exceptional core recovery from the wells (further examples can be seen in Figs. 9 and 10).
The raw sonic waveform data were processed using a combination of first arrival trace picking for P and S waves along with additional semblance analysis. In general, the P-wave picking was straight forward for most of the borehole; however, a strong direct wave interferes with the P-wave first arrival at lower velocities in the near receiver (Fig. 4), making accurate picking challenging. The S-wave arrival also becomes highly unclear in the upper part of the well above ca. 1100 m. Velocity data for the open hole section of PTA2 are therefore of mixed quality with generally improved confidence levels towards the base of the well.
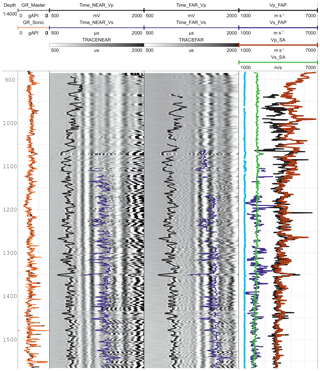
Figure 4Example of raw borehole sonic waveform data analysis from PTA2. Near- and far-receiver traces (50 cm spacing) with first arrival picking (FAP) results. The derived velocities are shown on the right side together with results from a separate semblance analysis (SA). The light-blue curve is the measured water wave velocity, and total GR is shown for depth correlation.
The televiewer data from PTA2 were acquired at the highest resolution and optimized logging speed to ensure the highest possible data quality. For both travel time and amplitude, static and dynamic (10 cm vertical window) normalizations were applied to improve imaging (Fig. 5). Each channel (raw, static, dynamic) for travel time and amplitude in particular displays minor to major differences in the resulting images depending on the scale and variations between different intervals and features. All output logs are displayed with a logarithmic scale with the ranges optimized for clarity (Fig. 5). Breakouts are very common in some intervals of the wellbore (e.g., ca. 1223.5 and ca. 1352 m). Examples of both key seat and breakouts are present. The correlation between sonic Vp and the televiewer amplitude data is variable, with some intervals showing clear associations (e.g., Fig. 5c) while in other examples the expected relationships are not apparent.
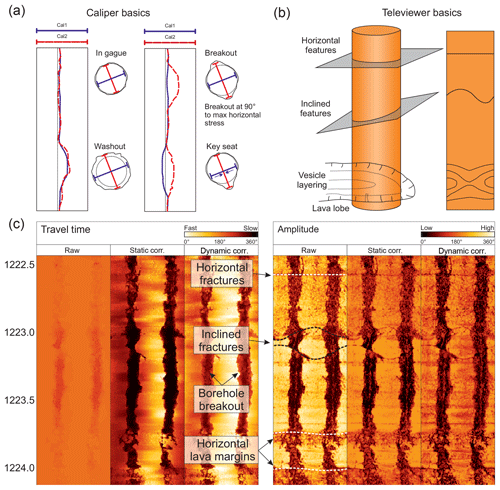
Figure 5(a) Simplified schematic displaying the four-arm caliper response to common borehole conditions (following Reinecker et al., 2003). (b) Basics of televiewer imaging of borehole features. (c) Example of some of these features from the PTA2 borehole televiewer data.
In summary, the logging data derived from the PTA2 borehole includes very high-quality data for the majority of the open hole logged sequence, and the separate log traces have been confidently depth matched. Accurate comparison between the borehole core and the inter-relationships of the geophysical properties can therefore be undertaken with similar confidence.
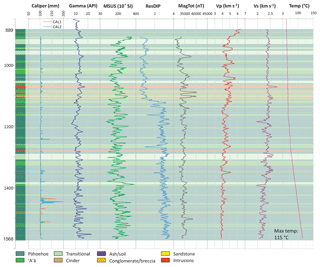
Within this section, results from the borehole logging are presented. The log data for the main open hole logged section are summarized in Fig. 6 along with a summary of the volcanic facies based on the core logging (Thomas and Haskins, 2013). Data from each sonde are described individually in relation to the volcanic stratigraphy in the following section. Unless otherwise stated, the presented logs display data with a 3 m running average applied to reduce data noise.
3.1 Caliper
The four-arm caliper sonde gives information on borehole diameter and shape. The caliper results from the open hole section of PTA2 display a generally good hole condition with a uniform diameter of ca. 98 mm (HQ core bit outer diameter ca. 96 mm) for the majority of the logged section (Fig. 6). Semi-continuous breakouts occur through large intervals of the borehole associated with the in situ stress field (breakouts parallel to minimum horizontal stress). These breakouts are often best developed within the most coherent and stiff facies, e.g., `a`ā interiors and intrusions, and are being investigated in ongoing research relating to the in situ stress regime of the Mauna Kea volcano.
The borehole diameter only exceeds 20 mm off-gauge in eight separate intervals, and, in a number of these cases, only one of the two caliper arm pairs exceed this deviation from the baseline indicative of an irregular borehole shape (e.g., key seat). Wider diameters occur over the full range of major facies within the borehole (Fig. 6); however, correlation between these and facies within some intervals is also observed. Most notably, in the upper ca. 300 m of the logged interval, the largest washouts occur dominantly either within `a`ā and transitional facies or at the transitions between these and pāhoehoe-dominated sequences. Washouts are also closely associated with minor intrusions leading up to ca. 1100 m. These observations appear consistent with the generally rubbly loose nature of `a`ā and, to a lesser degree, transitional lava flow margins which would be expected to cave most easily (Millett et al., 2016).
Fractures associated with intrusions along with the baking effect that they have on host rocks are also commonly associated with borehole breakouts in volcanic boreholes and therefore the caliper response in the upper part of the well is largely as expected. The largest washouts in the borehole occur in the lower part of the well, e.g., at ca. 1350, 1450 and 1520 m. These examples are less facies constrained, with two occurring largely within pāhoehoe sequences and, therefore, fracturing and/or alteration, known to be more pervasive within the lower borehole intervals, may have contributed to borehole instability in these cases.
3.2 Gamma
Gamma log responses are related to the abundance of the radioactive large ion lithophile elements K, U and Th in the measured rock volume. In volcanic rocks, the abundance of these elements is related to the primary magma composition that produced the resulting volcanic facies. In general, basaltic igneous rocks have very low abundances of the K, U and Th, especially in tholeiitic low K melts. Due to the general incompatibility of these elements during early fractional crystallization of basaltic melts, their abundance and therefore related API gamma responses increase with fractional crystallization and differentiation. Gamma ray responses can therefore be a good proxy for the degree of differentiation in volcanic rock suites (Stefansson et al., 2000; Delpino and Bermúdez, 2009), with higher gamma responses indicating more evolved compositions. Alteration and weathering processes are also known to affect gamma responses in basaltic rocks largely due to the water solubility and therefore mobility of K during alteration (e.g., Planke, 1994). In basaltic rocks, weathering at flow tops generally causes an increase in the gamma response above background levels within flow interiors (e.g., Planke, 1994).
The gamma response for the PTA2 borehole is generally very low with the majority of the well, displaying relatively uniform API counts of <20. Intervals with high API counts do occur in the upper part of the borehole but are restricted to depths shallower than ca. 700 m (Fig. 7) and increase in frequency and extent upwards over this depth interval. Interestingly, the highest gamma intervals, which reach up to API of ca. 60, are almost exclusively associated with intrusions identified from the core logging. A number of lava flows within the upper section of the well also show elevated API when compared to similar lava facies at greater depth. It is noted from the core descriptions of PTA2 that hawaiite compositions become more common towards the top of the sequence, associated with the post-shield pāhoehoe lavas, in addition to the multiple fine-grained minor intrusions identified within these sections (e.g., Fig. 7). Hawaiite comprises a more evolved melt than basalt and therefore is expected to contain larger percentages of incompatible elements such as K, U and Th, resulting in increased gamma response.
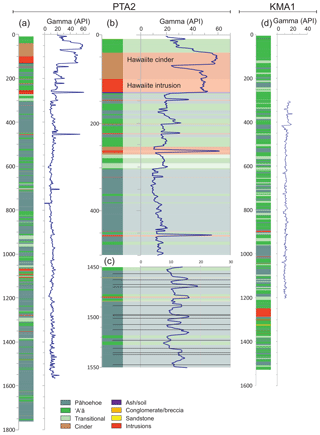
Figure 7Gamma ray log results compared to volcanic facies in the PTA2 and KMA1 boreholes (a, d). Two panels in the center display key intervals from PTA2 at a larger scale (b, c). Black lines display flow boundaries within pāhoehoe packages in the bottom middle panel.
Within the lower part of the well, gamma variations are far more restricted with values generally within the range ca. 7–20 API. In Fig. 7c, an expanded example from the interval ca. 1450–1550 m is presented. It is clear that systematic variations in gamma response are also exhibited within this lava-dominated sequence. Flow margins are highlighted for clarity and it is seen that inflections in the gamma peaks and troughs are readily associated with flow margins. Flow margins are not, however, always associated with increases in gamma response and therefore a combination of resolution, alteration and subtle base-level compositional differences between the flows of the lower sequence are the cause of the gamma variations.
The results for KMA1, collected from within the HQ drill string during the time it was stuck, are also presented in Fig. 7d alongside the detailed core-based stratigraphy. Very little variation is observed within the gamma response for the logged interval of KMA1. The high gamma peaks observed in the upper parts of PTA2 are not observed within the sampled interval; however, the data do not cover the upper 300 m in KMA1. It could therefore be that higher gamma compositions are also present within this upper sequence of KMA1; however, the lack of any intrusions in this sequence (which hosted the majority of the higher gamma intervals in PTA2) may suggest that they are not present at KMA1.
3.3 Magnetic susceptibility (MSUS) and total magnetic field (MagTot)
Basaltic rocks have the potential to record strong magnetic signatures due to the common presence of accessory iron and iron–titanium oxide minerals such as magnetite, spinel and ilmenite. The remnant magnetic response of basaltic rocks is determined by a combination of the presence, type and abundance of these Fe–Ti oxides in addition to crystal size and alteration (e.g., Planke et al., 1999). Magnetic susceptibility measures the ability of a rock formation to become magnetized in response to an applied magnetic field and in its simplest application gives inference to the abundance of ferromagnetic magnetic minerals within the tested rock volume. Magnetic susceptibility in basaltic rocks is therefore affected by much the same parameters as the total magnetic field.
Magnetic susceptibility within the open hole section of PTA2 is dominantly within the range of ca. 100–350 10−4 SI units while the total magnetic field displays values dominantly around the ca. 35 000 nT mark with a small number of excursions reaching higher values of maximum ca. 40 000 nT and some lower values down to ca. 32 100 nT in the upper part of the logged interval. The two highest peaks in total magnetic field are broadly associated with intrusions at ca. 1100 m, both of which also display elevated susceptibilities (Fig. 6). In some other cases intrusions display clearly elevated values; however, in others, no observable increase from background is seen. No clear and general relationship is observed between MSUS and MagTot; in some cases they appear linked, in others they appear independent. Magnetic susceptibility shows a significant level of systematic variations associated with lava facies flow packages and boundaries. The response is not uniform in nature but, in many instances, a sharp reduction or increase in susceptibility can be seen at or in other cases immediately prior to the facies boundaries (e.g., Fig. 6). Planke et al. (1999) demonstrated that flow top alteration can cause a kick in susceptibility values at the transition from lava interiors up into the crust and at least in some instances; this feature appears to be replicated in the PTA2 lavas.
3.4 DIP meter
The DIP meter records resistivity data but is uncalibrated and therefore it may be used to qualitatively assess relative resistivity of the formation. With the lack of laterolog resistivity data this comprises the best available inference for the PTA2 borehole. Figure 6 displays the DIP meter resistivity for the PTA2 borehole plotted against the other wireline data. The most striking feature of the resistivity data is a large step shift to higher average values at ca. 1130 m. Above and below this transition the variations are quite scattered with an irregular serrated character but importantly there is almost no overlap in the absolute ranges within these two sections.
Geologically there is not a sufficient change in the penetrated facies which could account for this change in the resistivity range. Alteration is known to increase within the lower interval which could potentially explain some of the increased resistivity where pores are filled with secondary minerals, but cannot explain the sharp transition. Interestingly, the jump in resistivity corresponds to a depth at which very slow drilling conditions were encountered that were associated with a particular type of secondary mineral products (zeolites). The secondary minerals formed a thick film on the bit face that the diamond chips on the standard bit were not able to penetrate through; after a change in the bit to larger diamonds this issue was overcome. This is still problematic to explain the base-level shift as the lava cores within each section should show broadly similar values. Another more likely possibility is that it is associated with the borehole fluids. A range of mud additives were added to the drilling fluid during clearing of the borehole ca. 2 months prior to the logging operations and, therefore, it could be that density stratification may have occurred and that the heavier muds in the lower section have a higher resistivity than fresh formation water above.
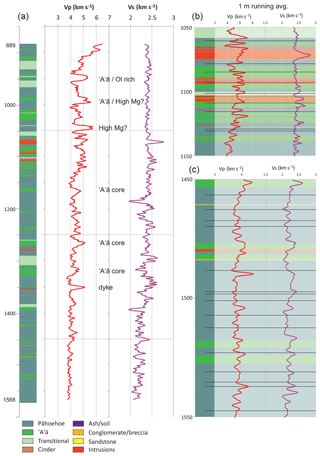
Figure 8(a) Vp and Vs data from the PTA2 sonic log plotted against the volcanic lithofacies. (b, c) Zoomed-in logs which both display data with a 1 m running average applied; black lines indicating flow and contact boundaries between similar facies. Ol rich stands for olivine rich.
A number of aquifer feed points are known from within the upper part of the well (Thomas and Haskins, 2013) and therefore circulation of aquifer waters into the borehole may have added to this effect. An inflection to a higher temperature gradient ca. 100 m deeper than the step in resistivity also points to different fluid regimes within the borehole and could support some sort of fluid stratification. More work is required to constrain this further.
Although there is some correlation between the volcanic stratigraphy and the resistivity (Fig. 6), the relationship is not consistently related to the primary volcanic facies. Resistivity usually decreases at lava flow boundaries due to increases in vesicles, alteration and fracturing (Planke, 1994; Nelson et al., 2009). This is observed at some flow margins but not at others. Dense intrusion interiors and non-vesicular lava flow interiors are expected to display high resistivity, which is observed in some cases, e.g., the intrusions at ca. 1050–1110, but not in other cases, e.g., ca. 1480 m. Extensive fracturing may explain some of these deviations; however, some concerns regarding the consistency and accuracy of the data remain due these poor correlation examples along with the poorly understood jump in values described above.
3.5 Sonic
Velocity data from the sonic log has historically proven to provide some of the most instructive information for the interpretation of volcanic rocks in the subsurface (Planke, 1994). This is because different volcanic facies show a very wide range of velocity but also display distinctive distributions of velocity (e.g., Nelson et al., 2009), which can be tied back to volcanic facies at a variety of scales. P-wave (Vp) and S-wave (Vs) results from the picked and processed sonic log data are presented in Fig. 8. P-wave velocity data for the borehole give robust data, whereas picking for S waves was significantly more challenging and therefore gave lower confidence results in the upper part of the sequence. The average Vp for the logged interval is ca. 4.4 km s−1 while the average Vs is ca. 2.35 km s−1. There is a generally good correlation between dense crystalline core material associated with sheet intrusions and `a`ā lava cores and high Vp signatures in some cases exceeding 6 km s−1. Exceptions do occur where high Vp is associated with pāhoehoe lavas with no obvious evidence for denser-than-normal cores and in these cases (e.g., at ca. 1045 m) the higher densities may be related to a combination of denser (high Vp) phenocrysts phases (e.g., olivine) and significantly denser (Mg rich) basic magmas (Watton et al., 2014b).
The largest variations observed within the sequence occur within the zone ca. 950–1150 m in which the greatest diversity of volcanic facies exists. Low peak velocities down to ca. 4 km s−1, within the lower part of the well, are associated with dominantly compound-braided pāhoehoe facies (e.g., Jerram, 2002; Nelson et al., 2009). The low velocity is associated with the facies which display generally high levels of vesicularity and porosity along with increased levels of alteration with burial. It is also clear that background velocity values appear to be more affected by alteration than they are by the increase in burial compaction stresses. This is explicable by the fact that fresh basalt at ambient pressure can commonly exceed velocities of 5 km s−1 due to its hard interlocking crystal structure, and, due the strength within this structure, even moderately vesicular basalts show little reduction in porosity (and hence velocity) with burial effects alone (Millett et al., 2016). At the same time, alteration (where pervasive) can reduce the velocity of basalt by up to 2 km s−1. Therefore, at relatively shallow burial depths, average velocity can clearly reduce with depth in association with facies that are susceptible to alteration as is the case for the porous pāhoehoe-dominated lava sequence. Clear correspondence between Vp and Vs is visible for some intervals of the well (e.g., Fig. 8); however, in other intervals, no or limited correspondence exists. The Vp ∕ Vs ratio for the entire well is ca. 1.88, whereas for the interval at the bottom of the well where good correspondence exists it is slightly lower at ca. 1.79. Both values are within the same range as for older lava sequences, e.g., from eastern Greenland (Planke and Cambray, 1998); however, they are slightly higher than the average of 1.69 recorded from laboratory measurements on Hawaiian compositions (e.g., Manghnani and Woollard, 1968). As discussed in the processing section, the confidence in the S-wave picking in the upper part of the borehole is reduced. It is interesting to note that the S-wave data become challenging to pick at a very similar depth to that which the resistivity data displays a large jump in base level. It could therefore be that something relating to the fluid properties within the upper part of the open hole section also affected the sonic log data, although this also requires additional investigation beyond the scope of this report.
3.6 Televiewer
The televiewer tool collects high-resolution velocity data (amplitude and travel time) for the full circumference of the borehole which is processed to give a continuous acoustic image of the borehole surface (Zemaneck et al., 1969). The televiewer is most commonly utilized for structural and stress field analysis (e.g., Zoback et al., 1985; Ziegler et al., 2016; Millett et al., 2018); however, the images may also give potentially important information about volcanic facies and intra-facies. The ability for image logs to characterize volcanic facies elements has been highlighted for the FMS and FMI logs (resistivity imaging, Brewer et al., 1998; Tominaga, 2013; Watton et al., 2014a; Fornero et al., 2018); however, similar dedicated studies for the interpretation of volcanic facies from the televiewer appear somewhat limited and of lower apparent image quality to date (e.g., Massiot et al., 2015). Acquisition of high-quality televiewer data formed one of the primary objectives of the Hawai`i borehole operations.
In general, the image quality from the PTA2 borehole is very good, with many intervals displaying exceptional feature clarity while in a few intervals image quality is reduced and acquisition artefacts obscure the images. The key objective for collecting high-resolution image data was to test the ability of the televiewer to capture detailed volcanic intra-facies remotely, which is made possible by the availability of continuous core data. A full core is rarely available for volcanic wells, even for scientific drilling (e.g., Brewer et al., 1998), whereas for petroleum exploration wells, only very small core sections are commonly taken but these rarely intersect volcanic intervals. Throughout the logged interval, there is a depth discrepancy whereby the televiewer depths are generally ca. 1.6 m deeper than the core depth values. Additional to this correction, in many cases the resulting boxed core material from individual core pipe runs (ca. 10 ft) may exceed or not equate exactly to the known penetration. This is simply due to the fact that the core is sometimes broken and fragmented and therefore does not fit perfectly back together, resulting in longer recorded lengths compared to the known penetration. The depth is reset at the start of each core run and therefore only minor errors (generally < 30 cm) may be encountered at the bottom of some runs.
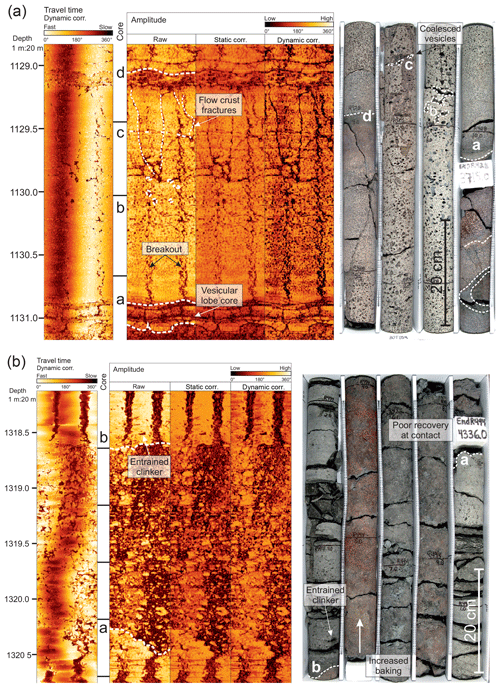
Figure 9(a) Example of a simple pāhoehoe lobe from PTA2 displaying characteristic vesicle size distribution clearly imaged from the televiewer amplitude data along with flow top fractures. (b) Detail of a baked `a`ā flow margin breccia from PTA2. Note the detail at the flow margins is clearer from the televiewer data due to the crumbly nature of the contact rubble. In each image, letters (a, b, etc.) highlight linked features on both the core and the image log.
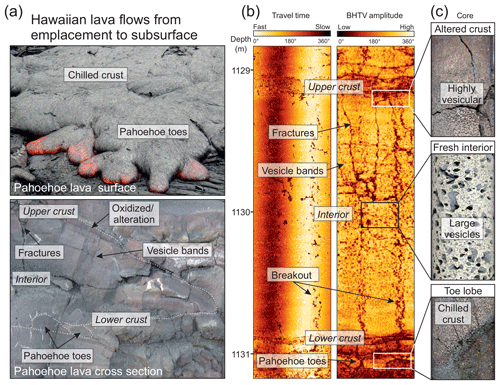
Figure 10Examples of pāhoehoe and `a`ā facies: (a) from eruption and outcrop, (b) as imaged in televiewer, and (c) examples from the cored section.
To highlight the potential of televiewer images for volcanic facies delineation, in Fig. 9, type examples of pāhoehoe and `a`ā lava facies are presented and compared to observations from core. In Fig. 9a, an individual simple pāhoehoe lava lobe is characterized by clear vesicle size and abundance variations with dense small vesicles at the lower and upper vesicle zones (LVZ and UVZ following Katz and Cashman, 2003), transitioning into fewer larger vesicles within the central portion of the flow interior. Large vesicles within the central portion of the flow lobe can be clearly seen within the televiewer amplitude data along with subparallel vesicle coalescence bands within the UVZ to flow top transition. As is typical of pāhoehoe lavas, the altered flow top crust is thicker than the flow base and has also been baked by the overlying flow increasing the degree of alteration. This is also observed on the televiewer data, with a broader band of lower amplitudes at the top of the flow. Flow top fractures which terminate within the flow core are also clearly observed from the televiewer amplitude data, which importantly suggests that the corresponding fractures in the core are primary and not drilling induced. Along compound pāhoehoe lava sections within the data, multiple thin lava lobes and pāhoehoe “toes” in addition to internal boundaries delineated by vesicle bands and chilled margins can be seen which would have formed during emplacement. Chilled margins are generally highly altered to clay or palagonite and dominantly display clear low-amplitude boundaries. Spherical-to-sub-spherical features are identified from the televiewer where these chilled margins or internal densely vesicular bands intersect the borehole at a toe termination or margin. Spongy pāhoehoe flow cores or lobe and toe cores display very low amplitudes due to a very low proportion of lava (vesicle walls) compared to open space where porosities commonly exceed 50 % (e.g., Walker, 1989).
`A`ā lavas comprise the other major lava flow type found on Hawai`i and in basaltic lava provinces in general. They are characterized by rubbly and brecciated upper and lower margins due to auto-brecciation of the lava flow crust during emplacement. In Fig. 9b an example of an `a`ā rubbly flow margin is presented. The flow margin breccia belongs to the underlying flow interior and has been baked and oxidized by the overlying lava flow. The breccia displays a very clear and characteristic fabric comprising high-amplitude clasts within a low-amplitude finer-grained matrix. In other examples clear straining of regions showing different vesicle densities is observed within the flow core, a common feature of `a`ā lavas where the lava continues to move during cooling and vesiculation causing deformation of the developing vesicular fabric (Cas and Wright, 1988). These sharp boundaries between the zones of different vesicle densities are clearly represented on the televiewer amplitude data along with examples of larger deformed vesicles near flow bases. Vesicle segregations and entrained clinker are also potentially visible as patches of low amplitude which match the core well in a number of examples. Recovery can commonly be poor within `a`ā lavas due to heavy fracturing and the presence of loose rubble and, therefore, identifying flow features remotely (e.g., televiewer) may prove invaluable in understanding the volcanic sequence where such core gaps occur.
Many other detailed facies and intra-facies features including transitional lavas, sedimentary units, ash layers and intricate intrusive units have been investigated in detail from the Hawai`i boreholes and will form the basis of a standalone study presented elsewhere.
This paper presents results from new borehole wireline logging and image logging of two fully cored boreholes on the Big Island of Hawai`i. Through this project an important database of down-borehole petrophysical variations has been collected, which can be interpreted in full due to the exceptional core data available over a large interval of the PTA2 borehole. Such data are often hard to realize in many offshore areas that drill through volcanic successions due to the costs alongside the volcanic intervals often not forming reservoir targets. Additionally the data set provides a valuable resource to look at average flow thickness, number of flow units and flows, and volcanic facies structure.
Gamma data are typically low as expected for basalts with variations occurring where intrusions come in and with an increase due to more evolved hawaiite compositions. Within the magnetic data, the two highest peaks in total magnetic field are broadly associated with intrusions at ca. 1100 m, yet other intrusions and the relation of the magnetic data to the varying volcanic facies show mixed results. Alteration at flow tops can show kicks in the susceptibility, which has been demonstrated to be the case in other lava successions (e.g., Planke et al., 1999). Resistivity data from DIP meter records show some correlation to volcanic facies in some areas but not in others, which could be due to a number of factors (e.g., variations in fracturing, lack of calibration of DIP meter readings). Such data could be improved with better constrained laterolog resistivity data. Variations within the velocity with depth are clearly influenced by alteration of the porous lavas and associated facies, with a noted degrease in velocity in the lower part of the well. The caliper results highlight semi-continuous breakouts occurring down the wells, best developed in the most coherent facies (e.g., `a`ā interiors and intrusions), which are associated with the in situ stress field (breakouts occur parallel to minimum horizontal stress). The directions of these breakouts can be of use in unraveling the in situ stress regime of the Mauna Kea volcano and as such are forming the basis of ongoing research.
The televiewer borehole imaging sonde, as an example, can produce highly informative data for delineating small-scale volcanic features and intra-facies when optimized settings are used. Features including individual vesicles, vesicle segregations, strained vesicles, chilled margins, rubble zones, intrusive contacts and pāhoehoe lobe morphologies can be confidently matched between the televiewer data and the full diameter core. One of our main goals in undertaking such a study is the potential ability to link facies with analogue examples and ultimately get back to the geological processes that have formed the petrophysical variations preserved in the rocks. Figure 10 acts as a summary of this concept by linking back our down-borehole observations to the key volcanic facies that formed them. Going forward, data sets like the one presented here allow improved confidence in the interpretation of borehole imaging through volcanic sequences where core is not available. Ongoing and future work will focus on the detail within the data set to fully explore the key volcanological, structural and geophysical inferences that can be gained from this case example.
A digital archive of core photos and detailed core run depth log information is available at https://www.higp.hawaii.edu/hggrc/projects/humuula-groundwater-research-project/ (HGGRS, 2019). The down-hole data are published with a digital object identifier via GFZ Data Services (Kück, 2019).
The manuscript was prepared by DAJ and JMM, with additional contributions and edits by all members of the author list. The project started with initial discussions between DougalEARTH (DAJ) and Hawaii (NL, DT), at the fall AGU meeting in San Francisco in 2013. A program of acquisition was agreed to by VBPR/DougalEARTH (DAJ, SP), GFZ Potsdam (JK) and Hawaii (DT). DAJ and SP visited the site and the core data set with Haskins and Thomas in December 2015 for project planning. Data acquisition was undertaken on site in February and June 2016 (JMM, JK, EH and DT). Once acquired, Pierdominici carried out additional work on the televiewer data.
The authors declare that they have no conflict of interest.
This project was made possible by the collaborative outlook of the main
partners (VBPR and DougalEARTH, GFZ, and the University of Hawai`i) and the
extensive background work undertaken by the researchers at the Hawai`i
Groundwater and Geothermal Resources Center (University of Hawai`i) and from
the HGRP project. Jehanne Paris is thanked for helping organize the logging
operations and helping in the field. Martin Töpfer and Marco Groh
(Operational Support Group, OSG, of ICDP, GFZ) are thanked for ensuring the smooth
running of the logging operations. Dougal Jerram and Sverre Planke are also
supported by the Research Council of Norway, through its Centres of
Excellence funding scheme, project 223272 at CEED, University of Oslo. We
would like to thank Breno Waichel and John Shervais for constructive reviews
and the editorial team at Scientific Drilling for their prompt handling and
meticulous guidance through the various stages from submission to
publication.
Edited by: Tomoaki
Morishita
Reviewed by: Breno Waichel and John Shervais
Andersen, M. S., Boldreel, L. O., and Seifaba Group: Log responses in basalt successions in 8 wells from the Faroe-Shetland Channel – a classification scheme for interpretation of geophysical logs and case studies. Faroe Islands Exploration Conference: Proceedings of the 2nd Conference, Annales Societatis Scientiarum Færoensis, Supplementum, 50, 364–391, 2009.
Bartetzko, A., Delius, H., and Pechnig, R.: Effect of compositional and structural variations on log responses of igneous and metamorphic rocks. I: mafic rocks, Geological Society, London, Special Publications, 240, 255–278, https://doi.org/10.1144/GSL.SP.2005.240.01.19, 2005.
Brewer, T. S., Harvey, P. K., Lovell, M. A., Haggas, S., Williamson, G., and Pezard, P.: Ocean floor volcanism: constraints from the integration of core and downhole logging measurements, Geological Society, London, Special Publications, 136, 341–362, https://doi.org/10.1144/GSL.SP.1998.136.01.28, 1998.
Cas, R. A. F. and Wright, J. V.: Lava flows. In Volcanic Successions Modern and Ancient, 58–91, Springer Netherlands, 1988.
Delpino, D. H. and Bermúdez, A. M.: Petroleum systems including unconventional reservoirs in intrusive igneous rocks (sills and laccoliths), The Leading Edge, 28, 804–811, https://doi.org/10.1190/1.3167782, 2009.
Eakins, B. W., Robinson, J. E., Kanamatsu, T., Naka, J., Smith, J. R., Takahashi, E., and Clague, D. A.: Hawaii's volcanoes revealed: U.S. Geological Survey Geologic Investigations Series Map I-2809, 1 plate, https://pubs.usgs.gov/imap/2809/ (last access: 2 February 2019), 2003.
Fornero, S. A., Marins, G. M., Lobo, J. T., Freire, A. F. M., and de Lima, E. F.: Characterization of subaerial volcanic facies using acoustic image logs: Lithofacies and log-facies of a lava-flow deposit in the Brazilian pre-salt, deepwater of Santos Basin, Mar. Petrol. Geol., 99, 156–174, https://doi.org/10.1016/j.marpetgeo.2018.09.029, 2018.
Frey, F. A., Wise, W. S., Garcia, M. O., West, H., Kwon, S. T., and Kennedy, A.: Evolution of Mauna Kea Volcano, Hawaii: Petrologic and geochemical constraints on postshield volcanism, J. Geophys. Res.-Sol. Ea., 95, 1271–1300, https://doi.org/10.1029/JB095iB02p01271, 1990.
Garcia, M. O., Haskins, E. H., Stolper, E. M., and Baker, M.: Stratigraphy of the Hawai'i Scientific Drilling Project core (HSDP2): Anatomy of a Hawaiian shield volcano, Geochem. Geophy. Geosy., 8, https://doi.org/10.1029/2006GC001379, 2007.
Goldberg, D.: The Role of Downhole Measurements in Marine Geology and Geophysics, Rev. Geophys., 35, 315–342, https://doi.org/10.1029/97RG00221, 1997.
Helm-Clark, C. M., Rodgers, D. W., and Smith, R. P.: Borehole geophysical techniques to define stratigraphy, alteration and aquifers in basalt, J. Appl. Geophys., 55, 3–38, https://doi.org/10.1016/j.jappgeo.2003.06.003, 2004.
Hawai`i Groundwater & Geothermal Resources Center (HGGRC): Humu`ula Groundwater Research Project, available at: https://www.higp.hawaii.edu/hggrc/projects/humuula-groundwater-research-project/, last access: February 2019.
Ildefonse, B., Rona, P. A., and Blackman, D.: Drilling the Crust at Mid-Ocean Ridges: An “In Depth” Perspective, Oceanography, 20, 66–77, https://doi.org/10.5670/oceanog.2007.81, 2007.
Jerram, D. A.: Volcanology and facies architecture of flood basalts, Volcanic Rifted Margins, 362, 119, https://doi.org/10.1130/0-8137-2362-0.119, 2002.
Katz, M. G. and Cashman, K. V.: Hawaiian lava flows in the third dimension: Identification and interpretation of pahoehoe and `a`a distribution in the KP-1 and SOH-4 cores, Geochem. Geophy. Geosy., 4, 8705, https://doi.org/10.1029/2001GC000209, 2003.
Kück, J.: Composite OSG Logging Data from the PTA-2 borehole, Big Island, Hawai'i, GFZ Data Services, https://doi.org/10.5880/GFZ.4.8.2019.011, 2019.
Manghnani, M. H. and Woollard, G. P.: Elastic wave velocities in Hawaiian rocks at pressures to ten kilobars. The Crust and Upper Mantle of the Pacific Area, American Geophysical Union Geophysical Monograph Series, 12, 501–516, https://doi.org/10.1029/GM012p0501, 1968.
Massiot, C., McNamara, D. D., and Lewis, B.: Processing and analysis of high temperature geothermal acoustic borehole image logs in the Taupo Volcanic Zone, New Zealand, Geothermics, 53, 190–201, https://doi.org/10.1016/j.geothermics.2014.05.010, 2015.
Millett, J. M., Hole, M. J., Jolley, D. W., Schofield, N., and Campbell, E.: Frontier exploration and the North Atlantic Igneous Province: new insights from a 2.6 km offshore volcanic sequence in the NE Faroe–Shetland Basin, J. Geol. Soc., 173, 320–336, https://doi.org/10.1144/jgs2015-069, 2015.
Millett, J. M., Wilkins, A. D., Campbell, E., Hole, M. J., Taylor, R. A., Healy, D., Jerram, D. A., Jolley, D. W., Planke, S., Archer, S. G., and Blischke, A.: The geology of offshore drilling through basalt sequences: Understanding operational complications to improve efficiency, Mar. Petrol. Geol., 77, 1177-1192, https://doi.org/10.1016/j.marpetgeo.2016.08.010, 2016.
Millett, J. M., Planke, S., Kästner, F., Blischke, A., Hersir, G. P., Halldórsdóttir, S., Flóvenz, Ó. G., Árnadóttir, S., Helgadóttir, H. M., Vakulenko, S., and Buryak, S.: Sub-surface geology and velocity structure of the Krafla high temperature geothermal field, Iceland: Integrated ditch cuttings, wireline and zero offset vertical seismic profile analysis, J. Volcanol. Geoth. Res., https://doi.org/10.1016/j.jvolgeores.2018.03.024, 2018.
Nelson, C. E., Jerram, D. A., and Hobbs, R. W.: Flood basalt facies from borehole data: implications for prospectivity and volcanology in volcanic rifted margins, Petrol. Geosci., 15, 313–324, https://doi.org/10.1144/1354-079309-842, 2009.
Nelson, C. E., Jerram, D. A., Clayburn, J. A. P., Halton, A. M., and Roberge, J.: Eocene volcanism in 1598 offshore southern Baffin Bay, Mar. Petrol. Geol., 67, 678–691, https://doi.org/10.1016/j.marpetgeo.2015.06.002, 2015.
Pierce, H. A. and Thomas, D. M.: Magnetotelluric and audiomagnetotelluric groundwater survey along the Humu'ula portion of Saddle Road near and around the Pohakuloa Training Area, Hawaii: U.S. Geological Survey Open-File Report 2009–1135, 160 p., on one CD, also available at: https://pubs.usgs.gov/of/2009/1135 (last access: February 2019), 2009.
Planke, S.: Geophysical response of flood basalts from analysis of wire line logs: Ocean Drilling Program Site 642, Vøring volcanic margin, J. Geophys. Res.-Sol. Ea., 99, 9279–9296, https://doi.org/10.1029/94JB00496, 1994.
Planke, S. and Cambray, H.: Seismic properties of flood basalts on rifted volcanic margins based on Ocean Drilling Program (ODP) Hole 917A downhole data, Proc. Ocean Drill. Program Sci. Results, 152, 453–462, https://doi.org/10.2973/odp.proc.sr.152.247.1998, 1998.
Planke, S., Cerney, B., Bücker, C. J., and Nilsen, O.: Alteration effects on petrophysical properties of subaerial flood basalts: Site 990, Southeast Greenland margin, Proc. Ocean Drill. Program Sci. Results, 163, 17–28, https://doi.org/10.2973/odp.proc.sr.163.105.1999, 1999.
Reinecker, J., Tingay, M., and Müller, B.: Borehole Breakout Analysis from Four-arm Caliper Logs, World Stress Map Project, WSM, available at: http://dc-app3-14.gfz-potsdam.de/pub/guidelines/WSM_analysis_guideline_breakout_caliper.pdf (last access: February 2019), 2003.
Shervais, J. W., Schmitt, D. R., Nielson, D., Evans, J. P., Christiansen, E. H., Morgan, L., Pat Shanks, W. C., Prokopenko, A. A., Lachmar, T., Liberty, L. M., Blackwell, D. D., Glen, J. M., Champion, L. D., Potter, K. E., and Kessler, J. A.: First Results from HOTSPOT: The Snake River Plain Scientific Drilling Project, Idaho, U.S.A., Sci. Dril., 15, 36–45, https://doi.org/10.2204/iodp.sd.15.06.2013, 2013.
Stefansson, V., Gudlaugsson, S. T., and Gudmundsson, A.: Silica content and gamma ray logs in volcanic rocks, Proceedings of the World Geothermal Congress, Kyushu–Tohoku, Japan, 28, 2893–2897, 2000.
Stolper, E. M., DePaolo, D. J., and Thomas, D. M.: Deep Drilling into a Mantle Plume Volcano: The Hawaii Scientific Drilling Project, Sci. Dril., 7, 4–14, https://doi.org/10.2204/iodp.sd.7.02.2009, 2009.
Teagle, D. A. H., Ildefonse, B., Blum, P., and the Expedition 335 Scientists: Proc. IODP, 335: Tokyo (Integrated Ocean Drilling Program Management International, Inc.), https://doi.org/10.2204/iodp.proc.335.101.2012, 2012.
Thomas, D. and Haskins, E.: Analysis of the hydrologic structures within an ocean island volcano using diamond wireline core drilling, American Geophysical Union conference, San Fransisco, 2013.
Thomas, D. M., Paillet, F. L., and Conrad, M. E.: Hydrogeology of the Hawaii Scientific Drilling Project borehole KP-1: 2. Groundwater geochemistry and regional flow patterns, J. Geophys. Res., 101, 11–683, https://doi.org/10.1029/95JB03845, 1996.
Tominaga, M.: “Imaging” the cross section of oceanic lithosphere: The development and future of electrical microresistivity logging through scientific ocean drilling, Tectonophysics, 608, 84–96, https://doi.org/10.1016/j.tecto.2013.06.018, 2013
Walker, G. P.: Spongy pahoehoe in Hawaii: a study of vesicle-distribution patterns in basalt and their significance, B. Volcanol., 51, 199–209, https://doi.org/10.1007/BF01067956, 1989.
Watton, T. J., Cannon, S., Brown, R. J., Jerram, D. A., and Waichel, B. L.: Using formation micro-imaging, wireline logs and onshore analogues to distinguish volcanic lithofacies in boreholes: examples from Palaeogene successions in the Faroe–Shetland Basin, NE Atlantic, Geological Society, London, Special Publications, 397, 173–192, https://doi.org/10.1144/SP397.7, 2014a.
Watton, T. J., Wright, K. A., Jerram, D. A., and Brown, R. J.: The petrophysical and petrographical properties of hyaloclastite deposits: Implications for petroleum exploration, AAPG Bulletin, 98, 449–463, https://doi.org/10.1306/08141313029, 2014b.
Zemaneck, J., Caldwell, R. L., Glenn, E. E., Holcomb, S. V., Norton, L. J., and Strauss, A. J. D.: The borehole televiewer – a new logging concept for fracture location and other type of borehole inspection, J. Petrol. Technol., 21, 762–774, https://doi.org/10.2118/2402-PA, 1969.
Ziegler, M., Heidbach, O., Rajabi, M., Hersir, G. P., Ágústsson, K., Árnadóttir, S., and Zang, A.: The stress pattern of Iceland, Tectonophysics, 674, 101–113, https://doi.org/10.1016/j.tecto.2016.02.008, 2016.
Zoback, M. D., Moos, D., Mastin, L., and Anderson, R. N.: Well bore breakouts and in situ stress, J. Geophys. Res.-Sol. Ea., 90, 5523–5530, https://doi.org/10.1029/JB090iB07p05523, 1985.


