 | 25 Feb 2022
From glacial erosion to basin overfill: a 240 m-thick overdeepening–fill sequence in Bern, Switzerland
Michael A. Schwenk
Patrick Schläfli
Dimitri Bandou
Natacha Gribenski
Guilhem A. Douillet
Fritz Schlunegger
We drilled a 210 m-thick succession of Quaternary sediments and extended it 30 m upsection with information that we collected from an adjacent outcrop. In the 240 m-thick succession we identified 12 different lithofacies, grouped them into five facies assemblages, and distinguished two major sedimentary sequences. A sharp contact at 103 m depth cuts off cross-beds in sequence A and separates them from the overlying horizontal beds in sequence B. Although the lowermost facies assemblage of each sequence includes a till deposited during a period of ice cover, the two tills differ from each other. In particular, the till at the base of sequence A is dominated by large clasts derived from the underlying Molasse bedrock, whereas the till at the base of sequence B has no such Molasse components. Furthermore, the till in sequence A bears evidence of glaciotectonic deformation. Both tills are overlain by thick assemblages of subaqueous, most likely glaciolacustrine and lacustrine facies elements. The cross-bedded and steeply inclined sand, gravel, and diamictic beds of sequence A are interpreted as deposits of density currents in a subaqueous ice-contact fan system within a proglacial lake. In contrast, the lacustrine sediments in sequence B are considered to record a less energetic environment where the material was most likely deposited in a prodelta setting that gradually developed into a delta plain. Towards the top, sequence B evolves into a fluvial system recorded in sequence C, when large sediment fluxes of a possibly advancing glacier resulted in a widespread cover of the region by a thick gravel unit. Feldspar luminescence dating on two samples from a sand layer at the top of sequence B provided uncorrected ages of 250.3 ± 80.2 and 251.3 ± 59.8 ka. The combination of these ages with lithostratigraphic correlations of sedimentary sequences encountered in neighboring scientific drillings suggests that sequence B was deposited between Marine Isotope Stage 8 (MIS 8; 300–243 ka) and MIS 7 (243–191 ka). This depositional age marks the end of one stage of overdeepening–fill in the perialpine Aare Valley near Bern.
- Article
(18465 KB) - Full-text XML
- BibTeX
- EndNote


Periods of global cooling have caused fluctuations in ice volume throughout the Quaternary, which is, for example, recorded in marine sediments (Lisiecki and Raymo, 2005). During these cool periods, ice sheets and glaciers have advanced from the polar areas to lower latitudes and from mountainous regions to the lowlands. The European Alps and their forelands were affected by these glaciations multiple times, as pointed out more than 100 years ago (Heim, 1885; Penck and Brückner, 1909). The most famous initial reconstruction of the number and chronology of glacial advances in the Alps by Penck and Brückner (1909) has evolved towards a detailed knowledge about the complexity of this chronology, yet these details have still been a matter of scientific debate in the past years (e.g., Fiebig and Preusser, 2008; Ehlers et al., 2018). This debate is further complicated by the fact that glacial advances from the Alps to their forelands were regionally variable through the course of the Quaternary. On the global scale, it was recognized that the periodicity of glacial cycles increased from 41 to 100 ka, probably due to an increased eccentricity forcing (e.g., Ruddiman et al., 1986; Lisiecki, 2010) during the Middle Pleistocene climatic Transition (MPT, 1250–700 ka; Clark et al., 2006). Studies of the topographic evolution in the Central Swiss Alps suggest that glacial valley erosion started to increase during the MPT (Haeuselmann et al., 2007b; Valla et al., 2011). It was also proposed that glacial overdeepening of valleys in the northern Alps and in their foreland was initiated during the MPT (Schlüchter, 2004). Overdeepenings are local bedrock troughs where the rock surface is below the present-day base level. These bedrock depressions thus provide accommodation space where fragmented and potentially intact glacial–interglacial sedimentary sequences could accumulate after glacial retreat. Hence, overdeepenings have the potential to preserve the sedimentary record throughout repeated glacial cycles (Preusser et al., 2010; Cook and Swift, 2012). Numerous extensive overdeepenings were formed in the Swiss Alps and on the Swiss Plateau (Fig. 1a, b), where a minimum of eight Quaternary glaciations has been recognized so far in the sedimentary record, including archives recovered from these overdeepenings (Keller and Krayss, 2010; Preusser et al., 2011). One of these large glacial troughs, which is referred to as the Aare Valley overdeepening, is situated in the greater Bern area between the Jura Mountains and the Aar Massif in the Central Alps (Fig. 1a, b; Reber and Schlunegger, 2016).
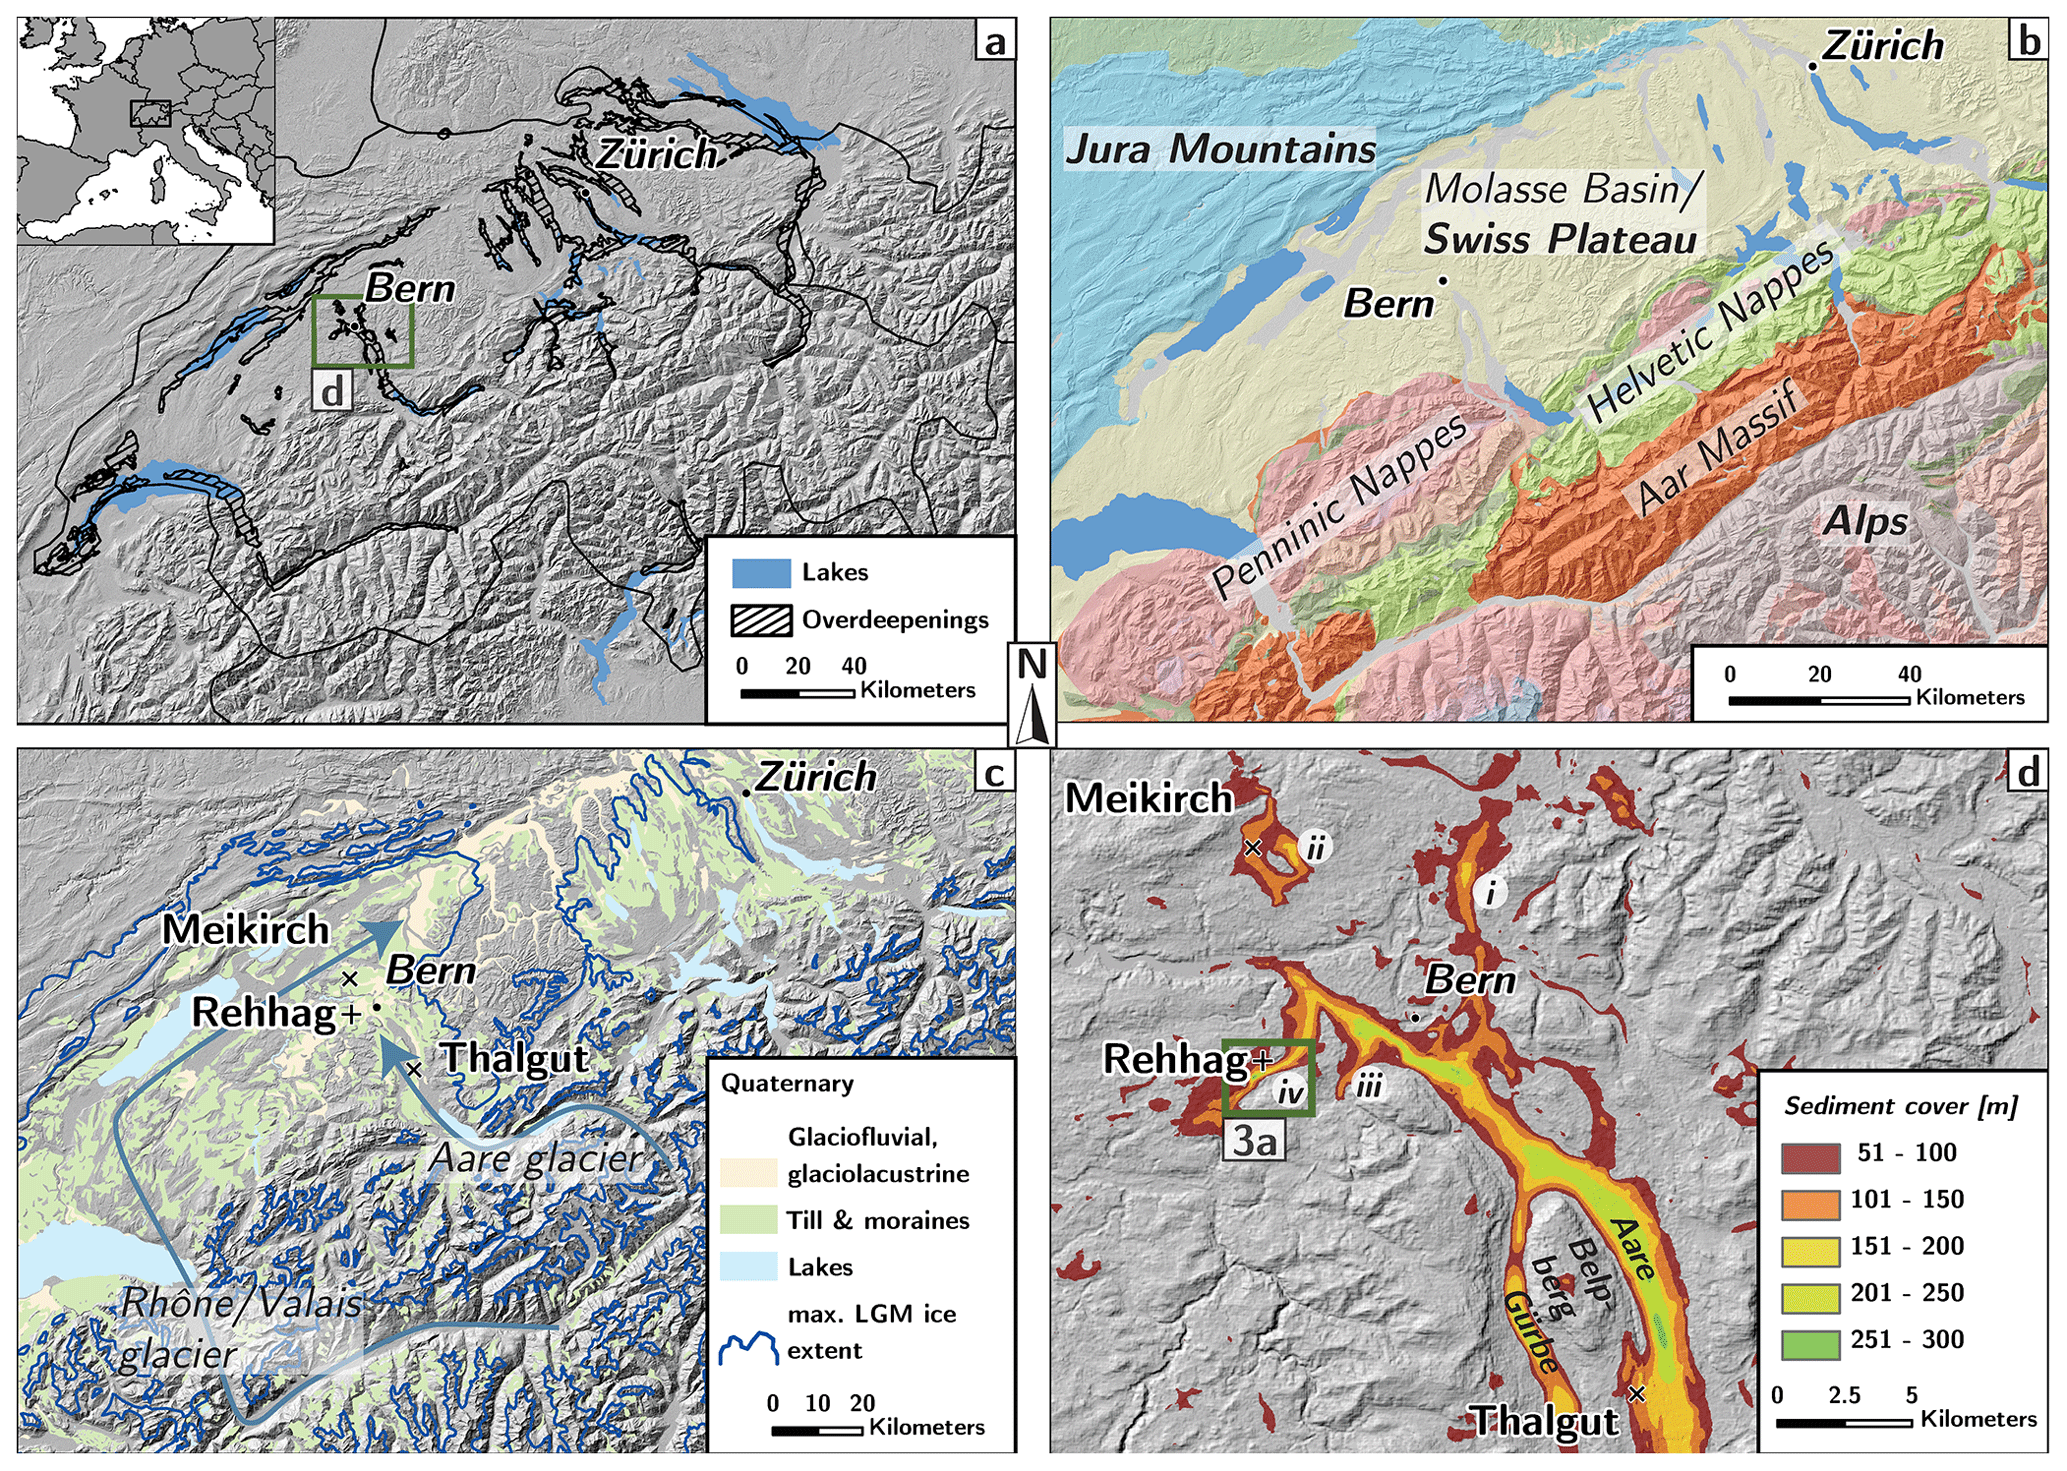
Figure 1(a) Distribution of overdeepenings in the Swiss Alps and Plateau. For data availability, see below. The green box outlines the extent of the study area as shown in (d). (b) Location map of the geographic (bold font) and geologic (normal font) settings in the vicinity of the study area. (c) Surface distribution of deposits from the last glaciation. The maximum extent of glaciers during the LGM is indicated along with the flow directions (green arrows) of the Rhône and Aare ice streams (modified from Ehlers et al., 2011). The locations of the Meikirch, Rehhag, and Thalgut drill sites are marked. (d) This map shows the varying thickness of the sediment fill in the MAV overdeepening as derived from the bedrock model (see below). The locations of the Meikirch, Rehhag, and Thalgut drill sites are marked. Numbers (i) to (iv) indicate branches of the MAV overdeepening as mentioned in the text (Sect. 2). These branches are (i) the N-directed continuation of the main overdeepening, which is ca. 8.5 km long, (ii) an isolated bedrock depression (Meikirch trough) located 2 km north of the distal termination of the main trough, (iii) a ca. 2 km-long SW-oriented branch situated about 1 km SW of Bern, and (iv) a ca. 6.5 km-long SW-directed branch, referred to as the Bümpliz trough. The green box shows the location of the map in Fig. 3, in which the local geology and morphology at the Rehhag site atop the Bümpliz trough (iv) are presented in more detail. All elevation data are based on ASTER (NASA/METI/AIST/Japan Spacesystems and U.S./Japan ASTER Science Team, 2019). The Reber and Schlunegger (2016) bedrock topography in (d) is part of the bedrock surface model for Switzerland in (a). The Swiss-wide model is a composite of various data sets (Jordan, 2010; Dürst Stucki et al., 2010; Dürst Stucki and Schlunegger, 2013; Reber and Schlunegger, 2016), and the model is available via the Federal Office of Topography (Swisstopo). A free-of-charge high-resolution reconstruction of the bedrock topography in the Canton of Bern (Reber and Schlunegger, 2016) with a 10 m resolution in elevation is available through the canton's geodatabase (http://www.geo.apps.be.ch/de, last access: 24 June 2021). The thickness of the Quaternary fill has been determined through the elevation difference between the modern topography and the bedrock surface (e.g., Dürst Stucki and Schlunegger, 2013).
Among the various glacial archives, surficial deposits of the Last Glacial Maximum (LGM, i.e., the state of local maximum ice extent; Ehlers et al., 2018), such as moraines, have been thoroughly investigated because of their easy accessibility. Hence, the LGM is probably the most investigated and best reconstructed glacial advance among the Quaternary glaciations in the Alps. Dating of Alpine LGM moraines suggests a correlation with the timing of the maximum global ice volume during Marine Isotope Stage 2 (MIS 2, 29–14 ka; e.g., Ivy-Ochs et al., 2008). On the Swiss Plateau and in the Jura Mountains, moraines and boulders, situated beyond the LGM ice extent, were tentatively assigned to the MIS 6 (191–130 ka), yet the scatter in the assigned ages is large (e.g., Bickel et al., 2015; Graf et al., 2015). An MIS 6 age has also been proposed for the basal sediments encountered in a drilling about 150 km northeast of Bern (site Niederweningen; Dehnert et al., 2010). The sedimentary record of the oldest glaciations in the Northern Alpine Foreland, which occurred during the Early Pleistocene (2.58–0.77 Ma), is preserved on top of local heights in the “Deckenschotter” deposits (Bolliger et al., 1996; Haeuselmann et al., 2007a; Akçar et al., 2017; Claude et al., 2019). However, results from a recent study that employed a probabilistic framework to interpret cosmogenic nuclide-based ages (Knudsen et al., 2020) contradict the biostratigraphic correlation with the Early Pleistocene (Bolliger et al., 1996). Apart from the Deckenschotter deposits, the majority of Mid-Pleistocene sediments is rather unlikely to be preserved at the surface and is therefore hardly accessible. Nevertheless, Mid-Pleistocene sedimentary sequences were encountered by drillings in overdeepenings at different locations across the Swiss Plateau, including the area investigated in the present study (e.g., Schlüchter, 1989; Preusser et al., 2005; Dehnert et al., 2010; Buechi et al., 2017). Although these drillings showed that the overdeepening fill mainly comprises fluvio-lacustrine sediments postdating the MPT, they currently present point information within a limited regional context. Accordingly, a tight network of drillings is required to fill the gaps in information and particularly to improve our understanding of the Quaternary history of the Alps (e.g., the “Drilling Overdeepened Alpine Valleys project”, Anselmetti et al., 2014).
Here, we conducted such a drilling in the confluence area of the Rhône and Aare glaciers (Fig. 1c) with an effort to reconstruct the sedimentary and landscape dynamics that can be expected in a glacial-to-glaciolacustrine setting (Buechi et al., 2017; Fabbri et al., 2018; Sutherland et al., 2019). We selected the Bern area for this drilling because the recently modeled bedrock topography implied a sediment thickness of 150 m (Fig. 1d; Reber and Schlunegger, 2016). Furthermore, previous drillings in the region (Sect. 3), mapping (Geologiebüro Kellerhals et al., 2000; Isler, 2005), and outcrops provide a stratigraphic frame, which allows us to place the point information of the drilling in a regional context.
The study area is located in the Middle Aare Valley (MAV) between the border of the Alps and the city of Bern (Fig. 1b, d). Glaciers originating in the Central Alps advanced into the MAV repeatedly during the Quaternary (e.g., Schlüchter, 1989; Preusser et al., 2005; Wüthrich et al., 2018). During the LGM the confluence of the more voluminous Valais/Rhône lobe and the Aare glacier was located at the downstream terminus of the MAV (Fig. 1c; Bini et al., 2009; Ehlers et al., 2011). Abundant traces of the LGM are present in the Bern area as terminal moraines, drumlins, till cover, and outwash plains (Fig. 1c). The Aare glacier retreated from the Bern area ca. 20 ka ago (Wüthrich et al., 2018). The region was ice free by 17 ka at the latest (Meichtry, 2016). In the 1980s, two scientific drillings were conducted to unravel the glaciation history of the region beyond the LGM cover (Meikirch and Thalgut, Fig. 1c, d). The cored material was analyzed for pollen biostratigraphy and luminescence dating (Welten, 1982, 1988; Schlüchter, 1989; Preusser and Schlüchter, 2004; Preusser et al., 2005). The results of the investigated drillings showed that the sediment infill of the overdeepened MAV is locally as old as MIS 11 (424–374 ka; Koutsodendris et al., 2012) or possibly even older (Sect. 3).
In the MAV, the bedrock consists of early Miocene fluvial sandstones and overbank fines, which are referred to as the Lower Freshwater Molasse (LFM; Platt and Keller, 1992). The bedrock surface model of the MAV (Reber and Schlunegger, 2016) shows the occurrence of an overdeepening beneath the current valley surface (Fig. 1d). According to estimations by Dürst Stucki and Schlunegger (2013), the Quaternary sediment infill in the MAV varies in thickness between 150 and 300 m, yet the thickness reaches local maxima with more than 500 m. The MAV main trough is divided into two branches (Aare and Gürbe) separated by a bedrock ridge (Belpberg, Fig. 1d). At its terminus, four lateral troughs depart from the main overdeepening (i–iv, Fig. 1d).
A first 160 m-deep drilling on the western flank of the Aare branch (Fig. 1d) did not reach the base of the Quaternary glacial fill (Fig. 2 left; Welten, 1982, 1988; Schlüchter, 1989; Preusser and Schlüchter, 2004). At the deepest level between 462 and 536 m a.s.l., this Thalgut drilling encountered pollen (Pterocarya and Fagus) embedded in lacustrine deposits. The pollen assemblage was correlated with the Holsteinian interglacial, the equivalent to MIS 11 (cf. de Beaulieu et al., 2001; Koutsodendris et al., 2012). Attempts to use luminescence dating on this part of the Thalgut section encountered saturated samples, which supports the assignment of a relatively old age through palynology (Lowick et al., 2012). The overlying unit up to 593 m a.s.l. consists of a 50 m-thick sequence of deltaic gravel foresets, 4 m of till, and 4 m of lacustrine deposits, which were interpreted as deposits of an advancing and retreating glacier (possibly during MIS 8, 300–243 ka). A hiatus is located at 593 m a.s.l. The section overlying this hiatus includes 15 m-thick glaciofluvial gravel foresets, which are overlain by 3 m-thick interglacial lacustrine deposits and 3 m-thick glaciofluvial gravel beds. Results of luminescence dating (Preusser and Schlüchter, 2004) and pollen analyses (Welten, 1982, 1988) allowed these authors to link the lacustrine sediments to the Eemian, which corresponds to MIS 5e (129–111 ka; e.g., Brauer et al., 2007). Paleosol formation at 614 m a.s.l. and below indicates a time span without sedimentation and thus points towards the occurrence of another hiatus. Preusser and Schlüchter (2004) linked this hiatus to an interstadial prior to the LGM. The uppermost 6 m-thick succession consists of glaciofluvial gravel beds and of an LGM till (MIS 2).
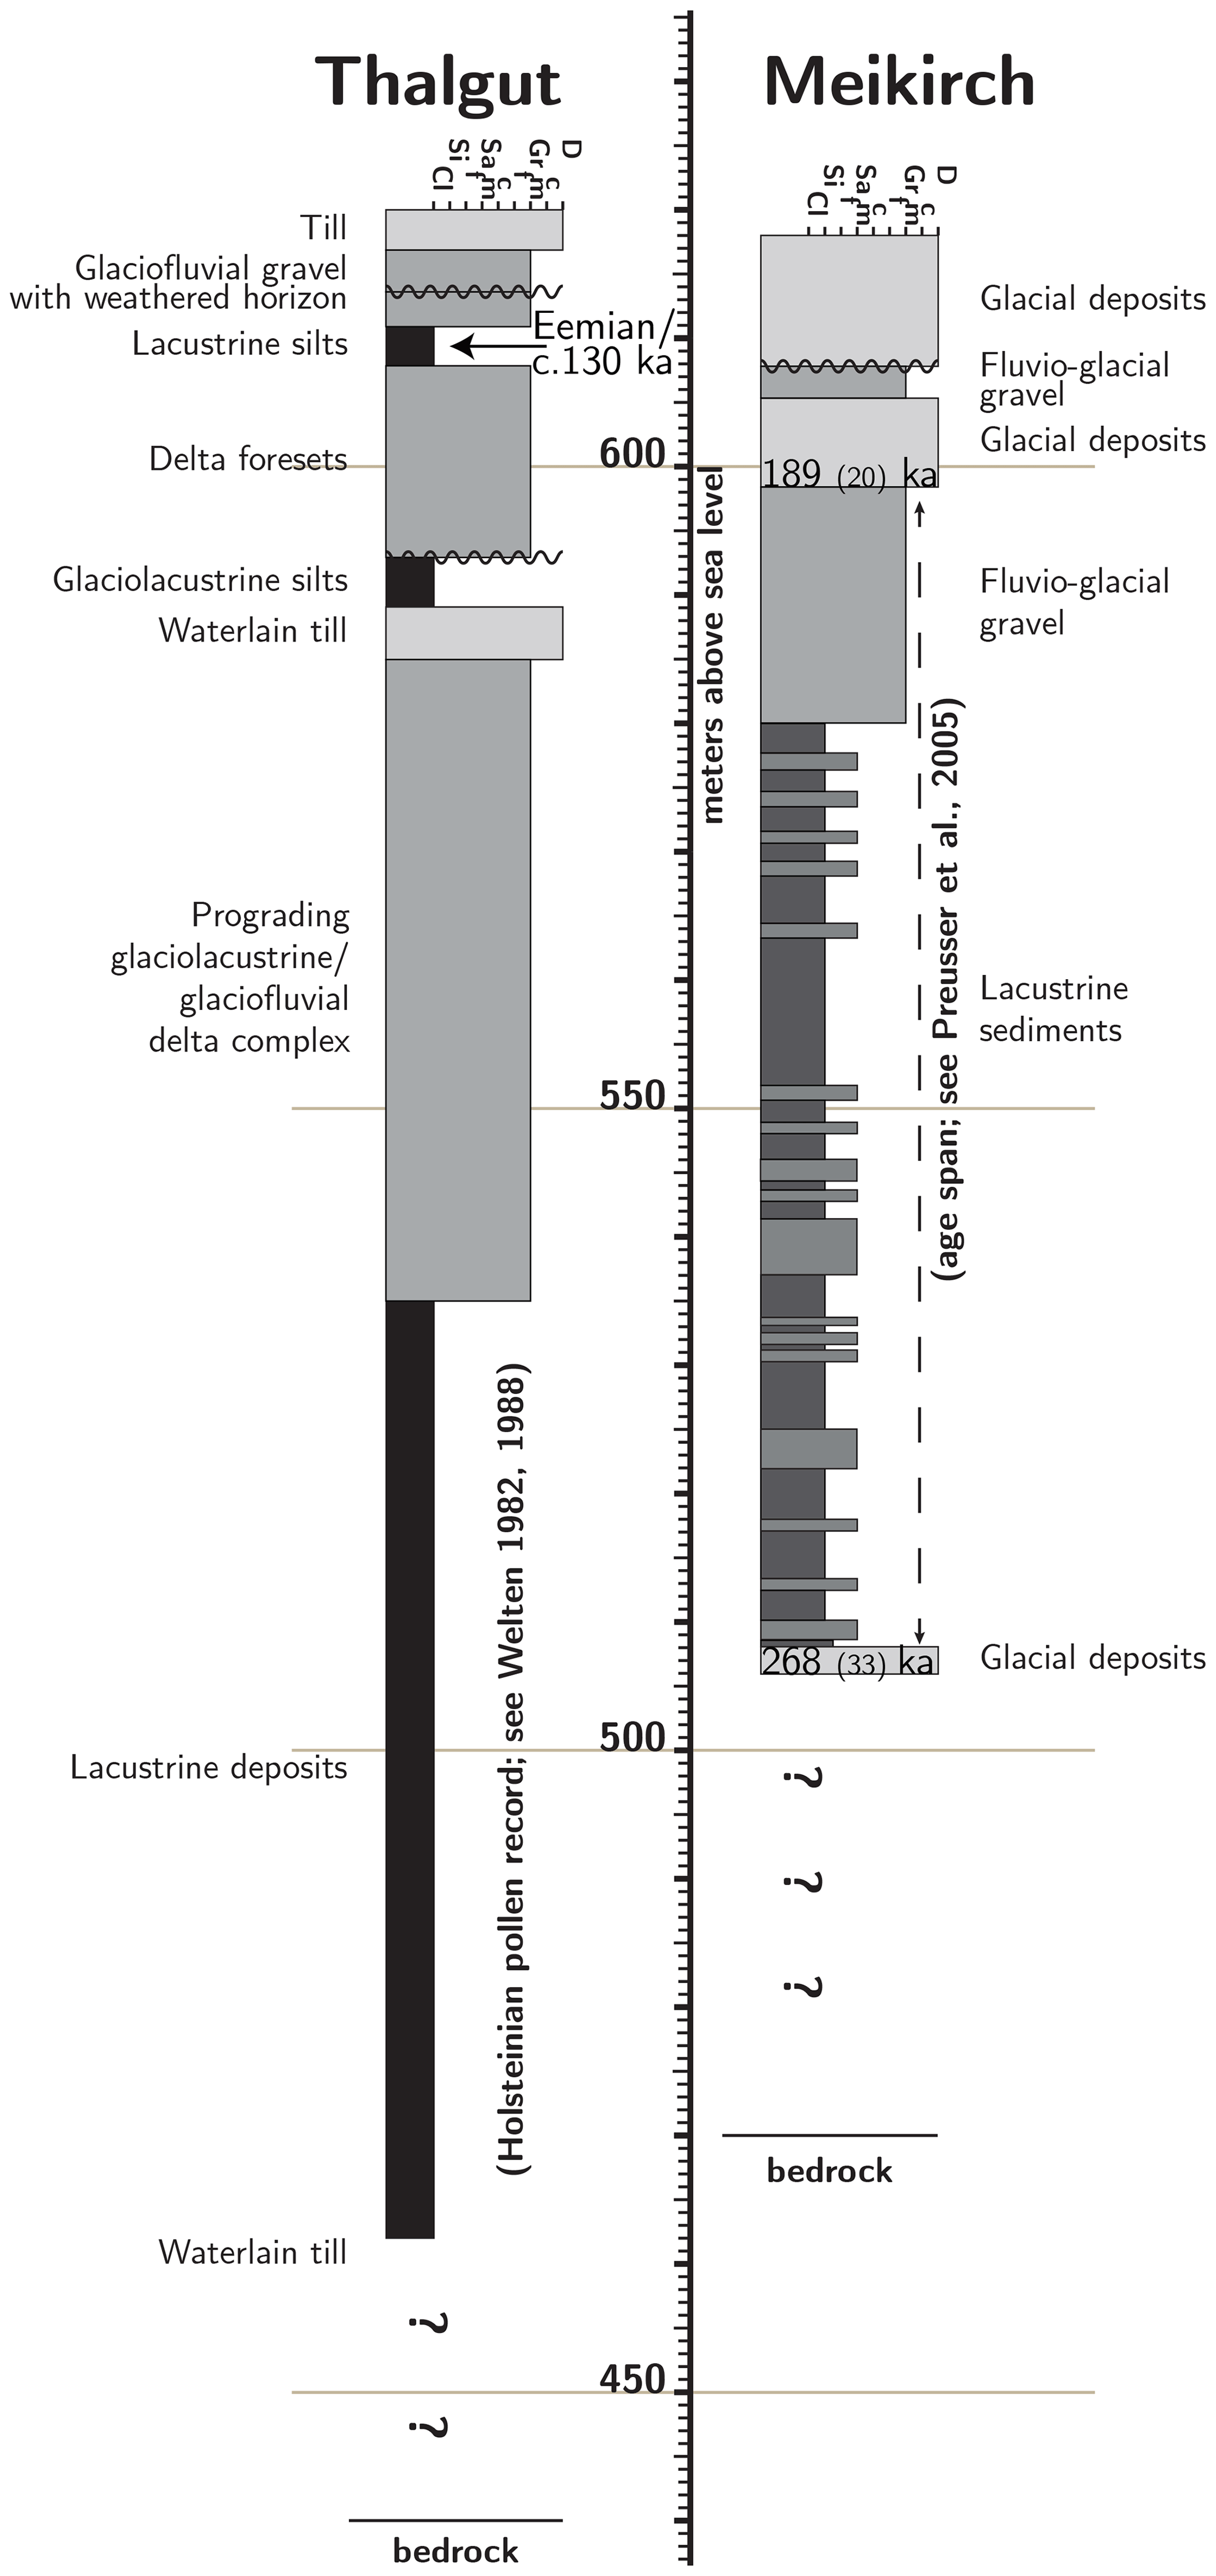
Figure 2Left: modified log of the Thalgut drill core (Welten, 1982, 1988; Schlüchter, 1989; Preusser and Schlüchter, 2004). Right: modified log of the Meikirch drill core (Welten, 1982, 1988; Preusser et al., 2005). The luminescence ages and respective errors (in brackets) of the uppermost and lowermost samples as determined by Preusser et al. (2005) are displayed in the log (508 and 600 m a.s.l.).
A second drilling conducted north of Bümpliz into the Meikirch trough (Fig. 1c) retrieved a continuous sedimentary succession that spans from 518 to 608 m a.s.l. (Fig. 2 right; Welten, 1982, 1988). The suite is characterized by lacustrine mud beds, containing three segments with different interglacial pollen assemblages. The sequence is topped by a 6 m-thick suite of glaciofluvial gravel. The 110 m-thick sequence is framed by two glacial tills at the base and at the top. Luminescence dating allowed Preusser et al. (2005) to link these sediments to two successive glaciations, which were interrupted by an interglacial period. The aforementioned authors considered the sediments to chronicle the time interval from MIS 8 through MIS 7 (243–191 ka) to MIS 6 (191–123 ka). A hiatus separates the succession described above from an LGM till (MIS 2) at the top.
The main goal of this study was to recover the record of at least one glacial–interglacial cycle, which should, preferably, include the Eemian (i.e., MIS 5e) or any older interglacial. We considered locations with inferred sediment thicknesses over 100 m to increase the probability of recovering one full glacial–interglacial cycle. Furthermore, the newly drilled section should potentially allow a correlation with the previously drilled MAV suites. Thus, we collected information from drilling reports and geological maps to assess the stratigraphic architecture of the MAV sedimentary fill. We targeted outcrops of Pleistocene lacustrine deposits during this reconnaissance, because they had the greatest potential to contain fine-grained sediments that could be enriched in pollen and were most likely formed within the desired age range. Using these constraints, we located the drilling above the Bümpliz trough (Fig. 1d, location iv; position CH1903+/LV95: 2595232, 1197952; WGS 84: 46.9326, 7.3760) near an abandoned clay pit, referred to as the Rehhag outcrop, which we trenched, sampled, and mapped in the field and acquired aerial images of (Fig. 3). This outcrop is located on the western flank of the Wangen Valley (Fig. 3a) and unveils a 35 m-thick (567–602 m a.s.l.) sedimentary succession of lacustrine deposits that underlie a thick glaciofluvial gravel unit (locally ca. 30 m; Fig. 3b; Isler, 2005). The outcrop exposes a shift from a lacustrine environment to a fluvial setting and was used to extend the sedimentary sequence recovered in the drilling. Additionally, two samples from a well-sorted sand unit within the succession were collected for optically stimulated luminescence dating (OSL; see below).

Figure 3(a) Detailed overview of the abandoned Rehhag clay pit with the OSL sample location and two trenches. At these three positions, the composition, texture, and fabric of the sediment were analyzed in more detail, as these are the sites that record the transition from a lacustrine to a fluvial environment. The displayed geological map resulted from our mapping in the clay pit. More detailed information is available in Sect. 4. The outcrop sequence overlaps with the sedimentary sequence recovered in the drilling at an elevation of 567 m. a.s.l. or 4 m core depth. The map inlet shows the entire Rehhag clay pit and the location of the drill site. Furthermore, the position of the cross section in (b) is indicated, along with the outline of the overdeepening and part of the adjacent Wangen Valley. (b) SW–NE-oriented cross section through the study site, showing the geological details at the Rehhag (2× exaggerated). The lacustrine sediments correspond to the top of sequence B, whereas the fluvial gravel beds correspond to sequence C in this paper (Forstschotter; Sect. 8.2). In the section, the LGM till is only a few meters thick. Note the 23∘ shift relative to the north. The elevation data in the main map were produced from a drone survey. Elevation data in the inlet map with 2 m resolution from © Swisstopo.
Drilling was conducted by Fretus AG between February and May 2019, using a Nordmeyer DSB 1/6 mobile rig to a total depth of 211.5 m. A total of 207 core sections, each 1 m long, and 9 sections, 0.5 m in length, were retrieved in plastic liners. A down-the-hole percussion coring tube was used up to a depth of 37 m, and it was replaced by a CSK-146 wireline diamond coring system for the remaining 171.5 m of unconsolidated sediment and 3 m of bedrock. The first 30 m were cased with 324 mm casing, followed by 6 m with a 280 mm casing, while the lower diamond coring section remained uncased. When the rod was removed to exchange the drill bit, the hole was stabilized by a drilling mud consisting of water with additions of biodegradable polymer and bentonite. Water inflow was recorded at depths of 3–4 and 8–9 m. Major drilling fluid losses occurred at a depth of 168–169 m. A core recovery rate of 92.3 % was achieved, 6.6 % of the core had lost all structures due to disturbance during drilling, and only 1.1 % of the core was physically lost.
After retrieval, the liners were capped, provisionally marked, and kept in wooden boxes with direction markers, name tags, and the respective driller depth to allow proper storage. The cores were weighed in as a first estimate of core recovery. Parallel to the drilling operations, cores were regularly transported to the Institute of Geological Sciences, University of Bern, for their investigation in the off-site core laboratory. The drill hole was cemented after the completion of the drilling operations, following official cantonal regulations. The core is stored in the Swisstopo core repository and is available for further investigation.
5.1 Core logging and sampling
We measured γ density, loop magnetic susceptibility, and P-wave velocity values at a 0.5 cm resolution (Schultheiss and Weaver, 1992) with a Multi Sensor Core Logger (MSCL; Geotek Ltd.) at the off-site core laboratory. Because the coupling between the P-wave instrument, the liner, and the core material could not be maintained, we did not consider these values for further investigations. The data set of the density and loop magnetic susceptibility, which consists of more than 42 000 readings per parameter, includes outliers that were measured at both ends of a liner. These were disregarded from the subsequent analysis. After logging with the MSCL, the liners were opened under light-sensitive conditions (i.e., in a dimmed room and under red light). One half of the core was packed and stored in two layers of lightproof tubular film to preserve the material for future extraction of luminescence samples.
After splitting, individual cores were logged (Sect. 5.2), and the material was scanned with a digital line scanner on the MSCL under stable lighting conditions to ensure consistent colors on the photos. We then measured the shear strength values particularly of fine-grained and silt-rich material with a vane meter (max. 250 kPa; Eijkelkamp, 2012) to complement the information yielded by the γ density analysis. However, the degree of consolidation was locally too high to allow penetration with the vane meter. As the last step, we collected samples for the determination of the pollen and carbon content (total carbon TC, total inorganic carbon TIC, and total organic carbon TOC).
5.2 Sediment description
The sediment was logged at the scale of individual beds in the direction of the drilling, i.e., downsection. The description followed a modified template of Krüger and Kjær (1999) for deposits in glacial environments. We then followed state-of-the-art approaches to characterize and interpret the sedimentological observations (e.g., Rose and Menzies, 2002; Buechi et al., 2017; Rosenblume and Powell, 2019; Sutherland et al., 2019). Accordingly, each sediment bed was first assigned to a lithofacies based on upper and lower bed contacts, the bed thickness, the grain size, the clast shape, and the sedimentary structures. This information built the basis for inferring a transport and deposition mechanism for individual lithofacies (Sect. 6.1 and Appendix A). As a final step, the encountered strata were grouped into different facies assemblages (FAs) based on their position within the cored sedimentary succession, their lithofacies, and distinct changes in the succession of lithofacies (Sect. 7). The lithofacies assemblages then built the basis for developing a scenario of how the sedimentary environment has evolved through time (Sect. 8.2).
5.3 Optically stimulated luminescence dating
Two samples (RE-01 and RE-03) from a well-sorted, 10 m-thick sand unit within the succession at the Rehhag outcrop were collected for feldspar luminescence dating (Fig. 3). We used 18 cm-long, 4.6 cm-wide, capped, and lightproof PVC tubes to collect the unconsolidated sand. Dose rate samples were scraped around the tubes into plastic bags prior to the extraction of the tubes. Feldspar infrared stimulated luminescence (IRSL) signals from multi-grain aliquots (1 mm) were measured at 50 and 225 ∘C with a Risø luminescence reader and a single-aliquot regenerative-dose (SAR; Murray and Wintle, 2000) post-IR IRSL protocol based on Buylaert et al. (2009). Further methodological details are described in Appendix B.
Luminescence measurements were analyzed with the R.Luminescence package (Kreutzer et al., 2012). In a first step, in addition to the standard quality criterion, the saturation of the apparent equivalent dose (De) per individual aliquot was tested (by the 2D0 rule: De > 2D0 saturation; Wintle and Murray, 2006). The sample equivalent dose (ED) was then calculated from the apparently unsaturated aliquot De data using the Central Age Model (CAM; Galbraith and Roberts, 2012). In a second step, a fading correction based on Kars et al. (2008) was individually applied to each unsaturated aliquot De, the results of which were then tested again for saturation and eventually used for the calculation of a fading-corrected age. The K, Th, and U contents were measured by high-resolution gamma spectrometry to determine the natural dose rate for each sample in order to calculate the sample ages. Further methodological details are available in Appendix B. The R script that was written for this analysis can be accessed at the drilling data repository (Schwenk et al., 2021).
5.4 Palynology
A total of 10 samples (2 cm3 each) were collected for a preliminary palynological analysis. The samples were taken from different fine-grained beds within the upper 72 m of the core to identify segments where pollen concentrations are suitable for a more extensive analysis. Before the chemical treatment, all samples were soaked in distilled water, and Lycopodium tablets were added (Stockmarr, 1971). The standard lab protocol was applied following Moore et al. (1991) using HCl, KOH, HF, and acetolysis. The hydrofluoric acid treatment was repeated due to the high content of lithogenic components in all samples. For pollen identification, a transmitted light microscope with different magnifications, palynological keys (Moore et al., 1991; Beug, 2004), the palynological atlas of Reille (1992), and the reference collection of the Institute of Plant Sciences, University of Bern, were used.
5.5 Organic and inorganic carbon
Throughout the core, 16 clayey silt layers and an additional 49 silt and sand layers were sampled for the determination of their carbon content. The TC, TIC, and TOC concentrations were measured with a Thermo Scientific Flash 2000 Smart (Thermo Fischer, Waltham, MA, USA). The CaCO3 content of the sediment can be determined under the assumption that the measured inorganic carbon was solely bound in carbonate minerals. The multiplication of the TIC by a stoichiometric factor of 8.33 results in the respective carbonate concentration.
6.1 Sediment inventory
6.1.1 Bedrock
The Rehhag drilling recovered a total of 211.5 m of core material (Fig. 4). In the lowermost 3 m the drilled section consists of red, yellow, and predominantly green-gray fine-grained sandstone beds that are interbedded with thin and light-colored siltstone, which displays abundant mottling. Given the high grade of consolidation, reddish color, mottling, and fabric of the sediments, these sandstones are attributed to the Lower Freshwater Molasse Group (LFM; Platt and Keller, 1992) and are considered to represent the bedrock at the base of the overdeepening. The overlying Quaternary sediments follow upon a sharp contact with the Molasse bedrock. Accordingly, we place the top of the bedrock at an elevation of 362.5 m a.s.l.
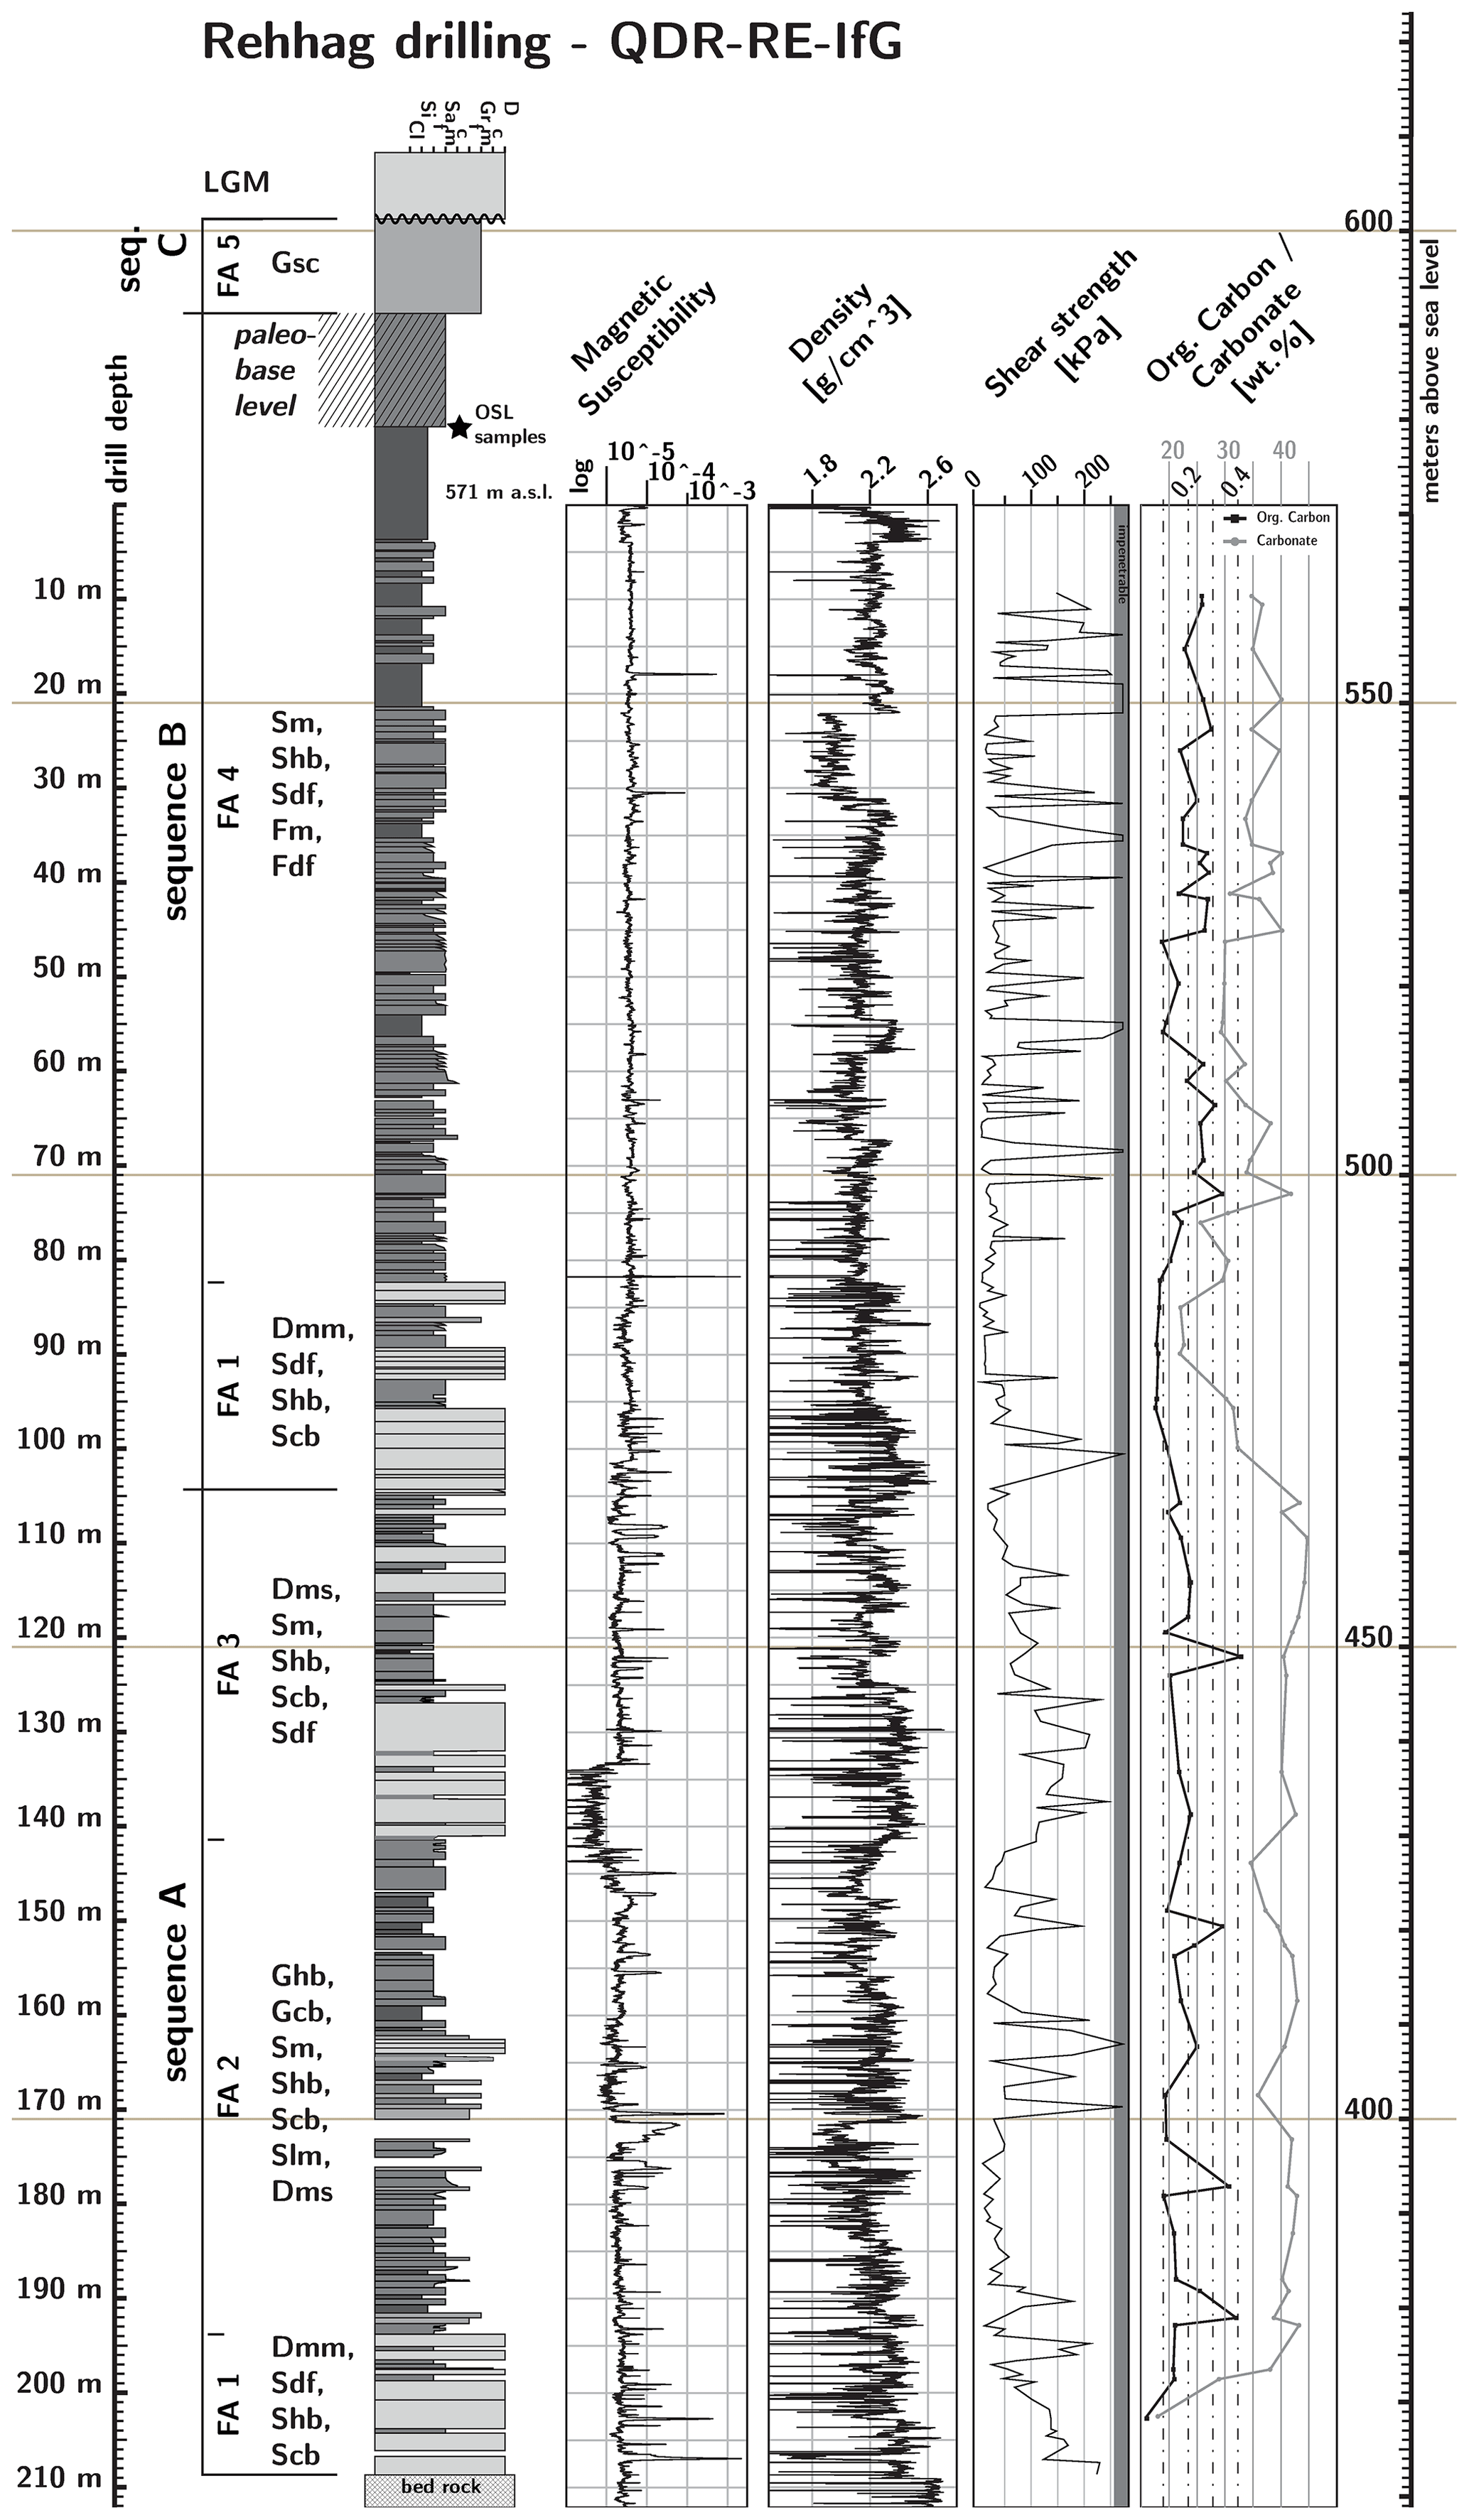
Figure 4Drill log of the presented Rehhag drilling and the sequentially overlying outcrop in the Rehhag clay pit. Blank spaces in the log show considerable core loss. The depth from the top of the drilling is shown on the left-hand side and absolute elevation on the right-hand side of the figure. The figure also displays the logging results of the magnetic susceptibility, γ density, shear strength, TOC and CaCO3 concentration measurements. The left-hand side of the log illustrates the distribution of lithofacies assemblage, and the respective lithofacies are noted. The sedimentary succession can be divided into two major sequences that were each initiated by a glacial advance. The basal till in each sequence is overlain by a thick assemblage of lacustrine deposits. The lower sequence A was formed in an ice-contact fan environment of a proglacial lake. The upper sequence B was formed from turbid underflows in a proglacial lake or deposited by turbid underflows in a lacustrine prodelta environment. The entire sequence is overlain by fluvial braidplain deposits, which can be considered a third sequence C, as this unit potentially transitions to another glacial period. An LGM till (Holocene) unconformably overlies the considerably older, Pleistocene sequence.
6.1.2 Lithofacies of the Quaternary suite
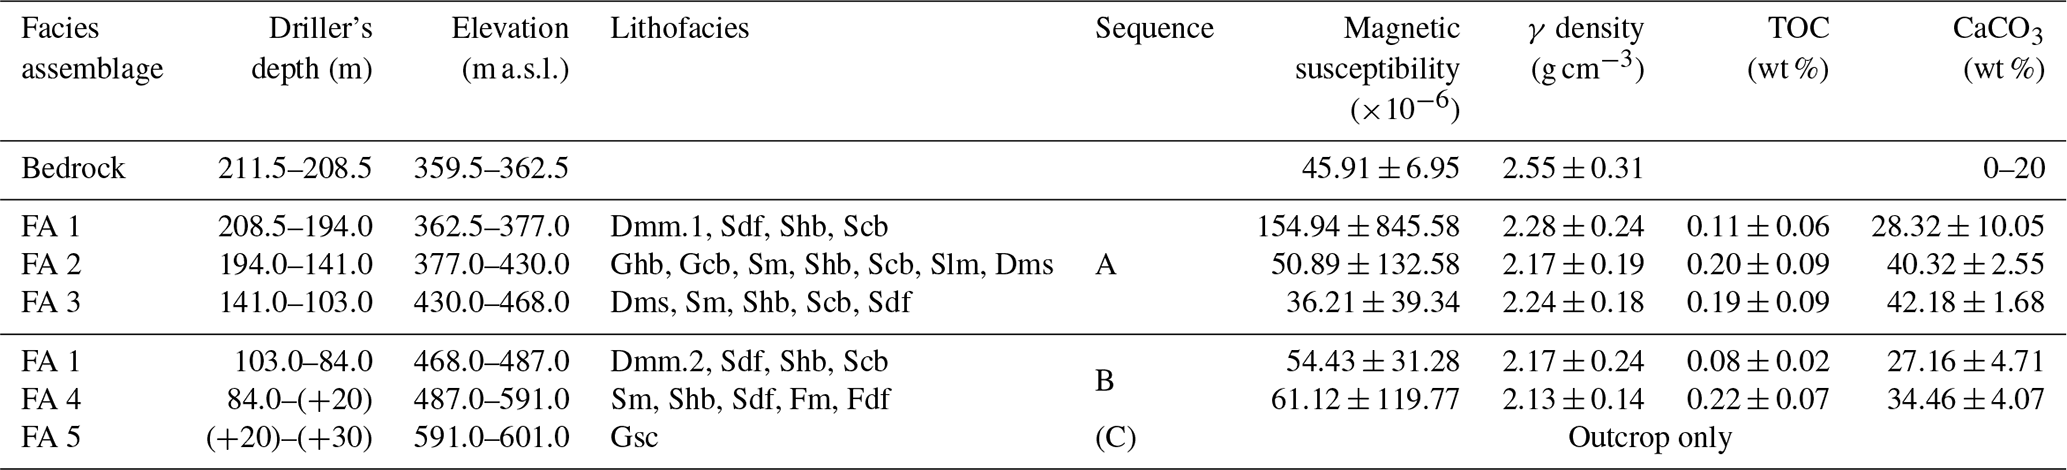
The overlying 208.5 m-thick Quaternary suite (Fig. 4) and the sediments exposed in the Rehhag clay pit (Fig. 3a, b) were categorized into 12 lithofacies (lfs; Fig. 4). Please refer to Table 1 and to Appendix A for a full description of the lithofacies and to Fig. 5 for illustrations of specific sedimentary features. In general, the Quaternary succession is dominated by well-sorted sand beds or characterized by units with a sandy component. Fine-grained sediments such as clayey silt beds also contribute to the succession but are less frequently observed than the sandy layers. Coarse-grained material such as pebble and gravel beds (and larger grain sizes), however, is less frequent but dominates the lithofacies on top of the cored suite (i.e., Forstschotter, Sect. 4). Generally, a good to moderate degree of sorting is present in lfs 1 to 10. The stratified diamicts of lithofacies 11 (Dms) and the massive diamicts of lithofacies 12 (Dmm) deviate from this picture as the material is poorly sorted (Dms and Dmm) and lacks a sedimentary organization of the material (Dmm). Interestingly, Dmm deposits are encountered in two depth intervals between 83 and 103 m and at the base of the drilled Quaternary suite between 194 and 208.5 m depth (Fig. 4). Accordingly, we used these diamicts to subdivide the Quaternary succession into a lower sequence A (between 208.5 and 103 m depth) and an upper sequence B (uppermost 103 m) where each sequence starts with a > 10 m-thick succession including massive diamicts. In this context, the massive diamicts are referred to as Dmm.1 or Dmm.2 if they occur at the base of sequence A or sequence B, respectively.
Table 1This is a summary of the 12 lithofacies elements identified in the drill core, their main properties, and interpretation. Detailed descriptions can be found in Appendix A. Illustrative core photos are displayed in Fig. 5.
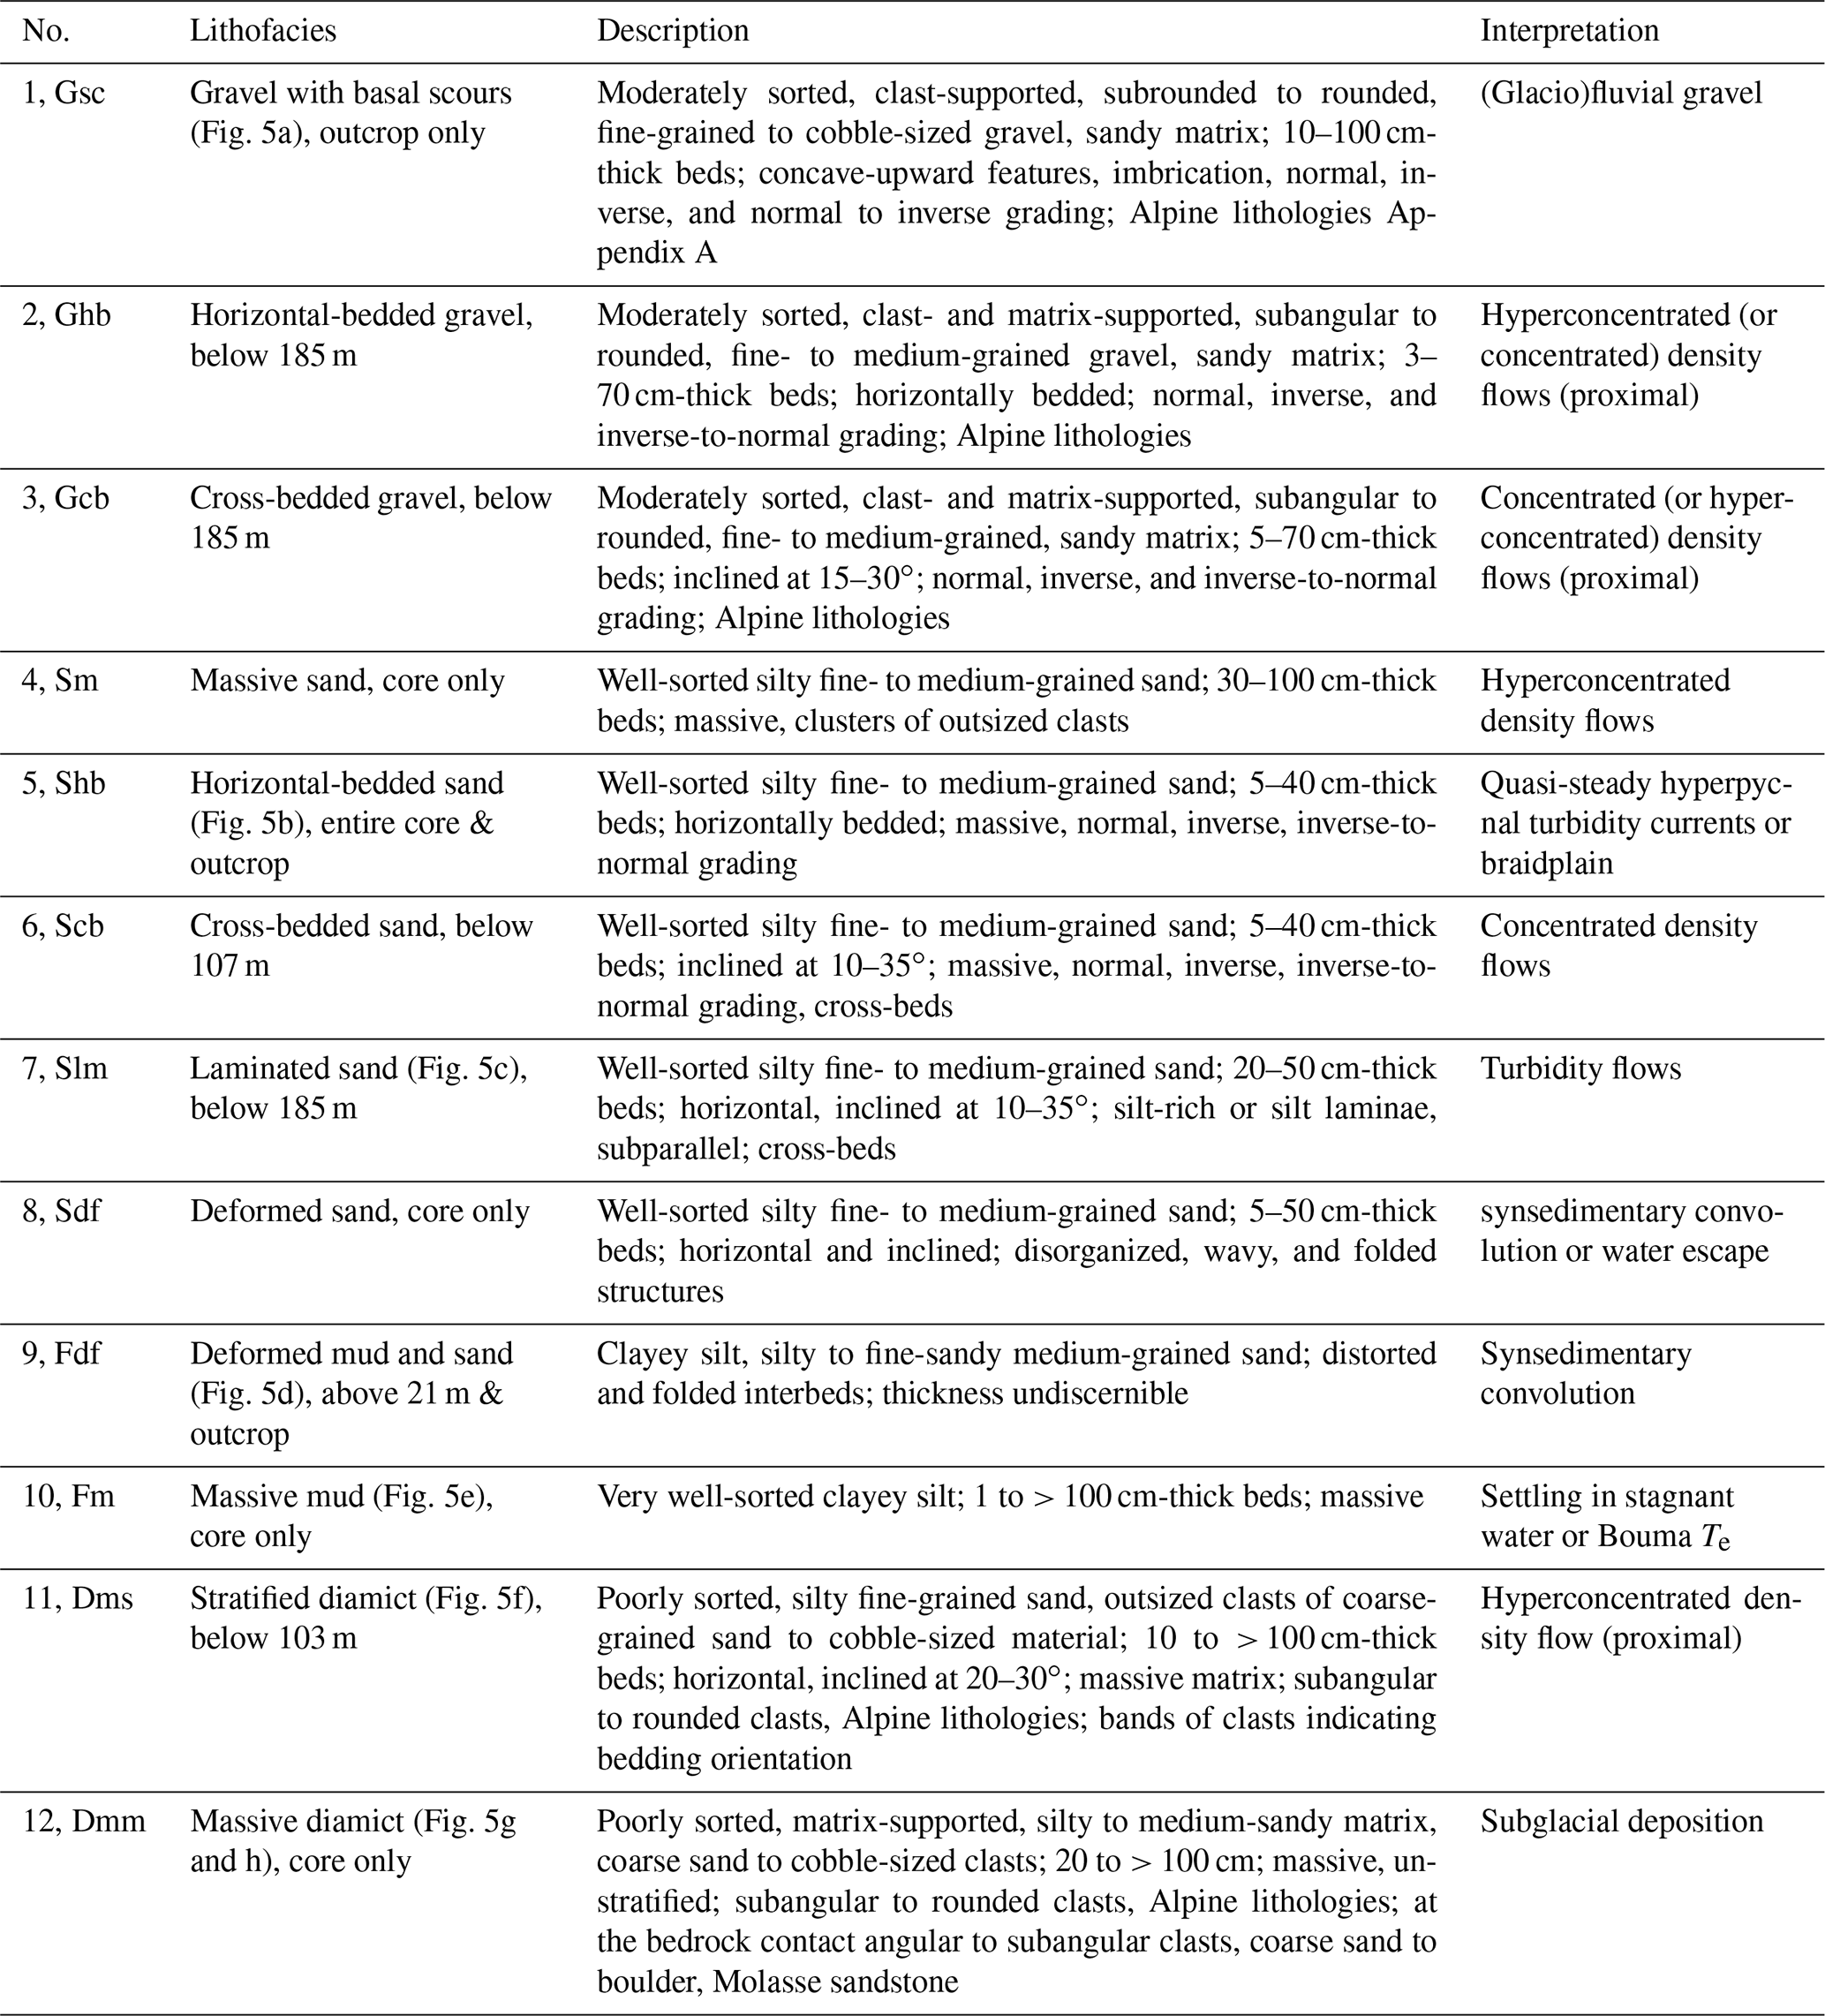
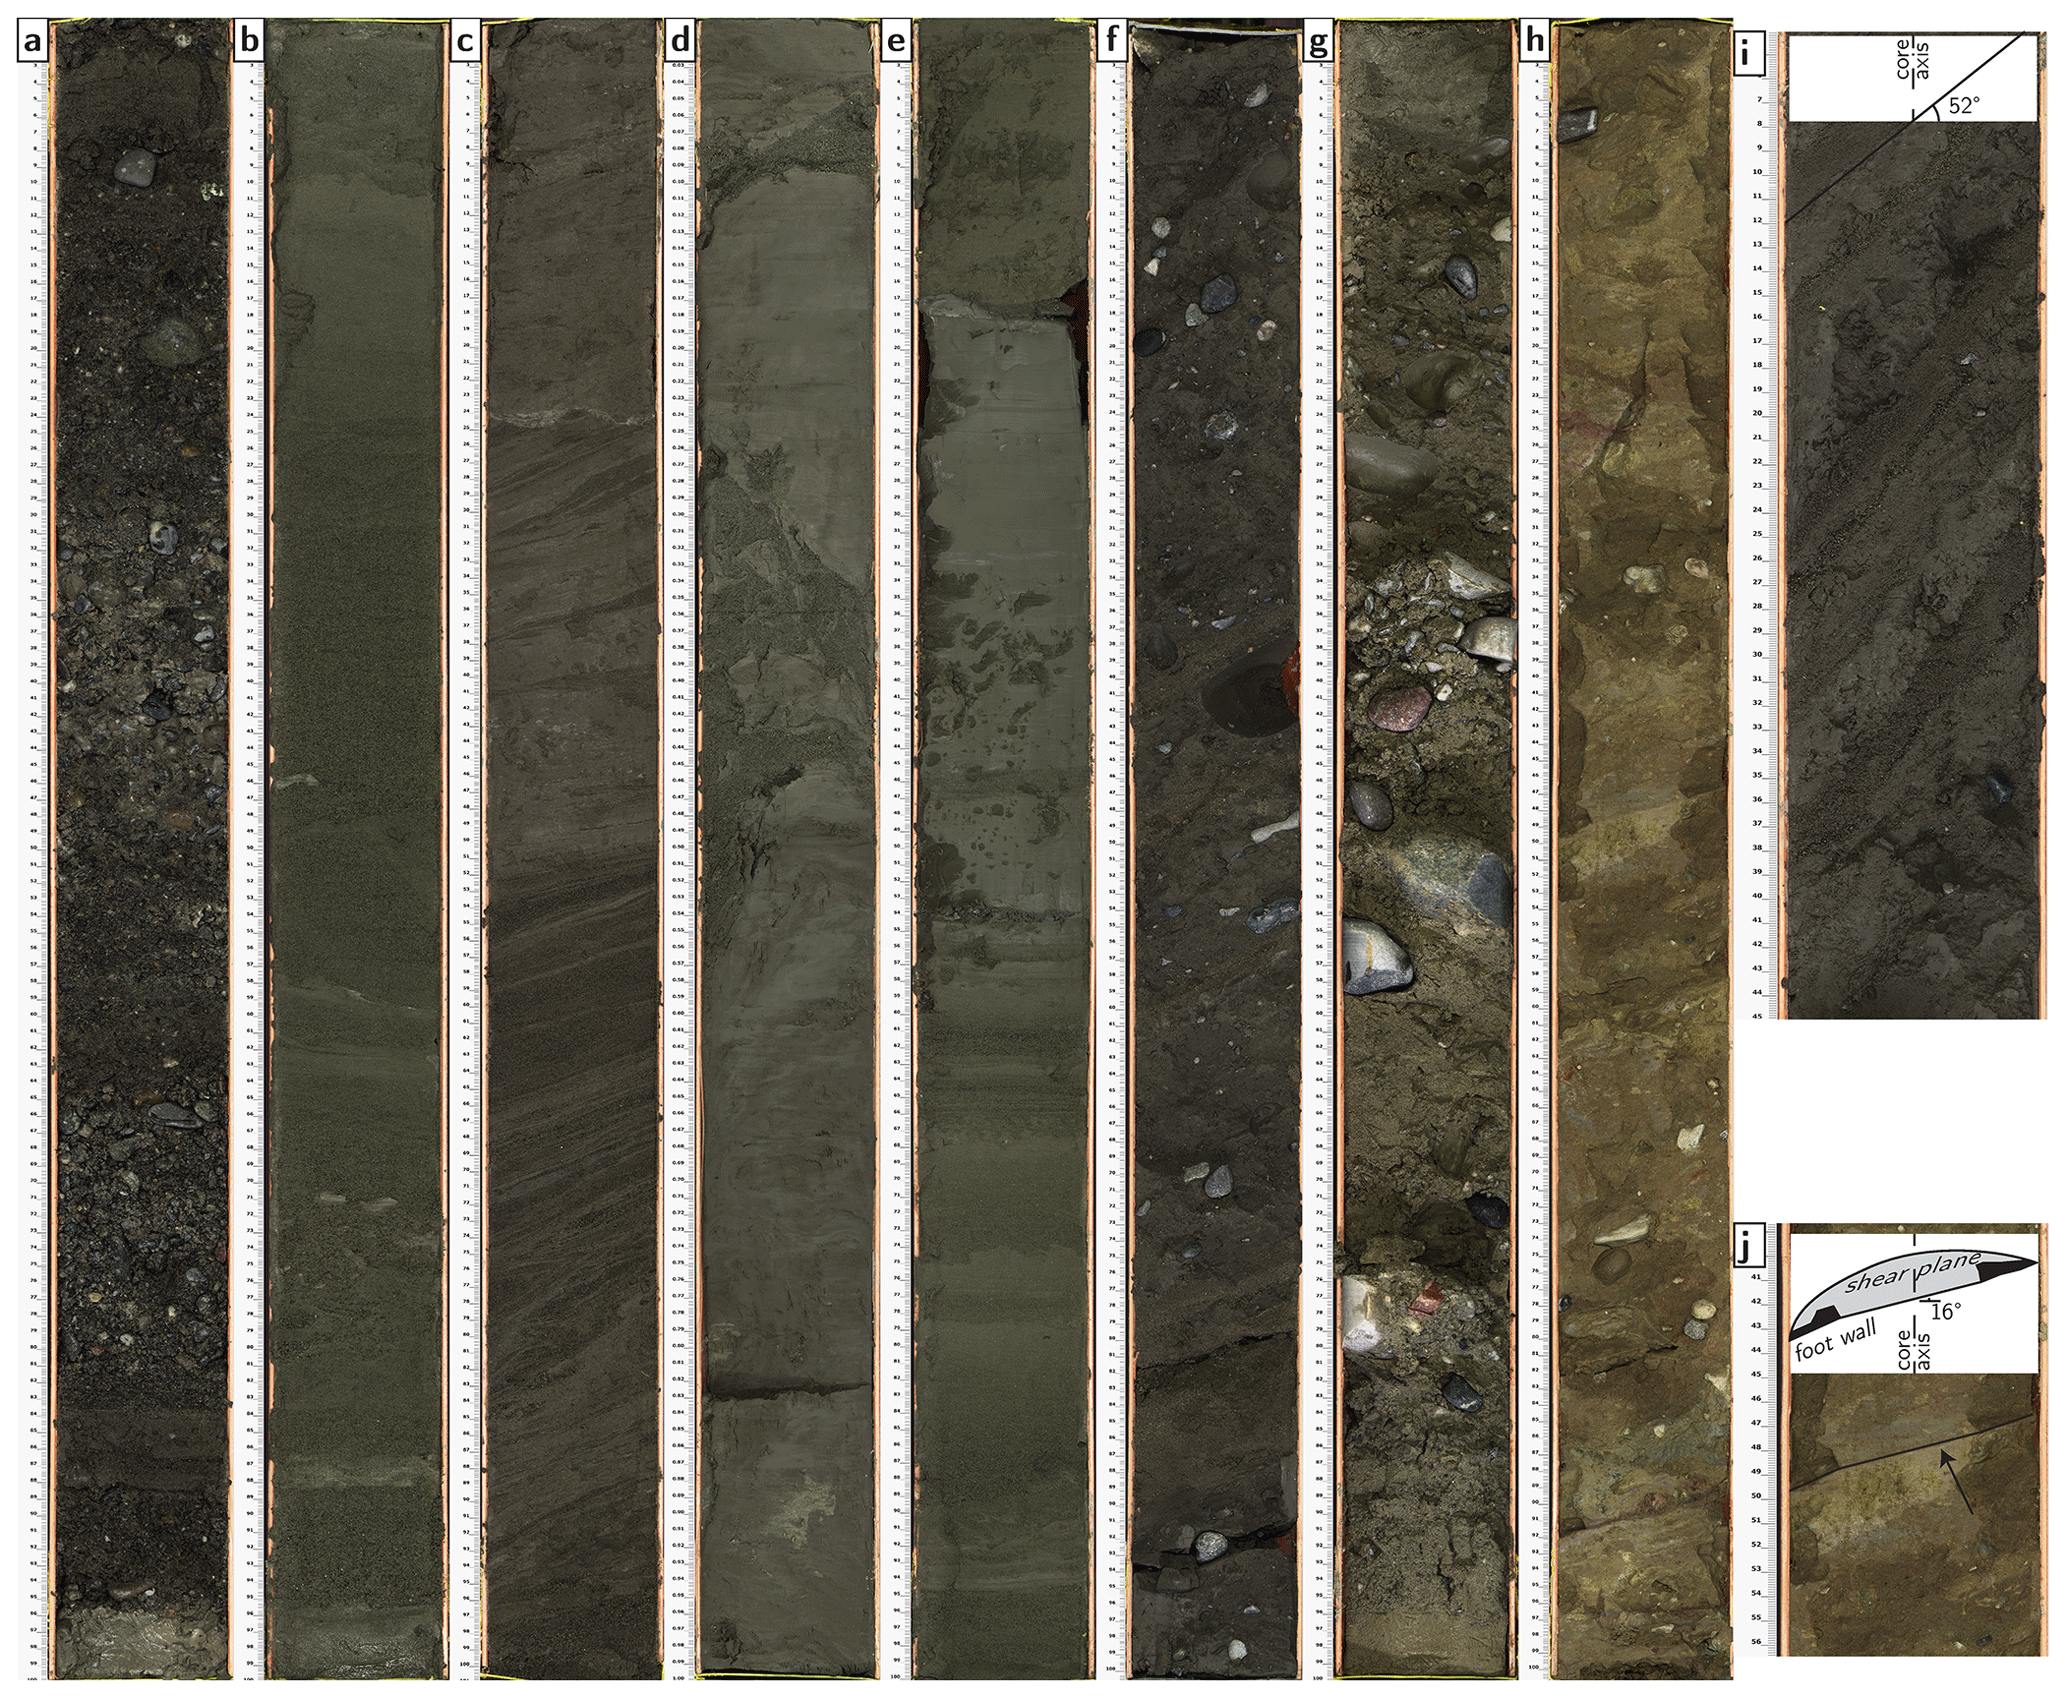
Figure 5Photos of eight illustrative core sections. For lithofacies descriptions, see Appendix A and Table 1. (a) Ghb, QDR-RE-IfG 175, 170–171 m: clast-supported, fine- to medium-grained gravel beds with a sandy and silty matrix and sand interbeds. (b) Shb, QDR-RE-IfG 063, 59–60 m: sandy deposits with a distinct normal grading between 10 and 57 cm. (c) Slm, QDR-RE-IfG 187, 182–183 m: cross-bedded, laminated sand beds. (d) Fdf, QDR-RE-IfG 011, 10–11 m: fine-grained sediments showing deformation, most probably due to slumping. (e) Fm, QDR-RE-IfG 043, 39–40 m: thick clayey silt layer with a gradual contact atop a normally graded sand. The upper contact is sharp. (f) Dms, QDR-RE-IfG 144, 139–140 m: mud beds with outsized clasts showing an inclined bedding and arrays of clasts where the a–b planes are aligned parallel to the bedding. (g) Dmm.2, QDR-RE-IfG 106, 101–102 m: upper till void of sedimentary structures. (h) Dmm.1, QDR-RE-IfG 212, 207–208 m: lower till showing colored clay bands hosting glaciotectonic shear planes at 49, 60, 81, 90, and 97 cm. Note the probably rotated clast at 90 cm depth. (i) QDR-RE-IfG 115, 108–109 m: example of oversteepened beds. The apparent dip is ca. 52∘. (j) QDR-RE-IfG 212, 207–208 m: example of a shear plane (arrow) in Dmm.1. The inset shows the apparent dip of the plane and a projection of the plane into the cored material based on the prepared foot wall surface (black polygons).
6.1.3 Oversteepened beds, strike-slip faults, and subhorizontal shear planes
Contacts with a dip angle > 40∘ are present in the core sections at 108–109 m and 119–120 m depths and occur within successions of beds with variable grain sizes in the range of sand and variable admixture of a silty component (e.g., Fig. 5i). The encountered dipping angles are steeper than can be expected from silt and sand deposits (e.g., Beakawi Al-Hashemi and Baghabra Al-Amoudi, 2018). Hence, we consider these beds to be evidence for localized oversteepening, which occurred after the deposition of the material.
A staircase structure cuts across the contact between a medium-grained sand and a silty fine-grained sand in the center (46 cm section depth) of the core section 124–125 m. This staircase consists of three steps that have relative vertical displacements of 4 and 1.5 cm from the lower left-hand to upper right-hand sides of the core, respectively. Upsection of the staircase, beds appear to be displaced along two subvertical, undulating lines that separate the three steps. Downsection of the staircase, the displacement becomes less visible, and it dissipates into small-scale ruptures and irregularities from 55 cm and below. We consider these steps to result from a displacement of the material along a set of two subvertical shear planes (i.e., faults). Because the fault traces dissipate downsection of the staircase, we interpret this structure as resulting from strike-slip rather than normal faulting.
A third feature was found in the lowermost 3.5 m (205–208.5 m) above the bedrock contact within diamictic beds of Dmm.1 (Fig. 4). The corresponding beds contain subhorizontal clay bands up to 5 cm thick, which are, on a smaller scale, composed of thinner wavy sub-bands with a large variety of colors, including green, yellow, brown, and red. Each of the larger bands includes a singular, dark straight line, which upon core opening shows a plane that reflects the light similar to slickensides (Fig. 5j). One such band (Fig. 5h) hosts a dark red and trapezoid clast, where the band material is wrapped around the particle and forms a blanket that tapers off on both sides of the clast. These structures share similarities to shear planes that can be formed by the glaciotectonic brittle deformation of a till (e.g., van der Wateren, 2002; Phillips, 2018). Probably, the clay bands atop or on both sides of these shear planes represent a fault gouge. In this context, the trapezoid clast described above could resemble an augen-like rotational clast right above such a shear plane.
6.2 Shear strength and γ density
The mean density within the bedrock section of the core is as high as 2.55 g cm−3 and then decreases distinctly at the transition from the Lower Freshwater Molasse bedrock into the unconsolidated Quaternary sediment at 208.5 m depth (Table 2 and Fig. 4). Within the entire sediment infill, the mean density is slightly increased in the assemblages which contain the Dmm (2.28 ± 0.24 and 2.17 ± 0.24 g cm−3) and Dms (2.24 ± 0.18 g cm−3) lithofacies. The assemblages that mainly consist of sand show reduced density values (2.17 ± 0.19 and 2.13 ± 0.14 g cm−3). Overall, the density of the lower sequence A is notably higher than that of the overlying sequence B. The highest density values in the sedimentary suite are well aligned with peaks in the shear strength data. The highest shear strength values are measured for cohesive sediments, i.e., silt or silty beds, whereas sand beds show the lowest shear strengths throughout the entire core.
Table 2This is a summary of the identified lithofacies assemblages, their extent from the top of the drilling, their extent in absolute elevation (surface 571 m a.s.l.), and the different lithofacies they comprise. The table also shows how the facies assemblages are grouped into the major sequences. Along with the assemblages, the mean values of the measured γ density, TOC content, and CaCO3 concentration are presented. The CaCO3 concentration of the bedrock is based on Blaser et al. (1994).
6.3 Magnetic susceptibility
After the rejection of outliers, the magnetic susceptibility (MS) data show two distinct patterns along the core (Fig. 4). A higher MS amplitude is measured in the lower half of the core up to a depth of 85 m, where the signal is attenuated. The signal then remains at lower levels upsection. The mean MS values in sequences A (59.90 ± 330.83 × 10⁻⁶) and B (59.56 ± 105.97 × 10⁻⁶) are closely aligned despite the different scatter of the data.
Generally, MS peaks are caused by fine-grained sediment particles or gravel clasts with an iron component. Highest MS peaks can be caused by metallic particles chipped off the drill head and rod. Furthermore, data peaks are encountered in core sections that were disturbed by the drilling (e.g., meters 171–173).
6.4 Optically stimulated luminescence measurements
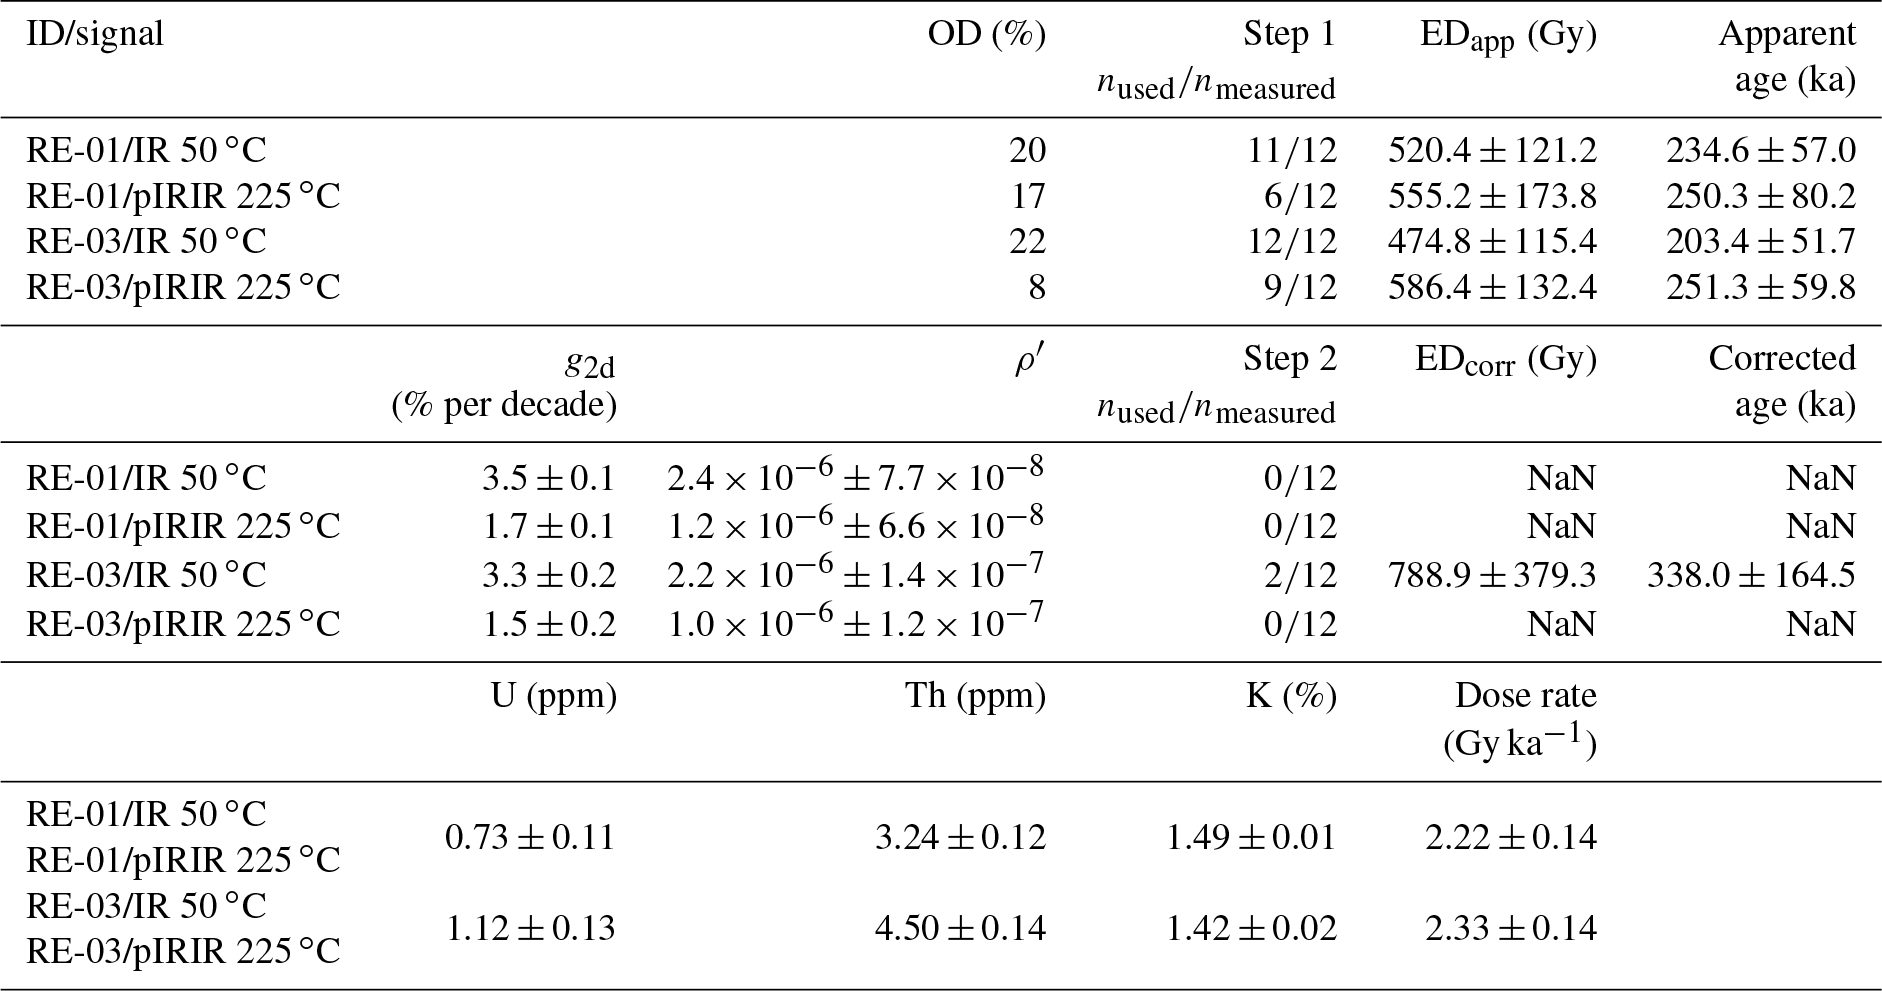
Following the first step of the R routine, which was applied to the IRSL measurements of samples RE-01 and RE-03, the De of all aliquots but one were kept for the IR50 signal, while half and one-third of the De of the aliquots were dismissed for the pIRIR225 signal due to clear saturation (De > 2D0; Table 3). Apparent sample EDs of 520.4 ± 121.2 and 474.8 ± 115.4 Gy for the IR50 signal and of 555.2 ± 173.8 and 586.4 ± 132.4 Gy for the pIRIR225 signal were calculated for RE-01 and RE-03, respectively, which are equivalent to ages of 234.6 ± 57.0 ka/203.4 ± 51.7 ka (IR50) and 250.3 ± 80.2 ka/251.3 ± 59.8 ka (pIRIR225). After fading correction and further evaluation of possibly saturated aliquots, an ED of 788.9 ± 379.3 Gy was derived (from CAM) for sample RE-03 for the IR50 signal, which yielded a fading-corrected age of 338.0 ± 164.5 ka. No fading-corrected ages could be calculated for the pIRIR225 and for the sample RE-01 (either signal) as all aliquots clearly indicated saturation after fading correction. All results from luminescence and related measurements are presented in Table 3.
Table 3Details of the IR50 and pIRIR225 luminescence analyses of samples RE-01 and RE-03, including the details of the first step analysis of the apparent (i.e., uncorrected) De, the details of the second step analysis for fading correction (Kars et al., 2008), and inputs for the calculation of the natural dose with DRAC (Durcan et al., 2015). The table has “NaN” (not a numeric) entries where age calculations were attempted but failed due to the elimination of saturated aliquots.
6.5 Palynology and carbon content
Despite the additional hydrofluoric acid treatment, the concentrations of fine-grained lithogenic components in the pollen samples were still remarkably high. Pollen concentrations were extremely low in all samples. In fact, pollen was found in only 4 of the 10 samples, and never more than three grains were encountered. Four grains could be identified as either Poaceae (39.24; 36.38; 20.89 m) or Rumex acetosa (35.11 m) type. All other grains (n=3) were either corroded or fragmented beyond determinability. Abundant Lycopodium spores were identified in all samples, ensuring that low pollen concentrations do not reflect a loss of pollen during chemical treatment.
The mean TOC throughout the core is 0.19 ± 0.08 wt %, and the mean TIC is 4.32 ± 0.73 wt %, or correspondingly, the mean calcium carbonate concentration is 36.02 ± 6.12 wt %. The mean TOC concentrations in sequences A and B are very similar and are at 0.19 ± 0.09 wt % and 0.19 ± 0.08 wt %, respectively. The lowest TOC concentrations were measured for the Dmm and the neighboring sediments (Dmm.1 0.11 ± 0.06 wt %, Dmm.2 0.08 ± 0.02 wt %; Fig. 4 and Table 2). The CaCO3 concentrations in sequence A are higher (39.72 ± 5.28 wt %) than in sequence B (33.04 ± 5.07 wt %). Most significant is the drop in the carbonate concentration around the two sections of the sequence that contain Dmm beds, where the mean concentrations are as low as 28.32 ± 10.05 (Dmm.1) and 27.16 ± 4.71 wt % (Dmm.2; Table 2). However, it has to be noted that the mean CaCO3 concentration around the Dmm.1 beds is based on the results of three readings only (17.98 wt % and 28.92 wt % for Dmm.1 beds and 38.06 wt % for a Scb bed). In total, seven TIC measurements were obtained around the beds of Dmm.2, where the corresponding carbonate concentrations range between 21.94 wt % and 32.27 wt %. Here, two measurements (87–88 m, 22.04 wt %; 103–104 m, 32.27 wt %) were obtained from Dmm.2 beds. The remaining five readings were obtained from sand beds, including the lowest value in the range (21.94 wt %).
The sorting, stratification, and fabric encountered in lithofacies 1 to 10 point towards a deposition mechanism with support by water (Sect. 6.1, Table 1 and Appendix A). Furthermore, the gray colors observed in lfs 2 to 10 are an indicator of the deposition in a non-oxidizing aquatic environment. After the carving or excavation of the investigated glacial overdeepening, the bedrock trough was most likely filled with water simultaneously to the glacial retreat and to the onset of the waterlain deposition, thereby forming a > 100 m-deep lake. Accordingly, lithofacies elements 2 through 10 were most likely formed in a lacustrine environment. The beds of lithofacies 1 were most probably deposited in a fluvial setting. However, the interpretation of the diamictic beds (Dmm, Dms) is equivocal as several transport mechanisms (such as cohesive debris flows, glacial processes, and flow of glacigenic material at the ice front) can be invoked to explain the related structures (see Appendix A).
7.1 Assignment of the Dmm lithofacies to a glacial till
We interpret Dmm as a subglacial till because the lowest CaCO3 concentrations encountered in Dmm.1 and Dmm.2 beds (Sect. 6.5 and Table 2) point to the admixture of Molasse bedrock material (carbonate content between 0 % and 20 %; Blaser et al., 1994) to material derived from more carbonate-rich sources (e.g., Helvetic and Penninic nappes). This admixture of Molasse material most likely occurred through in situ glacial carving, because the Dmm.1 directly overlies the bedrock and comprises angular and subangular Molasse blocks. In addition, the partial green, red, and yellow colors of the Dmm.1 matrix resemble the colors of the bedrock very well. Since the LFM units are poorly consolidated (Platt and Keller, 1992) and have one of the lowest erodibilites reported for the rocks in Switzerland (Kühni and Pfiffner, 2001), the presence of angular to subangular Molasse clasts points to a very short transport distance. Active erosion by subaqueous cohesive debris flows is unlikely (see Appendix A; Iverson, 1997; Mulder and Alexander, 2001). Therefore, we suggest that Dmm.1 was formed by subglacial processes and that the Molasse rafts could have been derived from in situ plucking and dragging of bedrock pieces by the glacier. At 103 m depth, Dmm.2 follows upon a sharp contact, where the underlying > 35 m-thick suite of cross-bedded lithofacies is abruptly cut off by this contact. We interpret the contact between the upper Dmm.2 beds and their substratum as an erosional contact and thus as a major unconformity. As subaqueous cohesive debris flows are unlikely to form such unconformities (see references above), we suggest that erosion probably occurred during a glacial advance. Accordingly, Dmm.2 above the unconformity rather corresponds to a till than to a debris flow deposit. The inferred occurrence of erosion is also supported by the low CaCO3 concentration (27.16 ± 4.71 wt %; see above), and a glacial mechanism is consistent with published interpretations on the origin of distinct glacigenic sedimentary layers within the MAV overdeepening during MIS 8 and probably even during MIS 10 (374–337 ka; Preusser and Schlüchter, 2004; Preusser et al., 2005, 2011).
7.2 Interpretation of oversteepeened beds, faults and shear planes as glaciotectonic features
If the interpretation of the Dmm as subglacial till is correct, then the oversteepened beds, strike-slip faulting, and subhorizontal shear planes described in Sect. 6.1.3 could be explained by glaciotectonic deformation.
The oversteepening described as the first structure in Sect. 6.1.3 is possibly representative of such a glaciotectonic deformation. In this context, oversteepening can occur when the bedded preglacial substratum is tilted by the overriding glacier (e.g., Phillips et al., 2002). According to Boulton et al. (2001) the tilting of the unlithified sediments occurs if the water pressure beneath the glacier and in the substratum is high enough to promote such motion and deformation. Accordingly, we interpret these oversteepeened beds as a glaciotectonite (Evans et al., 2006).
Subvertical faults and displaced bedding in the preglacial substratum could be the result of loading and the anisotropic compaction of the subglacial stratum. Alternatively, differences in the longitudinal motion of the glacier and differences in the motion transfer to an anisotropic substratum could result in the occurrence of strike-slip faulting. However, we are not aware that similar structures have previously been described and explained by glaciotectonics. Thus, the ambiguity in determining the formation process of the second feature in Sect. 6.1.3 remains.
Subhorizontal shear planes with slickensides as encountered at the base of the Quaternary suite were also observed beneath Breiðamerkurjökull (Benn, 1995) and were considered to indicate the occurrence of shear fractures (Boulton et al., 2001). These shear planes are formed due to an increase in the consolidation of the subglacial till and to a decrease in both the subglacial water pressure and water content, thereby promoting a downward increase in strain within the till (Boulton et al., 2001). The interpretation of such a consolidation in the Dmm.1 lithofacies is additionally supported by the highest sediment density values (2.26 ± 0.29 g cm−3, Table 2) and the associated high shear strengths (Fig. 4). Hence, we interpret the observed shear planes (third feature in Sect. 6.1.3) as a result of brittle deformation in the simple shear regime and in a water-poor subglacial setting at the base of a till section (3.5 m above the bedrock). Additionally, we identified a rotational bedrock intraclast attached to one of the shear planes, which supports the interpretation of deformation through simple shear (Phillips, 2018).
In summary, the subglacial tills represented by the lithofacies Dmm.1 and Dmm.2 as well as their subjacent beds bear deformation features that most likely resulted from glaciotectonic processes (Broster, 1991; Hart and Boulton, 1991; Phillips, 2018). Therefore and following Evans et al. (2006), we interpret these tills as subglacial traction tills.
7.3 Facies assemblage and interpretation of the sedimentary environment
In this section, we group the 12 lithofacies elements into 5 FAs (Fig. 4 and Table 2), which we use as a basis for reconstructing the depositional environment and the related evolution of the landscape surrounding the Bümpliz trough (Sect. 8).
FA 1 comprises beds of Dmm with interbedded Sdf, Shb, and Scb. This assemblage is encountered at depths between 84 and 103 m as well as 194 and 208.5 m and is dominated by the presence of Dmm beds, which overlie their substratum with sharp contacts. The structures preserved by the Dmm beds have been interpreted as recording the occurrence of glaciotectonic processes, which we have linked with the shear mechanisms that occur below a moving glacier. In such an environment, the interbeds could be interpreted as subglacial deposits that were detached from the substratum and thrust between layers of till as floes of intact sediment or reworked sediment patches (Sdf; Aber and Ber, 2007). However, we have not observed any evidence for thrust faults between the Dmm and its interbeds, which would be required for such an interpretation. Alternatively, the interbeds could have been deposited in subglacial or englacial conduits and ponds (Shb and Scb; e.g., Buechi et al., 2017). Accordingly, we refer to the lithofacies ensemble in FA 1 as subglacial traction till with interbeds.
FA 2 comprises an ensemble of the seven lfs Ghb, Gcb, Sm, Shb, Scb, Slm, and Dms and occurs at depths between 141 and 194 m upon a gradual contact with FA 1 sediments. Planar cross-bedding (10–30∘) and (sub)horizontal bedding are the dominant sediment structures in FA 2. Evidence for trough cross-bedding can be identified only in Scb and Slm. In a glaciolacustrine environment as inferred for the Bümpliz trough, such deposits could be formed by density flows at a delta/fan apron or in a prodelta/fan environment. These flows could originate from surges on a delta plane or collapses of the delta front, including ice-marginal deltas (Postma, 1990; Lønne, 1995; Winsemann et al., 2018). Alternatively, the density flows could also be ejected by (sub)glacial conduits in an ice-contact lake, or they could originate from collapses at the front of an ice-contact fan (Powell, 1990; Lønne, 1995; Mulder and Alexander, 2001; Winsemann et al., 2018). Because FA 2 directly overlays a subglacial traction till, we tentatively prefer the second interpretation. In such a context, the steep foresets (20–30∘) could form in front of subaqueous ice-contact fans or in front of deep-water deltas, including ice-contact deltas (Lønne, 1995). The subhorizontal beds could then accumulate in channels that are cut into the delta/fan foresets. Because the FA 2 sediments reveal a fining upward trend, the sourcing glacier was most likely retreating during deposition of FA 2.
FA 3 assembles beds of the five lfs Dms, Sm, Shb, Scb, and Sdf. This assemblage is found at depths between 103 and 141 m and overlies FA 2 upon a gradual contact. In contrast to the FA 2 sediments, FA 3 comprises up to 50 % of Dms beds recording the dominance of hyperconcentrated density flows. Because such currents could result from the efflux of subglacial conduits, we consider that the Dms beds record the occurrence of an ice-contact fan (Lønne, 1995). The thickness (ca. 6 m) and steep inclination (20–30∘) of individual Dms layers are consistent with such an interpretation as these structures point to the existence of steeply dipping foresets in front of an ice-contact fan. Because of the relatively (in comparison with FA 2) immature texture of the FA 3 deposits, we suggest that the sediment source (i.e., the glacier grounding line) had advanced relatively close to the depositional site (see also Lønne, 1995). In particular, we envisage a mechanism where the glacier either shifted closer to the depositional site or where it moved over the previously formed ice-contact fan. As discussed in Sect. 7.2, the oversteepening and faulting encountered in the uppermost 20 m of FA 3 (Sect. 6.1.3) were possibly formed by glaciotectonic deformation.
FA 4 assembles beds of Sm, Shb, Sdf, Fm, and Fdf. This assemblage is found in the outcrop +20 m above the top of the drilling and down to a depth of 84 m. This fourth FA is dominated by sand deposits with a massive texture or a grading that suggest deposition from hyperconcentrated density flows that escaped the glacier (Fitzsimons and Howarth, 2018) and quasi-steady hyperpycnal turbidity currents with sources in a delta/prodelta environment (Nemec, 1990; Postma, 1990; Fitzsimons and Howarth, 2018). Because FA 4 shows an overall fining-upward trend and follows upon FA 1 (Fig. 4), we envisage a scenario where the flows originated first from a glacier and then from a deltaic environment. Accordingly, the basin was finally fed by a braided river system that developed small mouth bars at the delta front (e.g., mouth bar-type deltas; Postma, 1990). Such a delta is expected to prograde towards the point of observation, resulting in a continuous filling of the lake. We do see evidence for such a development by the occurrence of the ca. 30 m-thick Fdf succession. These sediments are then overlain by Shb sands, which show evidence (ocher to brown color) for oxidation and thus for incipient pedogenesis. This allows us to allocate the approximate elevation of a local paleo-base level at the top of FA 4 at about 580 m a.s.l.
FA 5 comprises beds of Gsc only. This assemblage is found only in the outcrop within the Rehhag clay pit at heights of +30 to +20 m above the top of the drilling (Figs. 3 and 4). We interpret this lf as a fluvial deposit (Table 1). However, it is noteworthy that this fifth FA resides above the paleo-base level determined by FA 4. In this context, Isler (2005) interpreted this gravel unit as a sign of an advancing glacier (i.e., Vorstossschotter). We follow this interpretation based on (i) the large spatial extent, (ii) the large thickness exceeding 30 m, (iii) the occurrence of clasts up to cobble size, and (iv) the superposition of these gravel beds on top of the lacustrine sequence encountered at the Rehhag. We find it plausible that such tick gravel deposits can be linked to increased erosion, sediment transport, and water supply in response to the onset of another glacier advance.
8.1 Assignment of a depositional age
The pollen content of the encountered sedimentary suite was too low to allow a relative chronological positioning of the sedimentary succession and a paleoenvironmental reconstruction. We explain the low pollen concentration by the energetic depositional environment, which was dominated by the sediment supply through different density and turbidity flows. For pollen to accumulate, a persistently stagnant water column would be required, as was probably the case at the Meikirch and Thalgut sites. In fact, we have not encountered laminated and organic- and pollen-rich silt and clay layers in the drilled sedimentary suite.
The luminescence dating on a well-sorted sand of the mouth bar delta in FA 4 was more successful than the pollen analysis. Yet the luminescence signal of the tested sediment lies in the high dose range of the feldspar luminescence system (Fig. B1), possibly reflecting an old (ca. 105-year time range) depositional age of the sediment. Alternatively, the high dose range might also reflect an inherited signal due to the lack of light exposure of the feldspar grains prior to deposition (so-called “partial bleaching”), which is common in glacial environments as sediment is typically transported in suspension over short distances and in turbid water (Duller, 2006). We, however, interpret the high luminescence signals as mainly resulting from an old depositional age rather than a significant partial bleaching effect, because the sampled lithofacies shows evidence for incipient pedogenesis, which is indicative of an ice-free and light-exposed environment. The inferred sufficient exposure is additionally supported by the observed moderate overdispersion (OD ≦ 20 %) of the individual aliquot De distributions, which are within the common range of OD reported for well-bleached fluvial/glaciofluvial sediments (e.g., Galbraith et al., 2005; Jacobs et al., 2006; Gaar et al., 2014). Furthermore, the differences between the apparent IR50 and pIRIR225 ages (10 % to 25 %) lie within the typical range of age differences induced by differential fading (Buylaert et al., 2009; Li et al., 2014). Accordingly, a minimum age of about 250 ka is provided by two apparent (i.e., non-fading-corrected) pIRIR225 measurements, which are considerably more stable and underestimate ages to a smaller degree compared to the IR50 measurements. We note that a significantly higher single age (338.0 ± 164.5 ka, RE-03 IR50) was obtained after fading correction. However, this age needs to be taken with caution because (i) it is based on only two aliquots, it shows an unusual age increase (66 %), and it has a significant error, and (ii) a significant portion of aliquots De from both signals lie below the 2D0 saturation limit criterion (Table 2) and, thus, do not support a much older (i.e., several 100 ka) depositional age, despite a potential fading artifact (King et al., 2018). Considering the ensemble of these constraints, we tentatively suggest a depositional age > 250 ka for sequence B (minimum apparent pIRIR225 ages). This age is consistent with the regional stratigraphic context provided by the Thalgut and Meikirch drillings (Sect. 3), where sediments in an age range from MIS 11 to MIS 6 have been recovered so far. Most noteworthy, such an age is supported by sedimentological evidence, because the transition from a lacustrine to fluvial environment (paleo-base level) is recorded at an elevation of about 580 m. a.s.l. at both the Meikirch and Rehhag sites. This facies change was dated to lie within the MIS 7 in the Meikirch sedimentary succession (Preusser et al., 2005). Therefore, we tentatively assign an MIS 8 (300–243 ka) to MIS 7 (243–191 ka) depositional age to the well-sorted sand unit at the top of FA 4 because of the apparent similarities in the stratigraphic architectures of the Meikirch and Rehhag sedimentary successions.
8.2 Evolution of the Bümpliz trough
In the following, we use the succession of distinct FAs encountered in the Rehhag core and clay pit to reconstruct a scenario of how the landscape evolved throughout the deposition of the analyzed sedimentary succession (Fig. 6). The entire suite starts with a glacial till (FA 1), which contains evidence for active bedrock erosion and glaciotectonic processes. This basal till was thus most likely formed during a glacial advance into the Bümpliz trough (Fig. 6a). Although there is ample evidence for the occurrence of bedrock erosion during this glacial period, the formation of the Bümpliz overdeepening through this particular glacier is a possible hypothesis, which, however, cannot be tested with the available observations. The sediments of the overlying FA 2 record the retreat of possibly the same glacier that deposited the basal till. As a result, the overdeepening was filled with meltwater, and a > 150 m-deep proglacial lake was formed. A range of subaqueous density flow deposits accumulated in a distal ice-contact fan environment (Fig. 6b), recording a further retreat of the glacier.
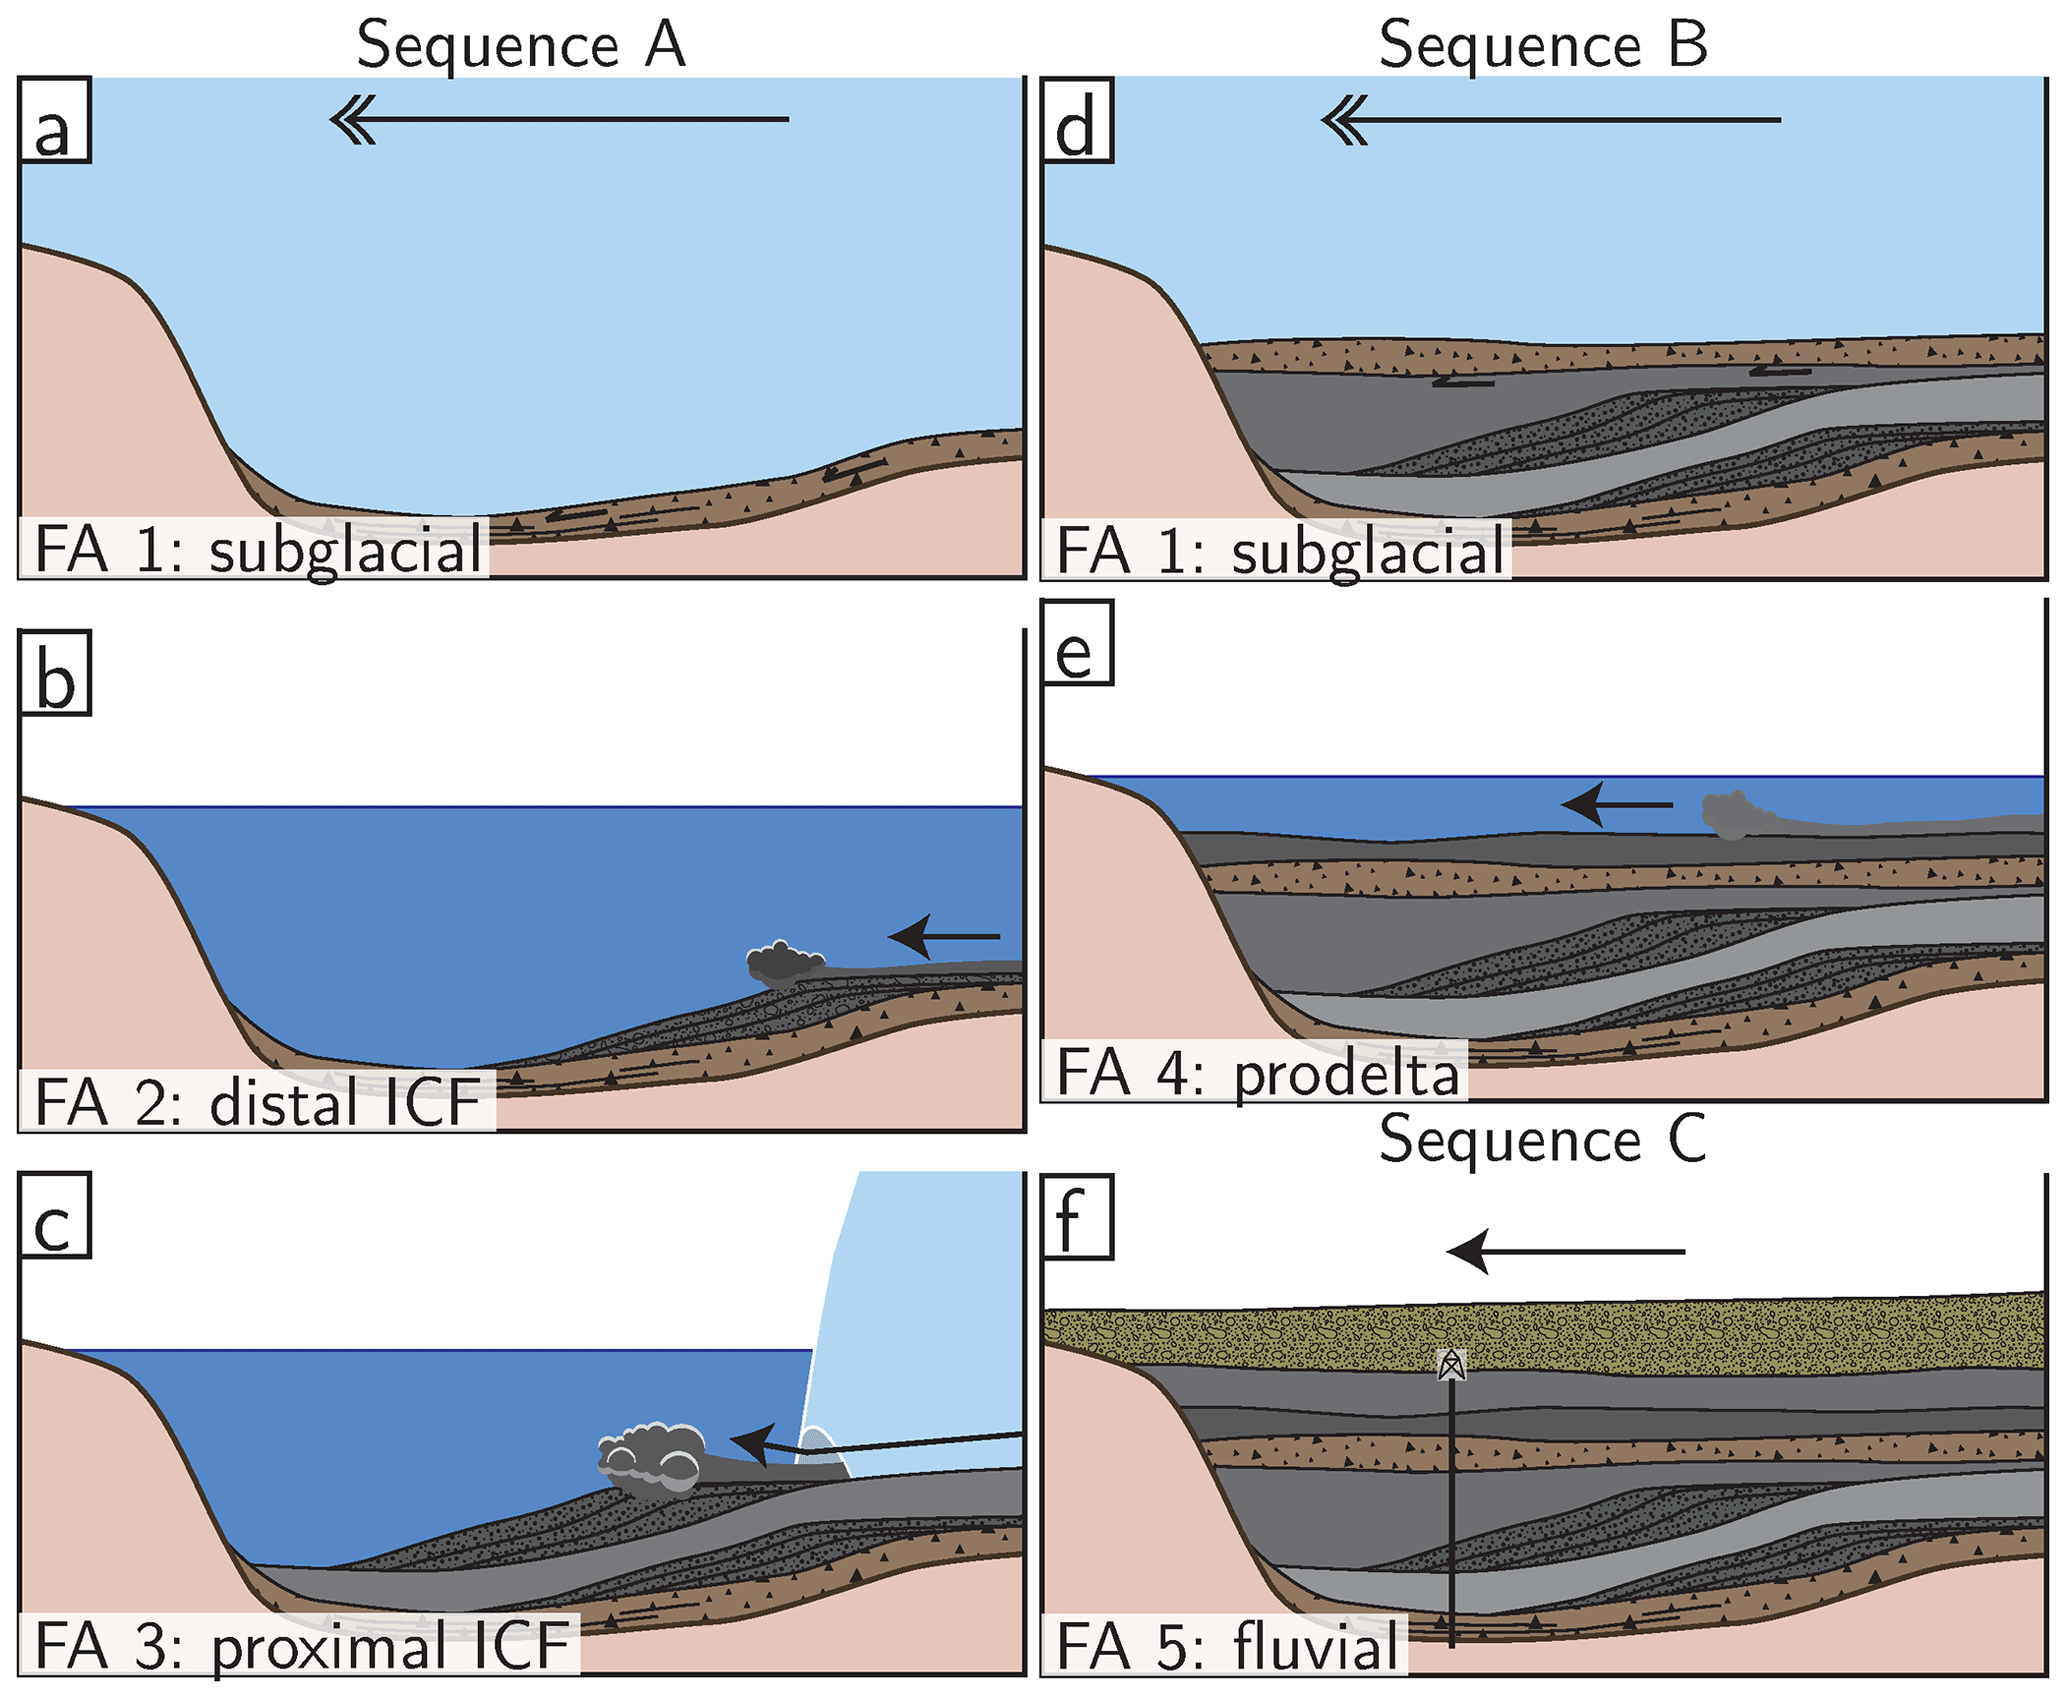
Figure 6Schematic figures showing the evolution of the Bümpliz trough (Sect. 8.2 and Fig. 1d) as inferred from the retrieved sediment core. The relative core position is indicated by a vertical black line in (f). The facies assemblages related to each phase in the model are specified in the figures. Glacier ice is colored light blue, ice motion is indicated by a double-headed arrow, lake water is dark blue, and single-headed arrows indicate sediment flow. (a) First glacial advance with bedrock erosion and brittle shearing of the subglacial till. (b) Retreat of the glacier and fining-up aggradation in a distal ice-contact fan (ICF) setting. (c) Deposition of “flow tills” after overcoming a threshold on the lake bed and/or a glacial advance (ICF). (d) Erosion and cutting off foresets due to a second glacial advance with formation of a glaciotectonite (oversteepening). (e) Deposition from underflows in a proglacial lake or from turbulent density flows on a lacustrine prodelta. (f) Overfilled lake basin covered by thick glaciofluvial gravel beds.
Subsequently, flow tills (i.e., hyperconcentrated density flows) dominated the sedimentary processes in a proximal ice-contact fan environment (FA 3), thus documenting a second advance of a glacier close to the depositional site (Fig. 6c). At this stage, we are not capable of determining whether this was the same glacier as the one that formed the basal till above the bedrock. Abruptly, the flow till deposits were cut by the same or another glacial advance, as evidenced by the upper and thus stratigraphically younger till (Fig. 6d) that has a similar lithofacies assemblage and thickness to the basal till. This glacier dragged or thrust the underlying beds into an oversteepened position, thereby leaving distinct features of glaciotectonic deformation. After the retreat of this particular glacier, accommodation space was again available to be filled with water, which was ca. 80 m deep, and subsequently with sediment (Fig. 6e). During this time, sedimentation was dominated by concentrated density flows and turbidity currents. These flows were probably first generated from underflows that were sourced by conduits escaping the glacier. They subsequently originated from floods on a delta top or collapses on a delta flank. As sediment accumulation continued, the lake basin was eventually filled to a paleo-base level. Following the filling of the lake basin, the area was gradually covered by thick glaciofluvial gravel beds (Fig. 6f), which could point towards another glacial advance.
Overall, the sediment that was retrieved from the Bümpliz trough documents a shallowing-up sequence. Following an erosional glacial advance, the formation of the sequence started in an underfilled trough or a basin. After one break of the sequence, the lake basin was filled to a paleo-base level and evolved into overfill conditions. This overfill probably occurred in parallel with the third advance of a glacier close to the Bümpliz trough. Therefore, and as already suggested in Sect. 6.1, the sedimentary sequence within the Bümpliz trough can be subdivided into two main stratigraphic sequences, the lower sequence A and the upper sequence B. Both sequences started with the formation of a glacial till that was subsequently covered by thick glaciolacustrine and lacustrine deposits. Finally, the occurrence of the glaciofluvial gravel beds on top of sequence B could be regarded as a further sequence C, when overfill conditions prevailed and when the region evolved into a large fluvial braidplain.
The segmentation of sequences A and B is additionally supported by the results of the γ density, magnetic susceptibility, and carbon content measurements and could reflect distinct changes in environmental conditions. First, the higher γ density of the sequence A deposits could indicate that the material of this sequence was loaded and compacted by more glacial advances than the material in the upper sequence B, yet the loading by the sediment column itself can have a similar effect. Second, the relatively high MS signal amplitude in sequence A and in the upper till could be related to the abundance of coarse-grained material in these deposits. Third, the drop in the carbonate concentration between sequences A and B could indicate a more pronounced input and admixture of Molasse bedrock during the deposition of sequence B. Potentially, there is a connection between the observed MS signal and the carbonate concentration in that the sediment composition varies between the two sequences and that the sediment routing and supply were modified during the lacustrine phase in sequence B.
We analyzed 208.5 m of unconsolidated Quaternary sediment and 3 m of Molasse bedrock in a drill core recovered from the Bümpliz trough, a branch of the overdeepening in the MAV. It is the first scientific drilling in the MAV that reached bedrock. The retrieved sediments revealed two major sequences, A (lower) and B (upper), with each of them starting with a till deposited when the area was glaciated. Each glacial period was accompanied by erosion of Molasse bedrock as documented by the relative depletion of the CaCO3 concentration in either till. Molasse rafts and shear planes in the lower till provide evidence for the occurrence of erosion and glaciotectonic deformation during the first recorded glacial advance. Similarly, the formation of the upper till was accompanied by glaciotectonic deformation of the substratum during the second glacial advance. Each till is overlain by subaqueous (glacio)lacustrine sediments that record the filling of the overdeepened trough after the ice retreated from the area. The lower sequence A documents the supply and deposition of sediment by a range of density and turbidity currents. It was formed in a grounding line setting, where the ice was submerged in a proglacial lake and where sediment-laden (sub)glacial conduits formed ice-contact fans. The upper sequence B chronicles the supply and deposition of sediment mainly by turbidity currents. It was formed in a delta apron to prodelta environment, where the turbid flows were generated either from underflows in a proglacial lake, from flooding events on the delta plain, or from gravitational collapses at the delta front. Measurements of IRSL signals indicate that the deposition of the upper, stratigraphically younger sequence B probably occurred in a phase of global cooling during MIS 8 and the subsequent interglacial MIS 7. Hence, sequence B of the presented drilling is likely an equivalent to the sedimentary sequence recovered in the nearby scientific drilling in Meikirch. Finally, sequence B evolved into overfilled conditions, recorded by the fluvial braidplain deposits of sequence C.
A1 Lithofacies 1: Gsc, gravel with basal scours (outcrop only)
This lf is composed of an amalgamation of moderately to well-sorted, clast-supported, fine-grained to cobble-sized gravel beds and is only encountered in the Rehhag outcrop (Fig. 3). The matrix can vary from fine- to coarse-grained sand with light-brown to gray-brown color. Individual gravel beds are between 10 and 100 cm thick and have mostly gradual basal contacts. They display a stacking of beds with inverse-to-normal grading. Additionally, beds with concave-upward, sharp basal contacts are present. These beds often contain a layer of sand along the contact. Well-sorted gravel beds show clast imbrication. The clasts are subrounded to rounded and comprise rather durable lithologies that are derived from the Alpine nappes. In particular, we encountered the following clast types: (i) limestones, siliceous limestones, and dolomites that were most likely derived from the Helvetic and Penninic Prealpine thrust nappes, (ii) arkose sandstone clasts, which might be derived from the Permian/Triassic suite overlying the Aar Massif, (iii) quartzite constituents, which could be derived from either the Triassic cover of the Penninic Bernhard nappe or which represent recycled material from Miocene Molasse conglomerates, and (iv) rare metamorphic or granitic/granodioritic clasts (Fig. 1b; Institut für Geologie, Universität Bern and Bundesamt für Wasser und Geologie, 2005). The latter crystalline lithologies are either derived from the Aar Massif or the crystalline Penninic nappes. Alternatively, crystalline clasts might also represent recycled material from the Miocene Molasse conglomerates (Matter, 1964). Granitic/granodioritic and quartzite constituents are more abundant in Gsc than in any other lf and dominate the cobble fraction.
Interpretation. Concave-up structures point towards the occurrence of basal scouring. Well-sorted gravel with basal scours is commonly encountered where water flow is funneled in channels. Sorting and particularly imbrication indicate fluctuating transport energies, including localized upper flow regime conditions (e.g., Garefalakis and Schlunegger, 2019). The well-sorted nature of this lithofacies together with the clast fabric indicates that the material had been transported over some distances before the gravel was deposited. Overall, this fabric is characteristic of a transport and deposition by water, possibly by a braided river (Rust, 1978; Miall, 1985).
A2 Lithofacies 2: Ghb, horizontal-bedded gravel (below 185 m depth)
This lf is composed of moderately sorted, clast- and matrix-supported, fine- to medium-grained gravel beds. The matrix can vary from fine- to coarse-grained sand, which has a brownish-gray to gray color (Fig. 5a). The bed thicknesses vary between 3 and 70 cm. Because individual beds do not show any evidence for inclination, we consider them to be horizontally bedded. Individual gravel beds that are > 5 cm thick commonly have a sharp basal contact, whereas thinner gravel beds can gradually evolve from underlying sand beds and thus display gradual basal contacts. Normal and inverse gradings are most common in beds that are > 10 cm thick. In addition, intra-bed transitions from inverse to normal grading occur where beds are > 50 cm thick. In normally graded beds, grain size can decrease to thin layers solely composed of sand. Gravel components are subangular to rounded and comprise lithologies that are indicative of an Alpine origin (see Gsc).
Interpretation. This lf was probably deposited from waxing and waning concentrated or hyperconcentrated density flows, which were generated by gravitational instabilities in a delta/fan environment (Mulder and Alexander, 2001) or by underflows in an ice-contact lake (Fitzsimons and Howarth, 2018). We base this interpretation on the presence of normal and inverse grading, the moderate sorting, and the clast- and matrix-supported fabric (Lowe, 1982; Mulder and Alexander, 2001). Occasionally, the density of these flows decreased to such a degree that only sand was transported and deposited, as indicated by thin sand intercalations. We consider the coarse-grained composition of this lf together with the inferred transport mechanism as evidence for a relative proximity to the sediment source (Mulder and Alexander, 2001).
A3 Lithofacies 3: Gcb, cross-bedded gravel (below 185 m depth)
This lf comprises moderately sorted, clast- and matrix-supported, fine- to medium-grained gravel beds. The matrix is composed of fine- to coarse-grained sand, which is brownish gray to gray. Individual beds are between 5 and 70 cm thick and show inclinations where the dip angles range from 15 to 30∘. Normal and inverse grading is frequently observed. Similarly to Ghb, transitions from inverse-to-normal grading within individual beds are often present where beds are > 50 cm thick. The clasts are subangular to rounded and comprise lithologies that are indicative of an Alpine origin (see Gsc).
Interpretation. The angles (15–30∘) observed in this lf correspond to dip angles of bed sets in cross-beds. We therefore consider this lf to be cross-bedded. Steeply dipping cross-beds can be indicative of large-scale foresets in deltas and fans (Lønne, 1995). Additionally, the observed dip angles can be indicative of foresets and backsets in scours formed around chutes-and-pools or for backsets into scours that formed behind an isolated hydraulic jump, both under supercritical flow conditions within fans and deltas, which formed in proglacial lakes (Hornung et al., 2007; Lang et al., 2017, 2021). The required supercritical flow can either result from motion on steep slopes or from the confinement of channels (Parker et al., 1986; Mulder and Alexander, 2001). In such a context, the formation of channels and scours by currents eroding their substratum is more likely to occur through concentrated density flows, due to an increased flow velocity compared to hyperconcentrated density flows (Parker et al., 1986). The spatial extent and further characteristics of these cross-beds could not be observed in the cored sediment. Otherwise, this lf is similar to Ghb. Therefore, we suggest a similar mechanism where concentrated or hyperconcentrated density flows transported and deposited the material in a delta or fan environment.
A4 Lithofacies 4: Sm, massive sand
This lf is composed of well-sorted, massive, silty fine- to medium-grained sand beds. The color of the material varies between brownish gray and gray brown. Individual beds are between 30 and 100 cm thick and commonly have a sharp base. Individual beds and layers do not show any evidence for inclination, and thus we consider them to be horizontally bedded. Isolated clasts of coarse-grained sand to medium-sized gravel are embedded within the silty sand and are considered outsized clasts. Such clusters of outsized clasts are encountered throughout entire beds or in limited sections within individual beds.
Interpretation. The lack of stratification and the presence of gravel clusters in entire or in parts of individual beds are probably signs of confined particle motion (saltation and/or fluid turbulence are absent) in a hyperconcentrated density flow (Mulder and Alexander, 2001). Such flows need a considerably inclined bed to move, and they come to a fast halt through frictional freezing (Lowe, 1982; Mulder and Alexander, 2001). In submerged basins fed by subglacial conduits, these flows can also be quasi-steady and might not point to the occurrence of short-lived pulses (Plink-Björklund, 1999).
A5 Lithofacies 5: Shb, horizontal-bedded sand (entire core and outcrop)
This lf comprises well-sorted, silty fine- to coarse-grained sand. In the core, the color varies between brownish gray and gray brown (Fig. 5b). In the Rehhag outcrop, the color of this lf depends on the grain size. In particular, the coarsest grains cause a gray tone, whereas the finer-grained sand particles are responsible for an ocher and brown color. Individual beds are 5 to 40 cm thick, have a sharp base, and bear no sign of inclination. Gradual contacts can occur with both underlying or overlying gravel beds. The sand can be massive or shows either a normal or inverse grading. Inverse-to-normal grading occurs in thicker beds. Normally and inversely graded beds can include thin layers of fine- to medium-sized gravel.
Interpretation. The grading in this lf suggests that the proportion of fluid to solid material in the flow was larger during deposition of its beds than during transport and accumulation of the Sm layers (see above). With a higher proportion of fluid in the flow, turbulences become important for keeping particles aloft, with the consequence that the transport of particles larger than medium-grained gravel cannot be accomplished (Mulder and Alexander, 2001). In a lacustrine delta-front to prodelta setting, Mulder and Alexander (2001) consider the oscillation of grading in sand beds as resulting from the waning and waxing of quasi-steady hyperpycnal turbidity currents. Similar (sub)horizontal sand beds can, however, be formed in fluvial braidplains that can occur on an active delta plain (Miall, 1985; Postma, 1990).
A6 Lithofacies 6: Scb, cross-bedded sand (below 107 m depth)
This lf comprises well-sorted, silty fine- to medium-grained sand. Bed thicknesses range from 5 to 40 cm. The color varies between brownish gray and gray brown. Individual beds have a sharp base, and they are inclined with dip angles between 10 and 35∘. Opposite dip directions were formed on a scale that is small enough for them to be present within a single core section. Gradual contacts can occur with underlying gravel layers. Beds are massive or show normal and inverse grading. Inverse-to-normal grading is present within individual beds and can include thin gravel layers.
Interpretation. Similarly to Gcb, we consider the dip angles between 10 and 35∘ as a sign of cross-bedding and that the opposite dip directions within single core sections are evidence for the occurrence of a trough cross-bedding. The presence of such cross-beds could be a sign of concentrated density flows within the lower flow regime (e.g., Bouma Tc; Bouma, 1962). Compared to the Sm lithofacies, however, these flows were possibly more diluted because the formation of cross-bedding requires that the grains were able to saltate.
A7 Lithofacies 7: Slm, laminated sand (below 185 m depth)
This lf is composed of well-sorted, silty fine- to medium-grained sand. The color varies between brownish gray and gray brown. Individual beds are between 20 and 50 cm thick and have a sharp basal contact. The layers are either horizontally bedded or inclined with dip angles between 10 and 35∘. Beds of this lf bear intercalated silt laminae or sand laminae with increased silt content and with sharp contacts with the surrounding sand (Fig. 5c). These laminae show a sub-parallel alignment with an inhomogeneous spacing. Within individual core sections, multiple stacks of laminae can dip in opposite directions.
Interpretation. The presence of laminae, which are the main feature in this lf, suggests deposition in both the upper (Tb) or lower (Td) flow regimes. In this context, the cross-stratified laminations with opposite dip orientations could form either in a Tb to Td setting (Bouma, 1962).
A8 Lithofacies 8: Sdf, deformed sand
This lf comprises well-sorted, silty fine- to medium-grained sand. The color varies between brownish gray and gray brown. Individual beds are between 5 and 50 cm thick and have either sharp or gradual basal contacts. The beds can be horizontally bedded or are occasionally inclined. Internally, this lf shows a slightly chaotic arrangement of layers as well as wavy and folded structures. These waves and folds are visible due to slight changes in sediment composition.
Interpretation. The presence of folded structures within inclined beds could hint towards the occurrence of synsedimentary deformation of beds by sliding. More chaotic structures could also result from the escaping of water after the sudden loading of water-saturated sediment layers. The chaotic structures might thus be similar to ball-and-pillow structures.
A9 Lithofacies 9: Fdf, deformed mud and sand (above 21 m depth and outcrop)
This lf comprises layers that are composed of clayey silt and beds with silty to fine-sandy medium-grained sand. The color varies between olive gray and gray brown (Fig. 5d). The sediment is characterized by a chaotic pattern in which the alternation of sand and silt layers is disrupted, folded, and crumpled. These deformed beds form successions that are several decimeters to meters thick and display sharp contacts with other lf.
Interpretation. This lf shows flame-like structures together with a chaotic bedding and convolute structures. We consider these observations as evidence for deformation, for example, trough sliding. However, indicators for inclination were not encountered, which might have been lost during the synsedimentary deformation.
A10 Lithofacies 10: Fm, massive mud
This lf comprises massive, very well-sorted clayey silt layers (Fig. 5e). The thicknesses of individual beds vary between 1 and > 100 cm. The color ranges between olive gray and dark gray. Mud beds that are between 1 and 5 cm thick are encountered at depths below 100 m. The thickness of layers gradually increases upsection, and mud beds are thickest at ca. 20 m depth. The contacts with the overlying beds are sharp. However, the contacts with the underlying coarser-grained lf can be sharp or gradual.
Interpretation. The very fine-grained composition of this lf hints at a deposition by settling in very quiet or stagnant water, for example, in a lake. Stagnant water conditions can occur temporally, e.g., during different seasons, or spatially, e.g., at a considerable distance from the location of a water influx. However, lamination is absent in this lithofacies. Layers of massive silt can for example be formed on top of a Bouma sequence after the preceding turbulent flow has ceased (Te; Bouma, 1962).
A11 Lithofacies 11: Dms, stratified diamict (below 103 m depth)
This lf is poorly sorted and comprises subangular to rounded outsized clasts that range in size from coarse sand to cobble and that are embedded in a silty fine-grained sand matrix (Fig. 5f). The matrix is massive and dominant in volume. Therefore, this lf can be categorized as a clast-poor diamict. The matrix color ranges from light-brownish gray to dark gray. The beds are between 10 and > 100 cm thick. Individual layers of Dms can have apparent thicknesses of ca. 6 m, yet this estimate could be biased by the core liner length. The basal contacts are sharp and are either horizontal or dip at angles between 20 and 30∘. The outsized clasts can be disorganized, or they are arranged in strings of clasts. In these strings, the a–b plane of individual clasts is aligned in one direction. Furthermore, these strings are oriented parallel to the dip of the basal contacts or to the inclined interbeds of other lfs. The lithologies of these clasts are identical to those in lf 1.
Interpretation. This lf is markedly different from all lfs described above due to its diamictic composition. Similarly to Sm, such a composition can develop from hyperconcentrated density flows (Mulder and Alexander, 2001). Yet the Dms is different as the clasts' a–b planes can be aligned, which hints towards the occurrence of a flow-internal shear component (Nemec, 1990; Nemec et al., 1999). Furthermore, the diamictic composition indicates that the deposition occurred close to the sediment source (because of a lack of sediment sorting) or alternatively points towards a large grain size variety of the entrained and supplied material. Although such a diamict could be a glacigenic deposit, we interpret the continued and noticeable inclination of the beds as evidence for their deposition as foresets. Other authors might previously have referred to similar deposits as flow tills if they were encountered in a glacial environment (e.g., Dreimanis, 1989).
A12 Lithofacies 12: Dmm, massive diamict
This lf is very poorly sorted, matrix-supported, and comprises coarse-grained sand to cobble-sized clasts that are embedded in a silt to medium-grained sand matrix with a brown to ocher color (Fig. 5g and h). The abundance of clasts is variable. Locally, this diamict can vary in composition from clast-poor to clast-rich. The thicknesses of individual beds range from 20 to > 100 cm. The basal contacts are sharp and horizontal. The beds are massive without any evidence for a stratification. The clasts are subangular to rounded, and their lithologies are identical to those in lf 1. Generally, the encountered clasts do not show striation and grinding marks. Although all the layers within the Dmm share the above properties, the Dmm beds at the bottom (Dmm.1) and the center (Dmm.2) of the drilled core show markedly different sedimentary features.
The beds of Dmm.1 at the base of the cored sediment contain sandstone clasts of the LFM bedrock. These clasts range from coarse-grained sand to boulder size with the largest components close to the bedrock, and these are angular to subangular. Alpine clasts are absent within the lowermost meter of the cored sediment. Above this lowermost meter the proportion of Alpine to Molasse constituents increases upsection. Furthermore, patches and bands in the Dmm.1 matrix have a similar or even the same color as the red-, yellow-, and green-colored Molasse bedrock. The beds of Dmm.2 only contain Alpine clasts, and blocks derived from the LFM are missing.
Interpretation. This lf is similar to Dms in composition, yet it shows a difference in color and does not bear signs of a stratification. These are distinct differences to all previous lfs. Deposits with a disorganized distribution of coarse-grained material can result from cohesive debris flows in which a silt and clayey matrix provides cohesion to the moving material (Mulder and Alexander, 2001). These subaqueous cohesive debris flows have a low erosive power, possibly due to motion on a thin water layer (Iverson, 1997; Mulder and Alexander, 2001). Alternatively, such diamictic material with a disorganized distribution of clasts can be observed in glacigenic deposits. Therefore, the interpretation of the formation process of Dmm is ambiguous. This ambiguity can only be resolved in a larger context, which is provided when lithofacies elements are grouped into lithofacies assemblages. These assemblages are presented in Sect. 7.
Two samples (RE-01 and -03) were recovered from a ca. 10 m-thick set of Shb within FA 4 for the measurement of infrared stimulated luminescence at 50 ∘C (IR50) and 225 ∘C (pIRIR225) on feldspar grains. We used 18 cm-long, 4.6 cm-wide, capped, and lightproof PVC tubes to collect the unconsolidated sand. The tubes were run into the sediment using a hammer. Dose rate samples were scraped around the tubes into plastic bags prior to the extraction of the tubes. After treatment with H2O2 and HCl (both 15 %), the grain size interval between 180 and 212 µm was separated for the measurements. Feldspar minerals were then extracted using a sodium poly-tungstate heavy liquid. Per sample, 12 aliquots with 1 mm mask diameter were prepared for the equivalent dose analysis. A single-aliquot regenerative-dose (SAR; Murray and Wintle, 2000) post-IR IRSL protocol based on Buylaert et al. (2009) was used (Table B1). The luminescence measurements were conducted on an automated Risø TL/OSL reader. The aliquots were illuminated with IR LEDs (max. ca. 130 mW cm−2; 100 s at 90 %). The emitted signals passed through a 410 nm interference filter (LOT-Oriel D410/30 nm) and one Schott BG-39 and were detected by an EMI 9235QB photo-multiplier tube. Fading measurements were conducted on six (RE-01) and seven (RE-03) aliquots per sample in order to derive the average fading parameter ρ′ for both samples and each signal (Auclair et al., 2003; Huntley and Lamothe, 2001). The K, Th, and U content was determined by high-resolution gamma spectrometry on ca. 400 g of sample. Then, the natural dose rate was calculated with the DRAC online tool (Durcan et al., 2015).
Table B1Modified post-IR IRSL 225 ∘C (Buylaert et al., 2009) protocol applied to measure the luminescence signals from feldspar.
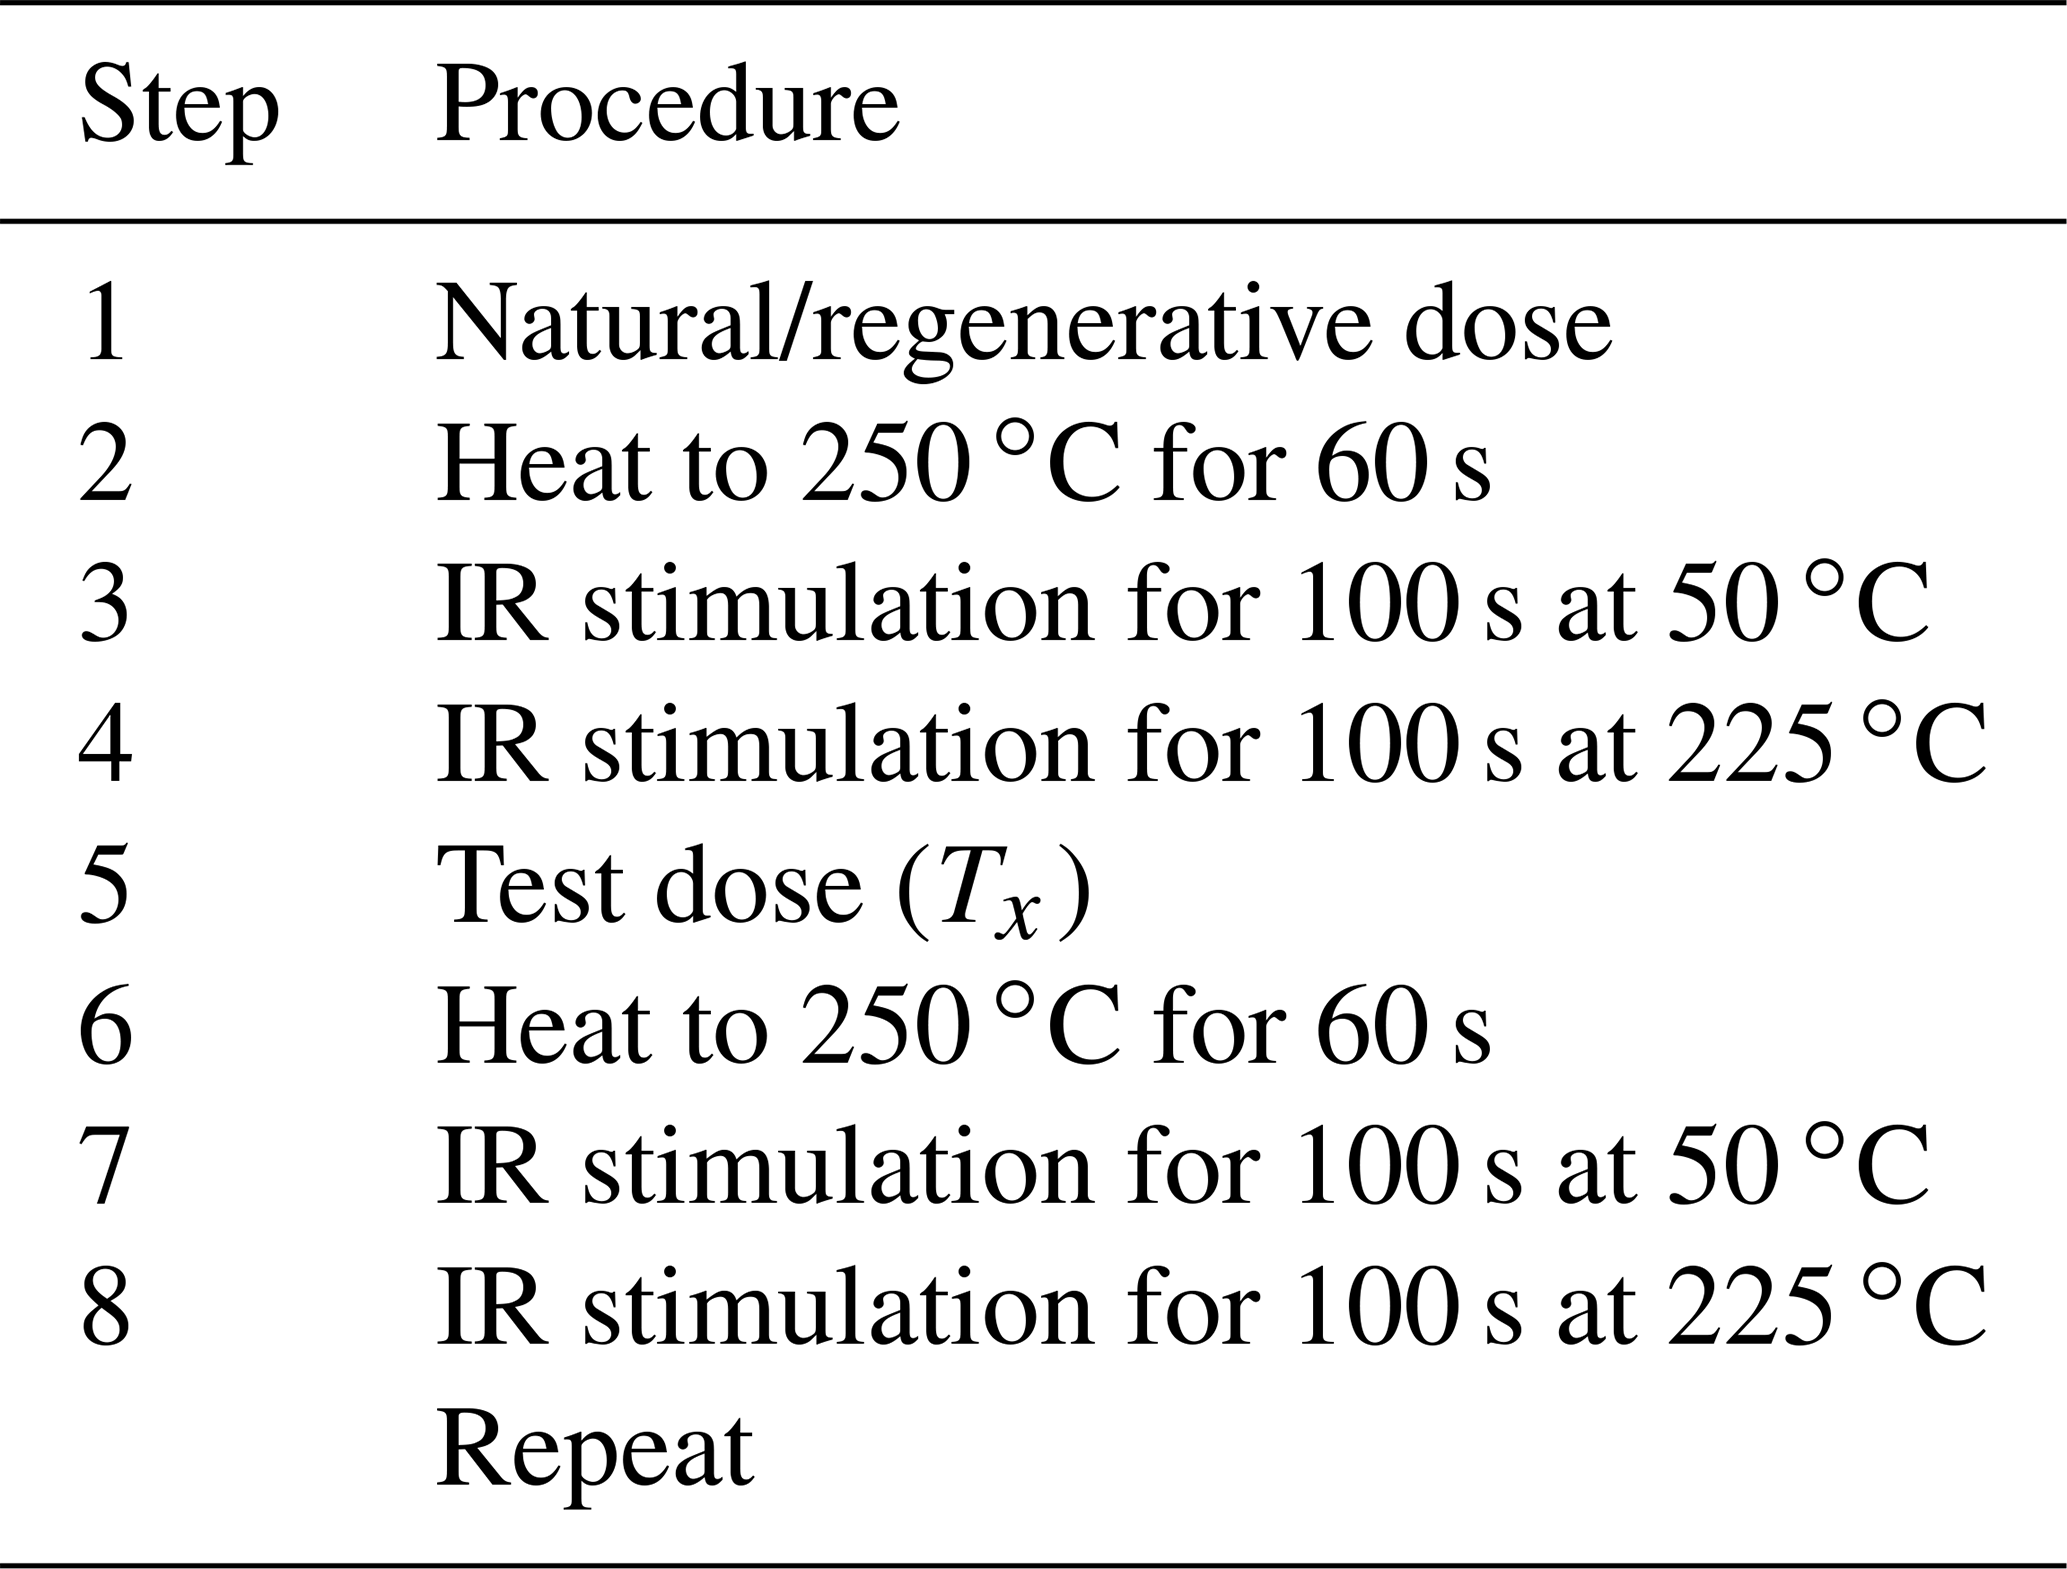
IRSL measurements were analyzed using the R.Luminescence package (Kreutzer et al., 2012) and an R script specifically written to allow for a routine multistep analysis. The apparent equivalent dose of individual aliquots (De) for both signals was determined with a single exponential saturation function (Fig. B1a). The measurement quality of individual aliquots was tested by applying a recycling ratio (10 % of unity) and a recuperation (5 % of the natural signal) criterion. To evaluate aliquot saturation, the 2D0 rule was applied (De > 2D0 saturation; Wintle and Murray, 2006). The reliability of the measurement protocol was confirmed through dose recovery tests (DRTs) that were conducted on each sample. The DRT results lay within 15 % of the given dose for both signals. In a first step, the R routine performed a saturation test on the De of individual aliquots, which passed the recycling ratio and the recuperation criterion. After the rejection of saturated aliquots, the equivalent dose for each sample (ED) and per signal was calculated, using the Central Age Model (CAM; Galbraith and Roberts, 2012), which was then used to determine the respective apparent ages. In a second step, the remaining aliquots were individually corrected for fading, using the model of Kars et al. (2008). The fading-corrected aliquots were then tested for saturation again, and only aliquots that passed this second test were used to determine a fading-corrected age (Fig. B1b).
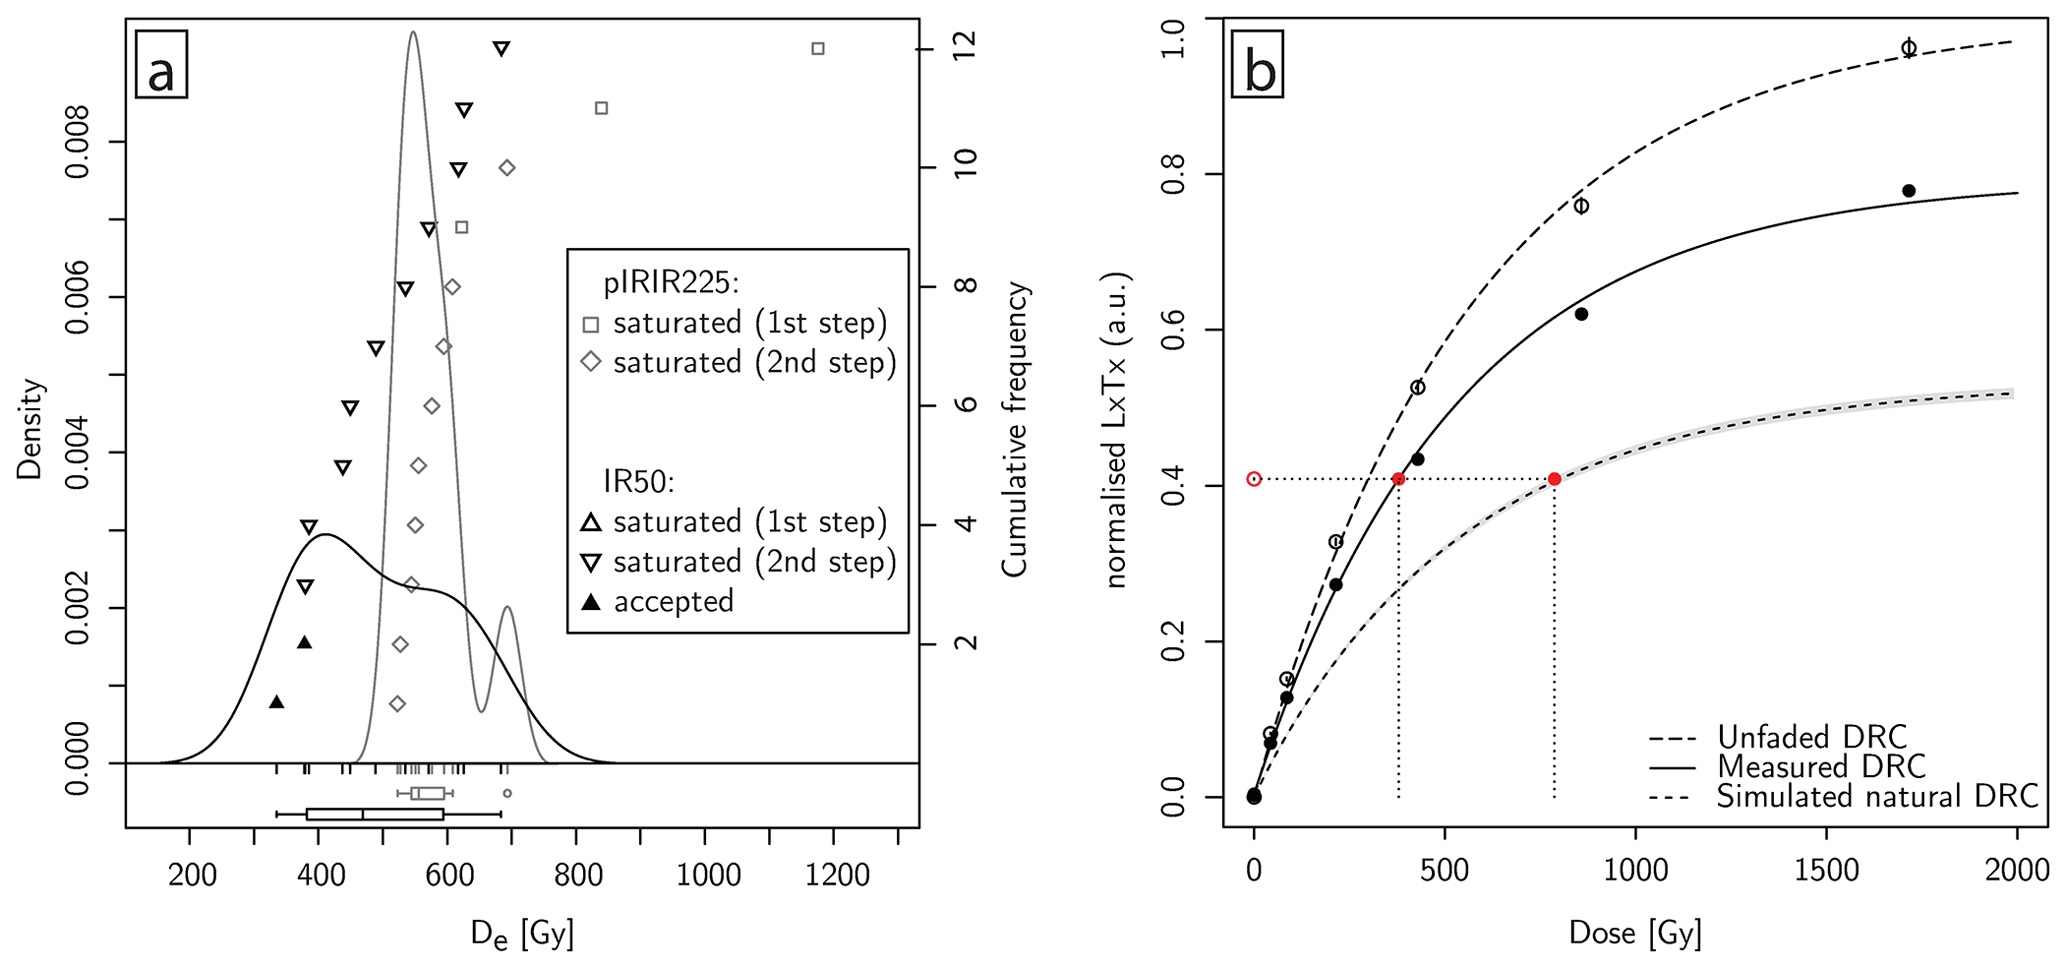
Figure B1Analysis of luminescence measurements for sample RE-03, using R.Luminescence (Kreutzer et al., 2012). (a) Plot of the apparent De distribution for the IR50 (triangle symbols) and pIRIR225 (square symbols) signals. (b) Dose response curves (DRCs) of one of the two aliquots that passed both steps of saturation testing. This plot shows both the measured laboratory DRC and the modeled/simulated fading-corrected DRC based on Kars et al. (2008).
All data obtained during the core processing and luminescence measurements as well as the respective analyses can be found in a separate data publication (https://doi.org/10.5880/fidgeo.2021.021, Schwenk et al., 2021).
MAS analyzed the data and wrote the paper, with support by FS. MAS designed the drilling campaign and FS organized the funding. PS conducted the pollen analysis, and DB was responsible for the gravity survey. NG supported the OSL dating, and GAD provided input during fieldwork and core analysis. All the authors approved the text and the figures.
The authors declare that they have no conflict of interest.
Publisher's note: Copernicus Publications remains neutral with regard to jurisdictional claims in published maps and institutional affiliations.
We acknowledge the professional drilling by Fretus AG that provides a core with excellent quality. Special thanks also go to Toggenburger AG for dislocating their equipment and for giving access to the drill site and to Rehhag AG (Roland Schütz) for offering the ground for drilling. Peter Hayoz is kindly thanked for transporting the drilled material to the Swisstopo core repository, where the material is currently being stored. The carbon content analyses were run by Julia Krbanjevic, Institute of Geological Sciences, University of Bern. Gamma spectrometry was carried out by Sönke Szidat, Department of Chemistry and Biochemistry, University of Bern. We thank the research group for paleoecology of Willy Tinner at the Institute of Plant Sciences, University of Bern, for providing their facilities for the palynological investigation. We thank Urs Marti at Swisstopo for providing the gravimeter for the conduction of the gravimetry survey. We are grateful to the Direktion für Tiefbau, Verkehr und Stadtgrün of Bern for helping with the carving of trenches in the Rehhag clay pit.
This research has been supported by the Schweizerischer Nationalfonds zur Förderung der Wissenschaftlichen Forschung (grant no. 175555), Swisstopo, the Stiftung Landschaft und Kies, the Gebäudeversicherung GVB, the Aaretal Kies AG (KAGA), and the city of Bern.
This paper was edited by Ulrich Harms and reviewed by Cesare Ravazzi, Volker Wennrich, and one anonymous referee.
Aber, J. S. and Ber, A.: Glaciotectonism, Elsevier, London, UK, 2007. a
Akçar, N., Ivy-Ochs, S., Alfimov, V., Schlunegger, F., Claude, A., Reber, R., Christl, M., Vockenhuber, C., Dehnert, A., Rahn, M., and Schlüchter, C.: Isochron-burial dating of glaciofluvial deposits: First results from the Swiss Alps, Earth Surf. Proc. Land., 42, 2414–2425, https://doi.org/10.1002/esp.4201, 2017. a
Anselmetti, F. S., Preusser, F., Bavec, M., Crouzet, C., Fiebig, M., Gabriel, G., Ravazzi, C., and Spoetl, C.: Drilling overdeepened Alpine valleys (DOVE), EGU General Assembly Conference Abstracts, 12–17 April 2014, Vienna, Austria, p. 12437, 2014. a
Auclair, M., Lamothe, M., and Huot, S.: Measurement of anomalous fading for feldspar IRSL using SAR, Radiat. Meas., 37, 487–492, https://doi.org/10.1016/S1350-4487(03)00018-0, 2003. a
Beakawi Al-Hashemi, H. M. and Baghabra Al-Amoudi, O. S.: A review on the angle of repose of granular materials, Powder Technol., 330, 397–417, https://doi.org/10.1016/j.powtec.2018.02.003, 2018. a
Benn, D. I.: Fabric signature of subglacial till deformation, Breidamerkurjökull, Iceland, Sedimentology, 42, 735–747, https://doi.org/10.1111/j.1365-3091.1995.tb00406.x, 1995. a
Beug, H.: Leitfaden der Pollenbestimmung für Mitteleuropa und angrenzende Gebiete, Verlag Dr. Friedrich Pfeil, München, Germany, 542 pp., 2004. a
Bickel, L., Lüthgens, C., Lomax, J., and Fiebig, M.: The timing of the penultimate glaciation in the northern Alpine Foreland: new insights from luminescence dating, P. Geologist. Assoc., 126, 536–550, https://doi.org/10.1016/j.pgeola.2015.08.002, 2015. a
Bini, A., Buoncristiani, J., Couterrand, S., Ellwanger, D., Felber, M., Florineth, D., Graf, H., Keller, O., Kelly, M., and Schlüchter, C.: Die Schweiz während des letzteiszeitlichen Maximums (LGM), Bundesamt für Landestopografie swisstopo, Bern-Wabern, Switzerland, 2009. a
Blaser, P., Gubler, T., Küpfer, T., Marschall, P., Matter, A., Matyas, J., Meier, B., Müller, W., Schlanke, S., Schlunegger, F., Siber, N., and Wyss, E.: Geothermiebohrung Bassersdorf. Charakterisierung der Oberen Meeresmolasse und Unteren Süsswassermolasse, Tech. Rep. NTB 94-01, Nagra, Wettingen, Switzerland, 1994. a, b
Bolliger, T., Fejfar, O., Graf, H., and Kälin, D.: Vorläufige Mitteilung über Funde von pliozänen Kleinsäugern aus den höheren Deckenschottern des Irchels (Kt. Zürich), Eclogae Geol. Helv., 89, 1043–1048, 1996. a, b
Boulton, G., Dobbie, K., and Zatsepin, S.: Sediment deformation beneath glaciers and its coupling to the subglacial hydraulic system, Quatern. Int., 86, 3–28, https://doi.org/10.1016/S1040-6182(01)00048-9, 2001. a, b, c
Bouma, A. H.: Sedimentology of Some Flysch Deposits: a Graphic Approach to Facies Interpretation, Elsevier, Amsterdam, the Netherlands, 1962. a, b, c
Brauer, A., Allen, J. R., Mingram, J., Dulski, P., Wulf, S., and Huntley, B.: Evidence for last interglacial chronology and environmental change from Southern Europe, P. Natl. Acad. Sci. USA, 104, 450–455, https://doi.org/10.1073/pnas.0603321104, 2007. a
Broster, B.: Glacitectonic deformation in sediment and bedrock, Hat Creek, British Columbia, Geogr. Phys. Quatern., 45, 5–20, 1991. a
Buechi, M. W., Frank, S. M., Graf, H. R., Menzies, J., and Anselmetti, F. S.: Subglacial emplacement of tills and meltwater deposits at the base of overdeepened bedrock troughs, Sedimentology, 64, 658–685, https://doi.org/10.1111/sed.12319, 2017. a, b, c, d
Buylaert, J. P., Murray, A. S., Thomsen, K. J., and Jain, M.: Testing the potential of an elevated temperature IRSL signal from K-feldspar, Radiat. Meas., 44, 560–565, https://doi.org/10.1016/j.radmeas.2009.02.007, 2009. a, b, c, d
Clark, P. U., Archer, D., Pollard, D., Blum, J. D., Rial, J. A., Brovkin, V., Mix, A. C., Pisias, N. G., and Roy, M.: The middle Pleistocene transition: characteristics, mechanisms, and implications for long-term changes in atmospheric pCO2, Quaternary Sci. Rev., 25, 3150–3184, https://doi.org/10.1016/j.quascirev.2006.07.008, 2006. a
Claude, A., Akçar, N., Ivy-Ochs, S., Schlunegger, F., Kubik, P. W., Christl, M., Vockenhuber, C., Kuhlemann, J., Rahn, M., and Schlüchter, C.: Changes in landscape evolution patterns in the northern Swiss Alpine Foreland during the mid-Pleistocene revolution, GSA Bulletin, 131, 2056–2078, https://doi.org/10.1130/B31880.1, 2019. a
Cook, S. J. and Swift, D. A.: Subglacial basins: Their origin and importance in glacial systems and landscapes, Earth-Sci. Rev., 115, 332–372, https://doi.org/10.1016/j.earscirev.2012.09.009, 2012. a
de Beaulieu, J.-L., Andrieu-Ponel, V., Reille, M., Grüger, E., Tzedakis, C., and Svobodova, H.: An attempt at correlation between the Velay pollen sequence and the Middle Pleistocene stratigraphy from central Europe, Quaternary Sci. Rev., 20, 1593–1602, https://doi.org/10.1016/S0277-3791(01)00027-0, 2001. a
Dehnert, A., Preusser, F., Kramers, J. D., Akçar, N., Kubik, P. W., Reber, R., and Schlüchter, C.: A multi-dating approach applied to proglacial sediments attributed to the Most Extensive Glaciation of the Swiss Alps, Boreas, 39, 620–632, https://doi.org/10.1111/j.1502-3885.2010.00146.x, 2010. a, b
Dreimanis, A.: Tills: their genetic terminology and classification, in: Genetic classification of glacigenic deposits, edited by: Goldthwait, R. P. and Matsch, C. L., Balkema, Rotterdam, the Netherlands, 17–84, 1989. a
Duller, G. A.: Single grain optical dating of glacigenic deposits, Quat. Geochronol., 1, 296–304, https://doi.org/10.1016/j.quageo.2006.05.018, 2006. a
Durcan, J. A., King, G. E., and Duller, G. A.: DRAC: Dose Rate and Age Calculator for trapped charge dating, Quat. Geochronol., 28, 54–61, https://doi.org/10.1016/j.quageo.2015.03.012, 2015. a, b
Dürst Stucki, M. and Schlunegger, F.: Identification of erosional mechanisms during past glaciations based on a bedrock surface model of the central European Alps, Earth Planet. Sc. Lett., 384, 57–70, https://doi.org/10.1016/j.epsl.2013.10.009, 2013. a, b, c
Dürst Stucki, M., Reber, R., and Schlunegger, F.: Subglacial tunnel valleys in the Alpine foreland: An example from Bern, Switzerland, Swiss J. Geosci., 103, 363–374, https://doi.org/10.1007/s00015-010-0042-0, 2010. a
Ehlers, J., Gibbard, P. L., and Hughes, P. D.: Quaternary Glaciations – Extent and Chronology – A Closer Look, vol. 15 of Developments in Quaternary Sciences, Elsevier, 1st edn., https://doi.org/10.1016/C2009-0-20217-0, 2011. a, b
Ehlers, J., Gibbard, P., and Hughes, P.: Quaternary Glaciations and Chronology, in: Past Glacial Environments, edited by: Menzies, J. and van der Meer, J. J., 2nd edn., Elsevier, 77–101, https://doi.org/10.1016/B978-0-08-100524-8.00003-8, 2018. a, b
Eijkelkamp: 14.10 Pocket vane tester. Operating instructions, Eijkelkamp Agrisearch Equipment, Giesbeek, the Netherlands, 2012. a
Evans, D. J. A., Phillips, E. R., Hiemstra, J. F., and Auton, C. A.: Subglacial till: formation, sedimentary characteristics and classification, Earth-Sci. Rev., 78, 115–176, https://doi.org/10.1016/j.earscirev.2006.04.001, 2006. a, b
Fabbri, S. C., Buechi, M. W., Horstmeyer, H., Hilbe, M., Hübscher, C., Schmelzbach, C., Weiss, B., and Anselmetti, F. S.: A subaquatic moraine complex in overdeepened Lake Thun (Switzerland) unravelling the deglaciation history of the Aare Glacier, Quaternary Sci. Rev., 187, 62–79, https://doi.org/10.1016/j.quascirev.2018.03.010, 2018. a
Fiebig, M. and Preusser, F.: Pleistocene glaciations of the northern Alpine Foreland, Geogr. Helv., 63, 145–150, https://doi.org/10.5194/gh-63-145-2008, 2008. a
Fitzsimons, S. and Howarth, J.: Glaciolacustrine Processes, in: Past Glacial Environments, edited by Menzies, J. and van der Meer, J. J., 2nd edn., Elsevier, 309–334, https://doi.org/10.1016/B978-0-08-100524-8.00009-9, 2018. a, b, c
Gaar, D., Lowick, S. E., and Preusser, F.: Performance of different luminescence approaches for the dating of known-age glaciofluvial deposits from Northern Switzerland, Geochronometria, 41, 65–80, https://doi.org/10.2478/s13386-013-0139-0, 2014. a
Galbraith, R., Roberts, R., and Yoshida, H.: Error variation in OSL palaeodose estimates from single aliquots of quartz: a factorial experiment, Radiat. Meas., 39, 289–307, https://doi.org/10.1016/j.radmeas.2004.03.023, 2005. a
Galbraith, R. F. and Roberts, R. G.: Statistical aspects of equivalent dose and error calculation and display in OSL dating: An overview and some recommendations, Quat. Geochronol., 11, 1–27, https://doi.org/10.1016/j.quageo.2012.04.020, 2012. a, b
Garefalakis, P. and Schlunegger, F.: Tectonic processes, variations in sediment flux, and eustatic sea level recorded by the 20 Myr old Burdigalian transgression in the Swiss Molasse basin, Solid Earth, 10, 2045–2072, https://doi.org/10.5194/se-10-2045-2019, 2019. a
Geologiebüro Kellerhals, Häfeli AG, and Staeger, D.: Blatt 1166 Bern. Geol. Atlas Schweiz 1 : 25 000, Karte 100, Bern-Wabern, Switzerland, 2000. a
Graf, A., Akc, N., Strasky, I.-o. S., Kubik, P. W., Christl, M., Burkhard, M., Wieler, R., and Schlüchter, C.: Multiple advances of Alpine glaciers into the Jura Mountains in the Northwestern Switzerland, Swiss J. Geosci., 108, 225–238, https://doi.org/10.1007/s00015-015-0195-y, 2015. a
Haeuselmann, P., Fiebig, M., Kubik, P. W., and Adrian, H.: A first attempt to date the original “Deckenschotter” of Penck and Brückner with cosmogenic nuclides, Quatern. Int., 164-165, 33–42, https://doi.org/10.1016/j.quaint.2006.12.013, 2007a. a
Haeuselmann, P., Granger, D. E., Jeannin, P. Y., and Lauritzen, S. E.: Abrupt glacial valley incision at 0.8 Ma dated from cave deposits in Switzerland, Geology, 35, 143–146, https://doi.org/10.1130/G23094A, 2007b. a
Hart, J. K. and Boulton, G. S.: The interrelation of glaciotectonic and glaciodepositional processes within the glacial environment, Quaternary Sci. Rev., 10, 335–350, https://doi.org/10.1016/0277-3791(91)90035-S, 1991. a
Heim, A.: Handbuch der Gletscherkunde, J. Engelhorn, Stuttgart, Germany, 1885. a
Hornung, J. J., Asprion, U., and Winsemann, J.: Jet-efflux deposits of a subaqueous ice-contact fan, glacial Lake Rinteln, northwestern Germany, Sediment. Geol., 193, 167–192, https://doi.org/10.1016/j.sedgeo.2005.11.024, 2007. a
Huntley, D. J. and Lamothe, M.: Ubiquity of anomalous fading in K-feldspars and the measurement and correction for it in optical dating, Can. J. Earth Sci., 38, 1093–1106, https://doi.org/10.1139/cjes-38-7-1093, 2001. a
Institut für Geologie, Universität Bern and Bundesamt für Wasser und Geologie: Geologische Karte der Schweiz 1 : 500 000 = Carte géologique de la Suisse 1 : 500 000, Bern-Ittigen, Switzerland, 2005. a
Isler, A.: Erläuterungen zum geologischen Atlas der Schweiz 1 : 25 000, Blatt Bern 1166, Bern-Ittigen, Switzerland, 2005. a, b, c
Iverson, R. M.: The physics of debris flows, Rev. Geophys., 35, 245–296, https://doi.org/10.1029/97RG00426, 1997. a, b
Ivy-Ochs, S., Kerschner, H., Reuther, A., Preusser, F., Heine, K., Maisch, M., Kubik, P. W., and Schlüchter, C.: Chronology of the last glacial cycle in the European Alps, J. Quaternary Sci., 23, 559–573, https://doi.org/10.1002/jqs.1202, 2008. a
Jacobs, Z., Duller, G. A., Wintle, A. G., and Henshilwood, C. S.: Extending the chronology of deposits at Blombos Cave, South Africa, back to 140 ka using optical dating of single and multiple grains of quartz, J. Hum. Evol., 51, 255–273, https://doi.org/10.1016/j.jhevol.2006.03.007, 2006. a
Jordan, P.: Analysis of overdeepened valleys using the digital elevation model of the bedrock surface of Northern Switzerland, Swiss J. Geosci., 103, 375–384, https://doi.org/10.1007/s00015-010-0043-z, 2010. a
Kars, R. H., Wallinga, J., and Cohen, K. M.: A new approach towards anomalous fading correction for feldspar IRSL dating - tests on samples in field saturation, Radiat. Meas., 43, 786–790, https://doi.org/10.1016/j.radmeas.2008.01.021, 2008. a, b, c, d
Keller, O. and Krayss, E.: Mittel- und spätpleistozäne Stratigraphie und Morphogenese in Schlüsselregionen der Nordschweiz, Quaternary Sci. J., 59, 88–119, https://doi.org/10.3285/eg.59.1-2.08, 2010. a
King, G. E., Burow, C., Roberts, H. M., and Pearce, N. J.: Age determination using feldspar: evaluating fading-correction model performance, Radiation Measurements, 119, 58–73, https://doi.org/10.1016/j.radmeas.2018.07.013, 2018. a
Knudsen, M. F., Nørgaard, J., Grischott, R., Kober, F., Egholm, D. L., Hansen, T. M., and Jansen, J. D.: New cosmogenic nuclide burial-dating model indicates onset of major glaciations in the Alps during Middle Pleistocene Transition, Earth Planet. Sc. Lett., 549, 116491, https://doi.org/10.1016/j.epsl.2020.116491, 2020. a
Koutsodendris, A., Pross, J., Müller, U. C., Brauer, A., Fletcher, W. J., Kühl, N., Kirilova, E., Verhagen, F. T., Lücke, A., and Lotter, A. F.: A short-term climate oscillation during the Holsteinian interglacial (MIS 11c): An analogy to the 8.2ka climatic event?, Global Planet. Chang., 92–93, 224–235, https://doi.org/10.1016/j.gloplacha.2012.05.011, 2012. a, b
Kreutzer, S., Schmidt, C., Fuchs, M., Dietze, M., Fischer, M., and Fuchs, M.: Introducing an R package for luminescence dating analysis, Ancient TL, 30, 1–8, available at: http://ancienttl.org/ATL_30-1_2012/ATL_30-1_Kreutzer_p1-8.pdf (last access: 24 June 2021), 2012. a, b, c
Krüger, J. and Kjær, K. H.: A data chart for field description and genetic interpretation of glacial diamicts and associated sediments - with examples from Greenland, Iceland, and Denmark, Boreas, 28, 386–402, https://doi.org/10.1111/j.1502-3885.1999.tb00228.x, 1999. a
Kühni, A. and Pfiffner, O.: The relief of the Swiss Alps and adjacent areas and its relation to lithology and structure: topographic analysis from a 250-m DEM, Geomorphology, 41, 285–307, https://doi.org/10.1016/S0169-555X(01)00060-5, 2001. a
Lang, J., Sievers, J., Loewer, M., Igel, J., and Winsemann, J.: 3D architecture of cyclic-step and antidune deposits in glacigenic subaqueous fan and delta settings: Integrating outcrop and ground-penetrating radar data, Sediment. Geol., 362, 83–100, https://doi.org/10.1016/j.sedgeo.2017.10.011, 2017. a
Lang, J., Le Heron, D. P., Van den Berg, J. H., and Winsemann, J.: Bedforms and sedimentary structures related to supercritical flows in glacigenic settings, Sedimentology, 68, 1539–1579, https://doi.org/10.1111/sed.12776, 2021. a
Li, B., Jacobs, Z., Roberts, R., and Li, S.-H.: Review and assessment of the potential of post-IR IRSL dating methods to circumvent the problem of anomalous fading in feldspar luminescence, Geochronometria, 41, 178–201, https://doi.org/10.2478/s13386-013-0160-3, 2014. a
Lisiecki, L. E.: Links between eccentricity forcing and the 100,000-year glacial cycle, Nat. Geosci., 3, 349–352, https://doi.org/10.1038/ngeo828, 2010. a
Lisiecki, L. E. and Raymo, M. E.: A Pliocene-Pleistocene stack of 57 globally distributed benthic δ18O records, Paleoceanography, 20, PA1003, https://doi.org/10.1029/2004PA001071, 2005. a
Lønne, I.: Sedimentary facies and depositional architecture of ice-contact glaciomarine systems, Sediment. Geol., 98, 13–43, https://doi.org/10.1016/0037-0738(95)00025-4, 1995. a, b, c, d, e, f
Lowe, D. R.: Sediment gravity flows; II, Depositional models with special reference to the deposits of high-density turbidity currents, J. Sediment. Res., 52, 279–297, https://doi.org/10.1306/212F7F31-2B24-11D7-8648000102C1865D, 1982. a, b
Lowick, S. E., Trauerstein, M., and Preusser, F.: Testing the application of post IR-IRSL dating to fine grain waterlain sediments, Quat. Geochronol., 8, 33–40, https://doi.org/10.1016/j.quageo.2011.12.003, 2012. a
Matter, A.: Sedimentologische Untersuchungen im östlichen Napfgebiet, Eclogae Geol. Helv., 57, 315–428, https://doi.org/10.5169/seals-163142, 1964. a
Meichtry, N.: Last Deglaciation of the Aare Valley, Master's thesis, Instiute of Geological Science, University of Bern, Bern, Switzerland, 2016. a
Miall, A. D.: Architectural-element analysis: a new method of facies analysis applied to fluvial deposits, Earth-Sci. Rev., 22, 261–308, https://doi.org/10.1016/0012-8252(85)90001-7, 1985. a, b
Moore, P. D., Webb, J. A., and Collison, M. E.: Pollen analysis, Blackwell scientific publications, Oxford, UK, 1991. a, b
Mulder, T. and Alexander, J.: The physical character of subaqueous sedimentary density flows and their deposits, Sedimentology, 48, 269–299, https://doi.org/10.1046/j.1365-3091.2001.00360.x, 2001. a, b, c, d, e, f, g, h, i, j, k, l, m
Murray, A. S. and Wintle, A. G.: Luminescence dating of quartz using an improved single-aliquot regenerative-dose protocol, Radiat. Meas., 32, 57–73, https://doi.org/10.1016/S1350-4487(99)00253-X, 2000. a, b
NASA/METI/AIST/Japan Spacesystems and U.S./Japan ASTER Science Team: ASTER Global Digital Elevation Model V003, https://doi.org/10.5067/ASTER/ASTGTM.003, 2019. a
Nemec, W.: Aspects of sediment movement on steep delta slopes, in: Coarse-grained deltas, edited by: Colella, A. and Prior, D., vol. 10 of International Association of Sedimentologists Special Publication, Blackwell Scientific Publications, Oxford, UK, 29–73, 1990. a, b
Nemec, W., Lønne, I., and Blikra, L. H.: The Kregnes moraine in Gauldalen, west-central Norway: anatomy of a Younger Dryas proglacial delta in a palaeofjord basin, Boreas, 28, 454–476, https://doi.org/10.1111/j.1502-3885.1999.tb00234.x, 1999. a
Parker, G., Fukushima, Y., and Pantin, H. M.: Self-accelerating turbidity currents, J. Fluid Mech., 171, 145–181, https://doi.org/10.1017/S0022112086001404, 1986. a, b
Penck, A. and Brückner, E.: Die Alpen im Eiszeitalter, Tauchnitz, Leipzig, Germany, 1909. a, b
Phillips, E.: Glacitectonics, in: Past Glacial Environments, edited by: Menzies, J. and van der Meer, J. J., 2nd edn., Elsevier, 467–502, https://doi.org/10.1016/B978-0-08-100524-8.00014-2, 2018. a, b, c
Phillips, E., Evans, D., and Auton, C.: Polyphase deformation at an oscillating ice margin following the Loch Lomond Readvance, central Scotland, UK, Sediment. Geol., 149, 157–182, https://doi.org/10.1016/S0037-0738(01)00250-0, 2002. a
Platt, N. H. and Keller, B.: Distal alluvial deposits in a foreland basin setting – the Lower Freshwater Miocene), Switzerland: sedimentology, architecture and palaeosols, Sedimentology, 39, 545–565, https://doi.org/10.1111/j.1365-3091.1992.tb02136.x, 1992. a, b, c
Plink-Björklund, P.: Depositional processes and internal architecture of Late Weichselian ice-margin submarine fan and delta settings, Swedish west coast, Sedimentology, 46, 215–234, https://doi.org/10.1046/j.1365-3091.1999.00195.x, 1999. a
Postma, G.: Depositional architecture and facies of river and fan deltas: a synthesis, in: Coarse-grained deltas, edited by: Colella, A. and Prior, D., vol. 10 of International Association of Sedimentologists Special Publication, Blackwell Scientific Publications, Oxford, UK, 13–27, 1990. a, b, c, d
Powell, R. D.: Glacimarine processes at grounding-line fans and their growth to ice-contact deltas, Geological Society, London, Special Publications, 53, 53–73, https://doi.org/10.1144/GSL.SP.1990.053.01.03, 1990. a
Preusser, F. and Schlüchter, C.: Dates from an important early Late Pleistocene ice advance in the Aare valley, Switzerland, Eclogae Geol. Helv., 97, 245–253, https://doi.org/10.1007/s00015-004-1119-4, 2004. a, b, c, d, e, f
Preusser, F., Drescher-Schneider, R., Fiebig, M., and Schlüchter, C.: Re-interpretation of the Meikirch pollen record, Swiss Alpine Foreland, and implications for Middle Pleistocene chronostratigraphy, J. Quaternary Sci., 20, 607–620, https://doi.org/10.1002/jqs.930, 2005. a, b, c, d, e, f, g, h
Preusser, F., Reitner, J. M., and Schlüchter, C.: Distribution, geometry, age and origin of overdeepened valleys and basins in the Alps and their foreland, Swiss J. Geosci., 103, 407–426, https://doi.org/10.1007/s00015-010-0044-y, 2010. a
Preusser, F., Graf, H., Keller, O., Krayss, E., and Schlüchter, C.: Quaternary glaciation history of northern Switzerland, Quaternary Sci. J., 60, 282–305, https://doi.org/10.3285/eg.60.2-3.06, 2011. a, b
Reber, R. and Schlunegger, F.: Unravelling the moisture sources of the Alpine glaciers using tunnel valleys as constraints, Terra Nova, 28, 202–211, https://doi.org/10.1111/ter.12211, 2016. a, b, c, d, e, f
Reille, M.: Pollen et spores d'Europe et d'Afrique du Nord, Laboratoire de Botanique historique et Palynologie, Marseille, France, 1992. a
Rose, J. and Menzies, J.: 15 – Glacial stratigraphy, in: Modern and Past Glacial Environments, edited by: Menzies, J., Butterworth-Heinemann, Oxford, UK, 445–473, https://doi.org/10.1016/B978-075064226-2/50018-0, 2002. a
Rosenblume, J. A. and Powell, R. D.: Glacial sequence stratigraphy of ANDRILL-1B core reveals a dynamic subpolar Antarctic Ice Sheet in Ross Sea during the late Miocene, Sedimentology, 66, 2072–2097, https://doi.org/10.1111/sed.12592, 2019. a
Ruddiman, W., Raymo, M. E., and McIntyre, A.: Matuyama 41,000-year cycles: North Atlantic Ocean and northern hemisphere ice sheets, Earth Planet. Sc. Lett., 80, 117–129, https://doi.org/10.1016/0012-821X(86)90024-5, 1986. a
Rust, B. R.: Depositional models for braided alluvium, in: Fluvial Sedimentology, eidted by: Miall, A. D., Canadian Society of Petroleum Geologists, Memoirs, 5, 605–625, 1978. a
Schlüchter, C.: The most complete quaternary record of the Swiss Alpine Foreland, Palaeogeogr. Palaeocl., 72, 141–146, https://doi.org/10.1016/0031-0182(89)90138-7, 1989. a, b, c, d, e
Schlüchter, C.: The Swiss glacial record – a schematic summary, Developments in Quaternary Science, 2, 413–418, https://doi.org/10.1016/S1571-0866(04)80092-7, 2004. a
Schultheiss, P. and Weaver, P.: Multi-sensor Core Logging For Science And Industry, in: OCEANS 92 Proceedings@m_Mastering the Oceans Through Technology, vol. 2, 608–613, 1992. a
Schwenk, M. A., Schlunegger, F., Gribenski, N., Schläfli, P., Bandou, D., Douillet, G. A., and Krbanjevic, J.: Stratigraphic and Multi Scanner Core Logging (MSCL) data plus supplementary luminescence dating material obtained from the scientific drilling QDR-RE-IfG and its drill site in the Aare Valley, Bern CH, GFZ Data Services [data set], https://doi.org/10.5880/fidgeo.2021.021, 2021. a, b
Stockmarr, J.: Tabletes with spores used in absolute pollen analysis, Pollen spores, 13, 615–621, 1971. a
Sutherland, J. L., Carrivick, J. L., Shulmeister, J., Quincey, D. J., and James, W. H.: Ice-contact proglacial lakes associated with the last glacial maximum across the Southern Alps, New Zealand, Quaternary Sci. Rev., 213, 67–92, https://doi.org/10.1016/j.quascirev.2019.03.035, 2019. a, b
Valla, P. G., Shuster, D. L., and Van Der Beek, P. A.: Significant increase in relief of the European Alps during mid-Pleistocene glaciations, Nat. Geosci., 4, 688–692, https://doi.org/10.1038/ngeo1242, 2011. a
van der Wateren, D. M.: Processes of glaciotectonism, in: Modern and Past Glacial Environments, Elsevier, 417–443, https://doi.org/10.1016/B978-075064226-2/50017-9, 2002. a
Welten, M.: Pollenanalytische Untersuchungen im Jüngeren Quartär des nördlichen Alpenvorlandes der Schweiz, Beiträge zur Geologischen Karte der Schweiz – Neue Folge, Schweizerischen Geologischen Kommission, Bern, 156, 210 pp., 1982. a, b, c, d, e, f
Welten, M.: Neue pollenanalytische Ergebnisse über das Jüngere Quartär des nördlichen Alpenvorlandes der Schweiz (Mittel- und Jungpleistozän), Beiträge zur Geologischen Karte der Schweiz – Neue Folge, Schweizerischen Geologischen Kommission, Bern, 162, 52 pp., 1988. a, b, c, d, e, f
Winsemann, J., Lang, J., Polom, U., Loewer, M., Igel, J., Pollok, L., and Brandes, C.: Ice-marginal forced regressive deltas in glacial lake basins: geomorphology, facies variability and large-scale depositional architecture, Boreas, 47, 973–1002, https://doi.org/10.1111/bor.12317, 2018. a, b
Wintle, A. G. and Murray, A. S.: A review of quartz optically stimulated luminescence characteristics and their relevance in single-aliquot regeneration dating protocols, Radiat. Meas., 41, 369–391, https://doi.org/10.1016/j.radmeas.2005.11.001, 2006. a, b
Wüthrich, L., Morabito, E. G., Zech, J., Trauerstein, M., Veit, H., Gnägi, C., Merchel, S., Scharf, A., Rugel, G., Christl, M., and Zech, R.: 10Be surface exposure dating of the last deglaciation in the Aare Valley, Switzerland, Swiss J. Geosci., 111, 295–303, https://doi.org/10.1007/s00015-018-0298-3, 2018. a
- Abstract
- Introduction
- Geological setting
- Previous scientific drilling in the MAV
- Site survey and drilling
- Methods
- Results
- Interpretation
- Discussion
- Conclusions
- Appendix A: Lithofacies description and interpretation
- Appendix B: Optically stimulated luminescence dating
- Code and data availability
- Author contributions
- Competing interests
- Disclaimer
- Acknowledgements
- Financial support
- Review statement
- References