 | 25 Feb 2022
Ship-board determination of whole-rock (ultra-)trace element concentrations by laser ablation-inductively coupled plasma mass spectrometry analysis of pressed powder pellets aboard the D/V Chikyu
Fatma Kourim
Akihiro Tamura
Eiichi Takazawa
Manolis Giampouras
Sayantani Chatterjee
Keisuke Ishii
Matthew J. Cooper
Marguerite Godard
Elliot Carter
Natsue Abe
Kyaw Moe
Damon A. H. Teagle
The Oman Drilling Project (OmanDP), performed under the International Continental Scientific Drilling Program (ICDP), is an international scientific research project that undertook drilling at a range of sites in the Semail ophiolite (Oman) to collect core samples spanning the stratigraphy of the ophiolite, from the upper oceanic crust down to the basal thrust. The cores were logged to International Ocean Discovery Program (IODP) standards aboard the D/V Chikyu. During ChikyuOman2018 Leg 3 (July–August 2018), participants described cores from the crust–mantle transition (CM) sites. The main rock types recovered at these sites were gabbros, dunites and harzburgites, rocks typically forming the base of the oceanic crust and the shallow mantle beneath present-day spreading centres. In addition to the core description, selected samples were analysed by X-ray fluorescence spectrometry (XRF) for their chemical compositions, including major, minor and some trace elements. To complement these standard procedures, we developed new approaches to measure ultra-trace element concentrations using a procedure adapted from previous works to prepare fine-grained pressed powder pellets coupled with laser ablation-inductively coupled plasma mass spectrometry (LA-ICP-MS) analysis using instrumentation aboard the D/V Chikyu. First, three (ultra)mafic reference materials were investigated to test and validate our procedure (BHVO-2, BIR-1a and JP-1), and then the procedure was applied to a selection of gabbro and dunite samples from the CM cores to explore the limitations of the method in its current stage of development. The obtained results are in good agreement with preferred values for the reference materials and with subsequent solution replicate analyses of the same samples performed in shore-based laboratories following Leg 3 for the CM samples. We describe this procedure for the determination of 37 minor and (ultra-)trace elements (transition elements and Ga, Li and Large-Ion Lithophile Elements (LILE), Rare Earth Elements (REE), High-Field-Strength Elements (HFSE), U, Th, and Pb) in mafic and ultramafic rocks. The presented method has the major advantage that it allows the determination at sea of the (ultra-)trace element concentrations in a “dry”, safe way, without using acid reagents. Our new approach could be extended for other elements of interest and/or be improved to be adapted to other rock materials during future ocean drilling operations aboard the D/V Chikyu and other platforms.
- Article
(8295 KB) - Full-text XML
-
Supplement
(101 KB) - BibTeX
- EndNote


1.1 Context of the study: the ICDP Oman Drilling Project
Project Mohole was initiated more than 60 years ago, beginning in 1961 initiating several scientific ocean drilling expeditions with the ultimate goal of drilling through the entire oceanic crust and the crust–mantle transition or Moho, to finally reach the Earth's sub-oceanic upper mantle. Despite major improvement in drilling technology (drill ships and equipment) over the past decades, this target has yet to be achieved, and the drilling of a 5 to 6 km-thick oceanic crust accreted in a fast-spreading environment remains a key challenge for present and future generations of Earth scientists. Until 2018, only 20 holes were drilled deeper than 200 m in the oceanic lithosphere igneous basement, with variable core recoveries, which clearly illustrates the major difficulty in reaching such depths by ocean drilling (Michibayashi et al., 2019, and references therein).
In this context, accessing the rocks forming the deep oceanic crust and sub-oceanic mantle is easier through the study of ophiolites, remnants of a former oceanic lithosphere displaced on-land through tectonic plate rearrangements (Anonymous, 1972; Coleman, 1971, 1977; Dilek, 2003, and references therein). To avoid the difficulties of drilling deep hard rocks in present-day oceans, a project to drill the different units of the Semail ophiolite (Sultanate of Oman and the United Arab Emirates) was designed in the early 2010s (Kelemen et al., 2013), since this ophiolite is one of the largest and best preserved on Earth and since all the layers expected to constitute an ideal portion of a fast-spreading oceanic lithosphere are exposed with their original stratigraphy relatively well preserved (e.g. Boudier and Nicolas, 1985; Glennie et al., 1974; Hopson et al., 1981; Lippard et al., 1986). The Oman Drilling Project (OmanDP), implemented by the International Continental Scientific Drilling Program (ICDP), materialized with the drilling operations conducted during the winters 2016 (December 2016–March 2017) for Phase 1 and 2017 (November 2017–February 2018) for Phase 2 (https://www.omandrilling.ac.uk/drilling-program, last access: 27 August 2021; see the Proceedings of the Oman Drilling Project: http://publications.iodp.org/other/Oman/OmanDP.html, last access: 27 August 2021). Following these operations, the cores were moved to Japan for description on-board the drilling vessel (D/V) Chikyu during two intensive 60 d core characterization campaigns under an IODP–ICDP joint collaboration during the summers 2017 and 2018 (ChikyuOman2017 and ChikyuOman2018), with each ship-board campaign subdivided into two legs (2017: Legs 1 and 2; 2018: Legs 3 and 4).
1.2 Target of the study: to safely determine (ultra-)trace element concentrations at sea
The D/V Chikyu is operated by the IODP Japanese implementing organization Centre for Deep Earth Exploration (CDEX) of the Japan Agency for Marine-Earth Science and Technology (JAMSTEC). It was specifically designed for deep-sea drilling and is equipped with several laboratory facilities, including a sample preparation room and a geochemistry laboratory. The latter is equipped with an X-ray fluorescence spectrometer (XRF) and an inductively coupled plasma-mass spectrometer (ICP-MS) for on-board chemical analyses. The determination of trace element concentrations at sea, using the installed ICP-MS, was made for the first time during the ChikyuOman2017 campaign (Legs 1 and 2). The sample preparation procedure has consisted of a mixed acid/alkali-fusion digestion procedure using perchloric and hydrofluoric acids (Senda et al., 2014; see also Kelemen et al., 2020). However, the members of the geochemistry team were concerned by the hazards related to the use of such acid reagents on-board an oceanographic vessel, especially during open ocean operations. Consequently, to address safety concerns during future ocean drilling operations, it was decided to plan for the development of a “dry” sample preparation and analytical method for the determination of the (ultra-)trace element contents in whole-rock samples during the ChikyuOman2018 campaign (Legs 3 and 4).
The principle was to analyse pressed powder pellets using the newly installed laser ablation system coupled to the on-board ICP-MS (LA-ICP-MS). During Leg 3, the sample preparation procedure was adapted from Garbe-Schönberg and Müller (2014) that described the ablation of powder pellets prepared without a binder. Generally, pressed powder pellets are prepared with a binder (e.g. Arrowsmith, 1987; Gray, 1985; Van Heuzen, 1991; Imai, 1990; Mukherjee et al., 2014; Peters and Pettke, 2017; Zhu et al., 2013), while other authors also described the ablation of fused glass beads as another acid-free technique (e.g. Akizawa et al., 2020; Eggins, 2003; Kon et al., 2011; Kon and Hirata, 2015; Tamura et al., 2015). A requirement was to prepare pellets smaller than the ones prepared for XRF analyses to be better adapted to the size/volume of the laser ablation sample cell. It was also critical to prepare these pellets from powder with an average powder grain size much smaller than the maximum laser spot size that could be set (e.g. Garbe-Schönberg and Müller, 2014; Peters and Pettke, 2017). This new sample preparation and instrument parametrization method (described in Sect. 2) was first tested by analysing three reference materials and then applied to a selection of gabbro and dunite samples from the OmanDP CM1A cores (CM for crust–mantle transition). As discussed below (Sect. 3), analyses of both standard reference materials and of unknown samples compare well with literature values and replicate analyses of the same samples analysed in shore-based laboratories after Leg 3, respectively. The current limitations and possible future improvements of both the presented method and the surrounding analytical environment on-board the D/V Chikyu are discussed in Sect. 4.
2.1 Overview of the materials and analytical methods
Over two drilling seasons, the Oman Drilling Project drilled a suite of 15 holes (nine diamond-cored and six rotary-drilled boreholes) distributed across 10 sites (Kelemen et al., 2021c; https://www.omandrilling.ac.uk/drilling-program, last access: 27 August 2021; the proceedings are available at: http://publications.iodp.org/other/Oman/OmanDP.html, last access: 27 August 2021). The ChikyuOman2018 Leg 3 science team focused on the characterization of Holes CM1A (400 m) and CM2B (300 m) that cored continuously (∼ 100 % recovery) the Oman ophiolite crust–mantle transition (Kelemen et al., 2021a, b). The sample selection has been conducted in two ways. Firstly, during the on-site operations in Oman, samples were systematically collected every 10 m along the OmanDP CM cores. Then, during Leg 3, additional ship-board samples were collected to complete the general, detailed overview of the cores. Samples collected on-site were milled at the University of Southampton (UK) prior to Leg 3 and the powders sent to the D/V Chikyu for on-board analyses; ship-board samples collected during Leg 3 were sawed and milled directly aboard the D/V Chikyu.
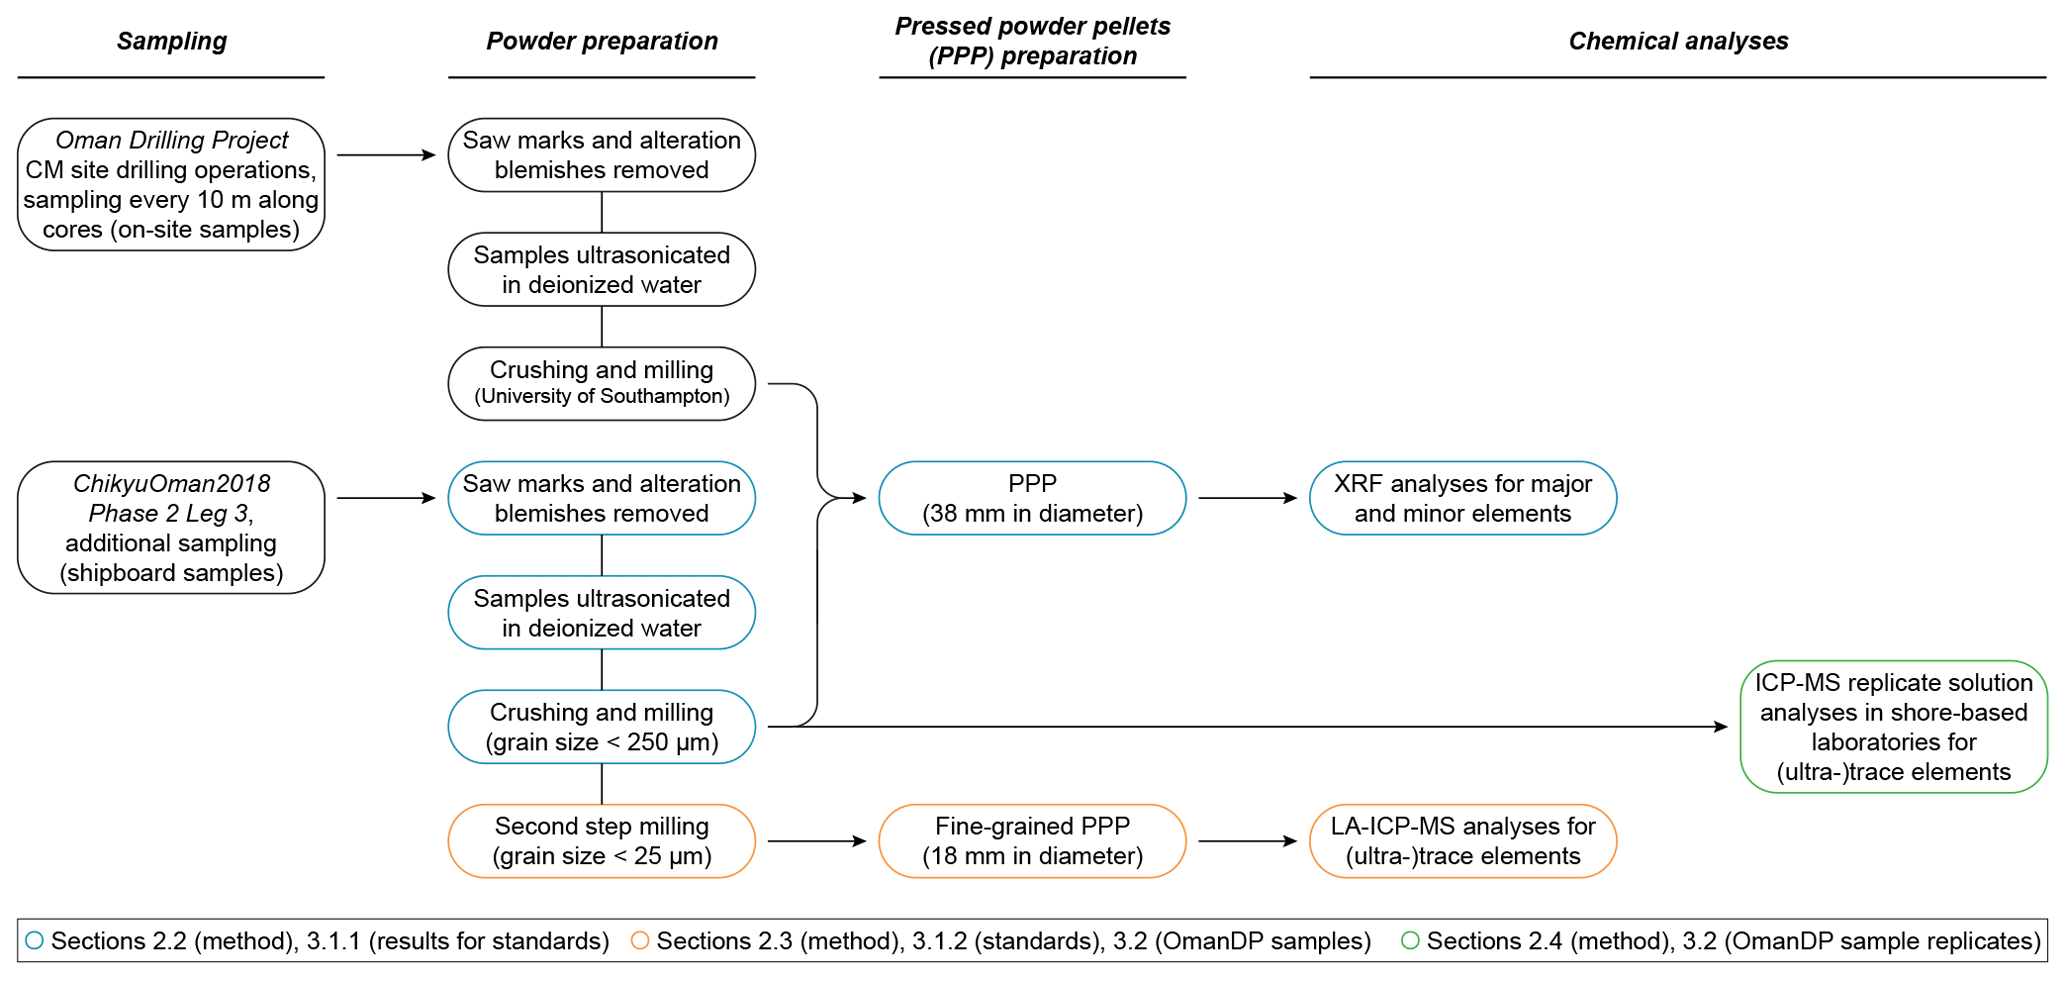
Figure 1Flow chart summarizing the different steps for sample preparation and chemical analyses.
In terms of chemical analyses performed during Leg 3, both on-site and ship-board samples were analysed by XRF for major, minor and some trace elements. For the development of a dry, safe method for the on-board determination of whole-rock (ultra-)trace element concentrations, we investigated the basalts BHVO-2 and BIR-1a (United States Geological Survey, USGS) and the peridotite JP-1 (Geological Survey of Japan, GSJ) as reference materials to test and validate the measurement precision of our procedure. The method was then applied to a selection of gabbro (crust) and dunite (crust–mantle transition) samples from Hole CM1A. These were all ship-board samples that were fully prepared during Leg 3 and analysed using the laser ablation method described and discussed below. Replicate solution analyses for these CM samples were performed following ChikyuOman2018 in different on-shore laboratories for the trace elements. The gabbro samples were analysed by ICP-MS at the University of Southampton. The dunite samples were analysed (ICP-MS) at the Institute of Earth Science, Academia Sinica at Taipei (Taiwan), and the Géosciences Environnement Toulouse laboratory, Université Toulouse III – Paul Sabatier (France). The different steps of the complete methodology are summarized in Fig. 1.
2.2 On-board chemical analysis by existing methods (XRF)
Ship-board samples, selected during the Leg 3 daily sampling meetings, were cut into thin slices to ease the crushing to a < 1 mm grit. Saw marks and alteration blemishes were removed by precision sawing. Sample pieces were first ultrasonicated in deionized water (18.2 MΩ cm) purified with a Milli-Q system (Millipore, Bedford, MA, USA®) for consecutive rounds until the Milli-Q water was clear and dried for 12 h at 60 ∘C. The samples were then crushed in four steps using a newly installed Jaw Crusher Retsch BB50. The four crushing steps started with a 14 mm jaw gap that was decreased in stages to 7, 4 and 1 mm. Between two samples, all parts of the crusher, including the steel jaws, have been disassembled and carefully cleaned using isopropanol. After the 14 and 7 mm crushing steps, samples were sieved at 250 µm and smaller particles that passed through were discarded to avoid possible cross-contamination with the previously crushed sample. The resulting < 1 mm crushed sample was then powdered using a Fritsch Pulverisette 5 planetary mill with agate grinding bowls (500 mL) and agate balls (13 small balls of 20 mm and 5 large balls of 30 mm in diameter). Grit samples were run at 200 rounds per minute (rpm) for 10 min and allowed to cool for 5 min four times. The obtained powder grain size was below 250 µm (verified by sieving). The agate grinding bowls and agate balls were cleaned with Milli-Q water and isopropanol after each run and decontaminated by milling pure quartz sand when changing between two samples.
The chemical analyses on-board the D/V Chikyu are usually performed by XRF on glass beads for the determination of major oxides (SiO2, TiO2, Al2O3, Fe2O3, MnO, MgO, CaO, Na2O, K2O, P2O5) and on pressed powder pellets for the determination of major and some minor to trace element contents (Sc, V, Cr, Co, Ni, Cu, Zn, Ga, Rb, Sr, Y, Zr, Nb, Ba). Here, we compare only the results obtained for these selected minor to trace elements following the analysis of pressed powder pellets to the concentrations obtained using the newly developed laser ablation-inductively coupled plasma mass spectrometry (LA-ICP-MS) method. To prepare pressed powder pellets for XRF analysis, 4 g of unignited powder was weighed and carefully placed into a 5 mm-high sample holder cut from a 38 mm diameter polypropylene pipe and pressed using a Spex SamplePrep 3630 X-Press. The press was set to ramp up to 15 t and held there for 20 s, followed by a gradational release of the pressure over 66 s.
The major and minor element concentrations were determined using a RIGAKU Supermini wavelength dispersive X-ray fluorescence spectrometer equipped with a 200 W Pd anode tube at 50 kV and 4 mA. The instrument was calibrated using either pre-prepared glass beads for the major elements or pressed pellets for the major and minor to trace elements, made from reference materials from the Geological Survey of Japan. Rock standards JA-1 (andesite), JA-2 (sanukitoid), JB-2 and JB-3 (basalts), JF-1 and JF-2 (feldspars), JG-1a (granodiorite), JG-2 (granite), JGb-1 and JGb-2 (gabbros), JH-1 (hornblendite), JP-1 (peridotite), JR-2 and JR-3 (rhyolites), and JSy-1 (syenite) were commonly used for both calibrations together with JG-1 (granodiorite) for the major elements only (Imai et al., 1995, 1999). An additional 3 : 1 mixture of JGb-2 and JP-1 was also prepared to fill a large (> 2000 ppm) gap in the calibration for Cr and Ni if only the stated standards are used. Cr and Ni are known to occur in high concentrations in mantle peridotites and are expected to be high in the harzburgites and dunites from the CM cores based on previous results for peridotites from the Oman ophiolite mantle section (e.g. Godard et al., 2000; Hanghøj et al., 2010).
2.3 On-board chemical analysis by the newly developed powder pellet method (LA-ICP-MS)
2.3.1 Sample preparation
The approach for the safe determination of whole-rock (ultra-)trace element concentrations on-board the D/V Chikyu was to analyse pressed powder pellets using the laser ablation system coupled to the ICP-MS. The maximum laser spot size was 100 µm for the used instrumentation. It was therefore critical to prepare new pellets from powder with an average powder grain size much smaller than this maximum spot size (e.g. Garbe-Schönberg and Müller, 2014; Peters and Pettke, 2017). Following the first stage of milling to prepare powders for pressed pellets for XRF analysis, a second milling step was thus applied to further reduce the powder grain sizes and improve the homogeneity of the samples selected to be analysed by laser ablation. This extra grinding step was applied to the three reference materials BHVO-2 and BIR-1a (basalts, USGS) and JP-1 (peridotite, GSJ) and to a selection of gabbros and dunites from the OmanDP CM1A cores.
For each selected sample, 3 g of powder (grain size ≤ 250 µm following the first milling step) was further milled using the Fritsch Pulverisette 5 planetary mill in an 80 mL agate grinding bowl with four agate balls 20 mm in diameter. The sample was rotated at 400 rpm for 30 min, for four repeat cycles, alternating with 5 min-long cooling steps between each milling cycle. The content of the jar was then sieved through 100, 60, and 25 µm nylon meshes (Clever, Toyohashi, Japan). Material > 100 µm was returned to the bowl and ground for a further 30 min. The same step was repeated for fractions > 60 and > 25 µm. Once a sample was powdered to < 25 µm, all the powder fractions were recombined and returned to the grinding bowl and milled for 5 min for homogenization. Similarly to the first stage of milling, the agate grinding bowl and agate balls were carefully cleaned with Milli-Q water and isopropanol and decontaminated by milling pure quartz sand after each sample.
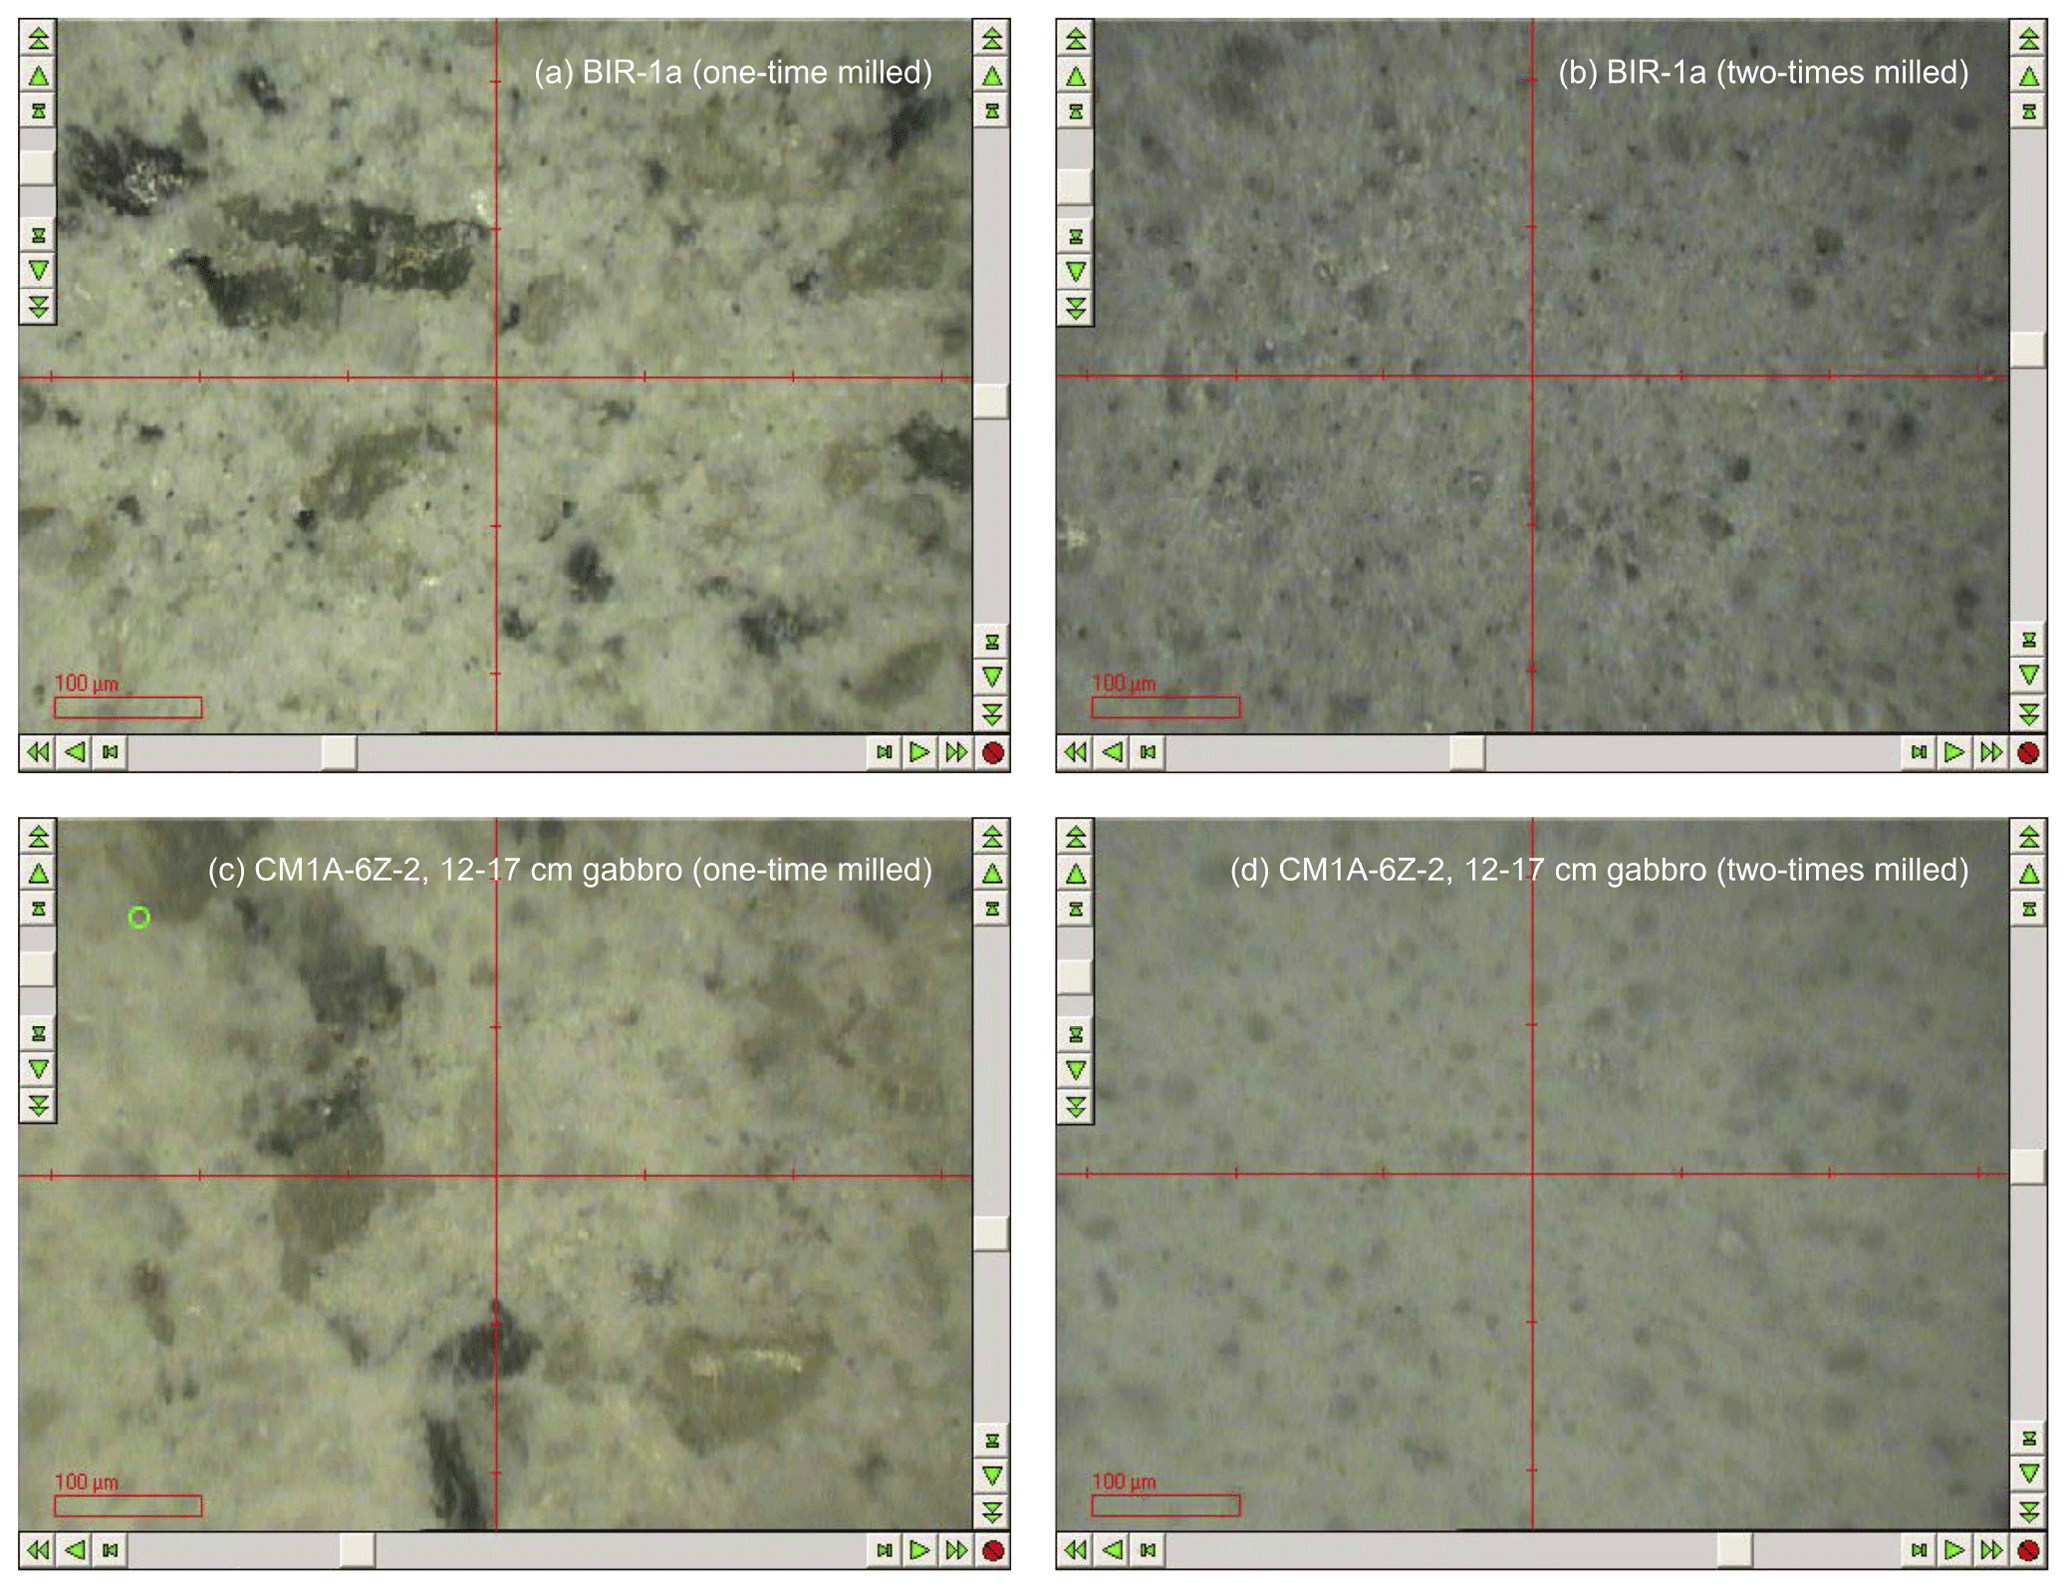
Figure 2Comparison of the grain sizes in pressed powder pellets before (a, c) and after (b, d) the second step milling for the reference material BIR-1a (a, b) and for the gabbro sample CM1A-6Z-2, 12–17 cm from the OmanDP Hole CM1A (c, d) (modified from Fig. F52, Kelemen et al., 2020). The minimum laser spot size that could be parameterized with the laser ablation system used on-board the D/V Chikyu was 100 µm in diameter, smaller than the size of some mineral grains when samples have been milled only once.
Approximately 1.5 g of the < 25 µm powder was pressed using the Spex SamplePrep 3630 X-Press into powder pellets for (ultra-)trace element analyses by LA-ICP-MS. The powder was weighed and placed into a 5 mm-high sample holder cut from an 18 mm diameter polypropylene tube. The powder was isolated from the metal rams that apply the load from the press to the sample powder using Prolene film (CHEMPLEX, Florida, USA). The press was set to ramp up to 15 t and held there for 20 s, and then the pressure was gradually released over 66 s. Figure 2 shows examples (the reference material BIR-1a and a gabbro from Hole CM1A) of the contrast in grain size between pellets prepared with powder after a one-step milling for the XRF analyses (to the left) and with re-milled powder for the analyses by laser ablation (to the right). Concerning the OmanDP samples, it is worth noting that the dunite samples were particularly altered (serpentinized) and thus milled much more easily than the fresher, coarser-grained gabbros. On the other hand, the dunites contain minor spinel that could be much harder to grind relative to other silicate minerals.
2.3.2 Instrumentation and data acquisition
The instrumentation on-board the D/V Chikyu comprises a NewWave Research UP-213 Nd:YAG deep UV (213 nm) laser ablation system coupled to an Agilent 7500ce quadrupole ICP-MS. First, initial basic tests and parametrization of the operating conditions were performed by the analysis of the well-known reference glasses BHVO-2G and BIR-1G. Analyses were bracketed by repeated analyses of NIST SRM 612 glass (National Institute of Standards and Technology), used as an external reference material following the reference values from Jochum et al. (2011); NIST SRM 610 has been used for the instrument calibration. In addition to 29Si, analysed as an internal standard for the data reduction (e.g. Longerich et al., 1996; SiO2 reference values used for BHVO-2G and BIR-1G after Jochum et al., 2005), the isotopes analysed for the 37 selected elements were as follows: 7Li, 45Sc, 49Ti, 51V, 52Cr, 55Mn, 59Co, 62Ni, 65Cu, 67Zn, 71Ga, 85Rb, 88Sr, 89Y, 90Zr, 93Nb, 133Cs, 137Ba, 139La, 140Ce, 141Pr, 143Nd, 147Sm, 151Eu, 158Gd, 159Tb, 163Dy, 165Ho, 166Er, 169Tm, 172Yb, 175Lu, 178Hf, 181Ta, 208Pb, 232Th, 238U.
Table 1Summary of the LA-ICP-MS instrument operating conditions.

Once the laser ablation system parameters were set, we started the ablation tests on the prepared fine-grained pressed powder pellets. The ICP-MS configuration was adjusted before each analytical sequence to ensure the high sensitivity required to measure the elements present in very low concentrations, especially those expected in the JP-1 peridotite reference material and the dunite samples from Hole CM1A. Operating conditions are summarized in Table 1. Each analysis consisted of 40 s of background, 60 s of acquisition ablation and 120 s of washout. Instrumental background was analysed before each analysis and then subtracted from the signal obtained during sample ablation (typical values are given in Table 2). Only about 50 s of the signal obtained during sample ablation have been included in the calculation of concentrations, and the first few seconds of the ablation signal have been discarded as they can be fractionated and might integrate surface contamination (e.g. Peters and Pettke, 2017). The NIST SRM 612 glass reference material was used as an external standard for the pressed powder pellets prepared for the reference materials BHVO-2, BIR-1a and JP-1. Analytical sequences consisted of one analysis of NIST SRM 612 between each analysis of pellets. First, the sample ablation signal (i.e. already corrected from the instrumental background) was corrected for the instrumental drift with the bracketing NIST SRM 612 (drift assumed to be linear between two NIST SRM 612 analyses). Data reduction and calculation of concentrations have been made using 29Si as an internal standard, following the SiO2 obtained by XRF for the reference materials BHVO-2 and JP-1 and following the reference values for the reference material BIR-1a (USGS certificate of analysis).
Table 2Trace element concentrations (µg g−1) for BHVO-2, BIR-1a and JP-1 determined by LA-ICP-MS analyses of pressed powder pellets on-board the D/V Chikyu.

a Detection limit (or blank) with the used instrumentation, corresponding to the average of the signal background. b Preferred values (BHVO-2: Barrat et al., 2012; BIR-1a: GeoReM; JP-1: Barrat et al., 2008 (Ti, V, Sr, Zr, Hf), Makishima and Nakamura, 2006 (Tm), Rospabé et al., 2018a (other elements)). c The determined values differed signifcantly from the preferred values and were reported here just as indications.
The results obtained for the BHVO-2 and BIR-1a pressed powder pellets were first compared to the results obtained for the BHVO-2G and BIR-1G glasses to ensure there was no drift or major matrix effect related to alternatingly analysing glass and pressed powder. In addition, the relatively depleted mantle peridotite JP-1 was analysed to evaluate the lowest concentrations we were able to accurately determine by analysing pressed powder pellets by laser ablation. It has been shown that in peridotites, the large difference in concentration between major elements such as in Mg or Fe and the very low contents of trace elements such as the Rare Earth Elements (REE) lowers the efficiency of precisely detecting the less concentrated elements depending on the dilution factor (Makishima and Nakamura, 1997, 2006; Nakamura and Chang, 2007). A preconcentration of the (ultra-)trace elements is a usual method to avoid such a matrix effect (e.g. Bayon et al., 2009; Bizzarro et al., 2003; Qi et al., 2005; Rospabé et al., 2018a; Sharma et al., 1995; Sharma and Wasserburg, 1996), but it could not be performed in the context of the presently described “dry”, solid (i.e. reagent-free) method development. The results obtained for these three reference materials are compared to preferred or reference values and discussed in the next Sect. 3.1. During subsequent analysis of pressed powder pellets of gabbros and dunites from Hole CM1A, analyses were bracketed by repeated analyses of BHVO-2G (glass), used as an external standard. For these OmanDP samples, data reduction and calculation of concentrations have been made using 29Si as an internal standard, based on the SiO2 contents obtained by XRF. The results are compared with replicates for the same gabbro and dunite samples analysed after Leg 3 in the next Sect. 3.2.
2.4 Methodologies for post-cruise replicate analyses
Replicate analyses for the CM1A gabbros analysed by laser ablation on-board the D/V Chikyu have been performed at the University of Southampton (UK); 100 mg of powder was weighed into Savillex® Teflon PFA vials and digested with HF/HNO3 overnight, followed by a second overnight digestion step with HClO4. The digested samples were dissolved in 6M HCl to make a mother solution. The mother solution was subsampled to give a final dilution of ∼ 4000-fold, dried down and redissolved in 3 % HNO3 containing In, Re and Be as internal standards (internal standard concentrations were 5 ng g−1 for In and Re and 20 ng g−1 for Be). The samples were analysed on a Thermo Fisher Scientific™ XSERIES 2 ICP-MS using JB-1a, JB-2, JB-3, JGb-1, BIR-1, BHVO-2, AGV-2 and BCR-2 as calibration standards; these were also dissolved in 3 % HNO3 containing In, Re and Be.
The replicates for the selected dunites have been analysed at the Institute of Earth Science, Academia Sinica (IES-AS, Taiwan), and at the Géosciences Environnement Toulouse laboratory, Université Toulouse III – Paul Sabatier (GET, France). Samples have been dissolved by acid digestion and their trace element concentrations measured by ICP-MS. The measurements conducted at IES-AS were made using an Agilent 7500s ICP-MS and following the procedure described by Ionov et al. (1992) and adapted by Godard et al. (2000) for the analysis of ultra-depleted peridotites. At the GET laboratory, a Thermo Scientific™ Element XR™ HR-ICP-MS was used following the analytical procedure developed in Rospabé et al. (2018a) and adapted from Yokoyama et al. (1999) for the sample digestion method, Bizzarro et al. (2003) and Qi et al. (2005) for the (ultra-)trace element separation, and Barrat et al. (1996) for the Tm addition and calculation of the concentrations using the Tm positive anomaly in the REE pattern. To compare the accuracy and the precision between these two laboratories, trace element measurements were performed on a selection of replicate samples, and the same reference materials have been analysed as unknowns (the GSJ peridotite JP-1 and the USGS dunite DTS-2b).
3.1 Validity of the developed method and measurement precision
Figure 3 shows plots of the results obtained for the reference materials BHVO-2/BHVO-2G, BIR-1a/BIR-1G and JP-1 following their analysis by LA-ICP-MS (glasses and two-time milled pressed powder pellets) and by XRF (one-time milled pressed powder pellets) during Leg 3. Measured concentrations are normalized to preferred values. Error bars represent the standard deviation, reflecting the intermediate precision (or repeatability over the different analytical sessions) of the averaged composition of n measurements (see Fig. 3 caption). The chondrite-normalized REE and multielement patterns of the analysed pressed powder pellets are shown in Fig. 4, and the evolution of the relative standard deviation (RSD) relative to the measured element concentrations is shown in Fig. 5.
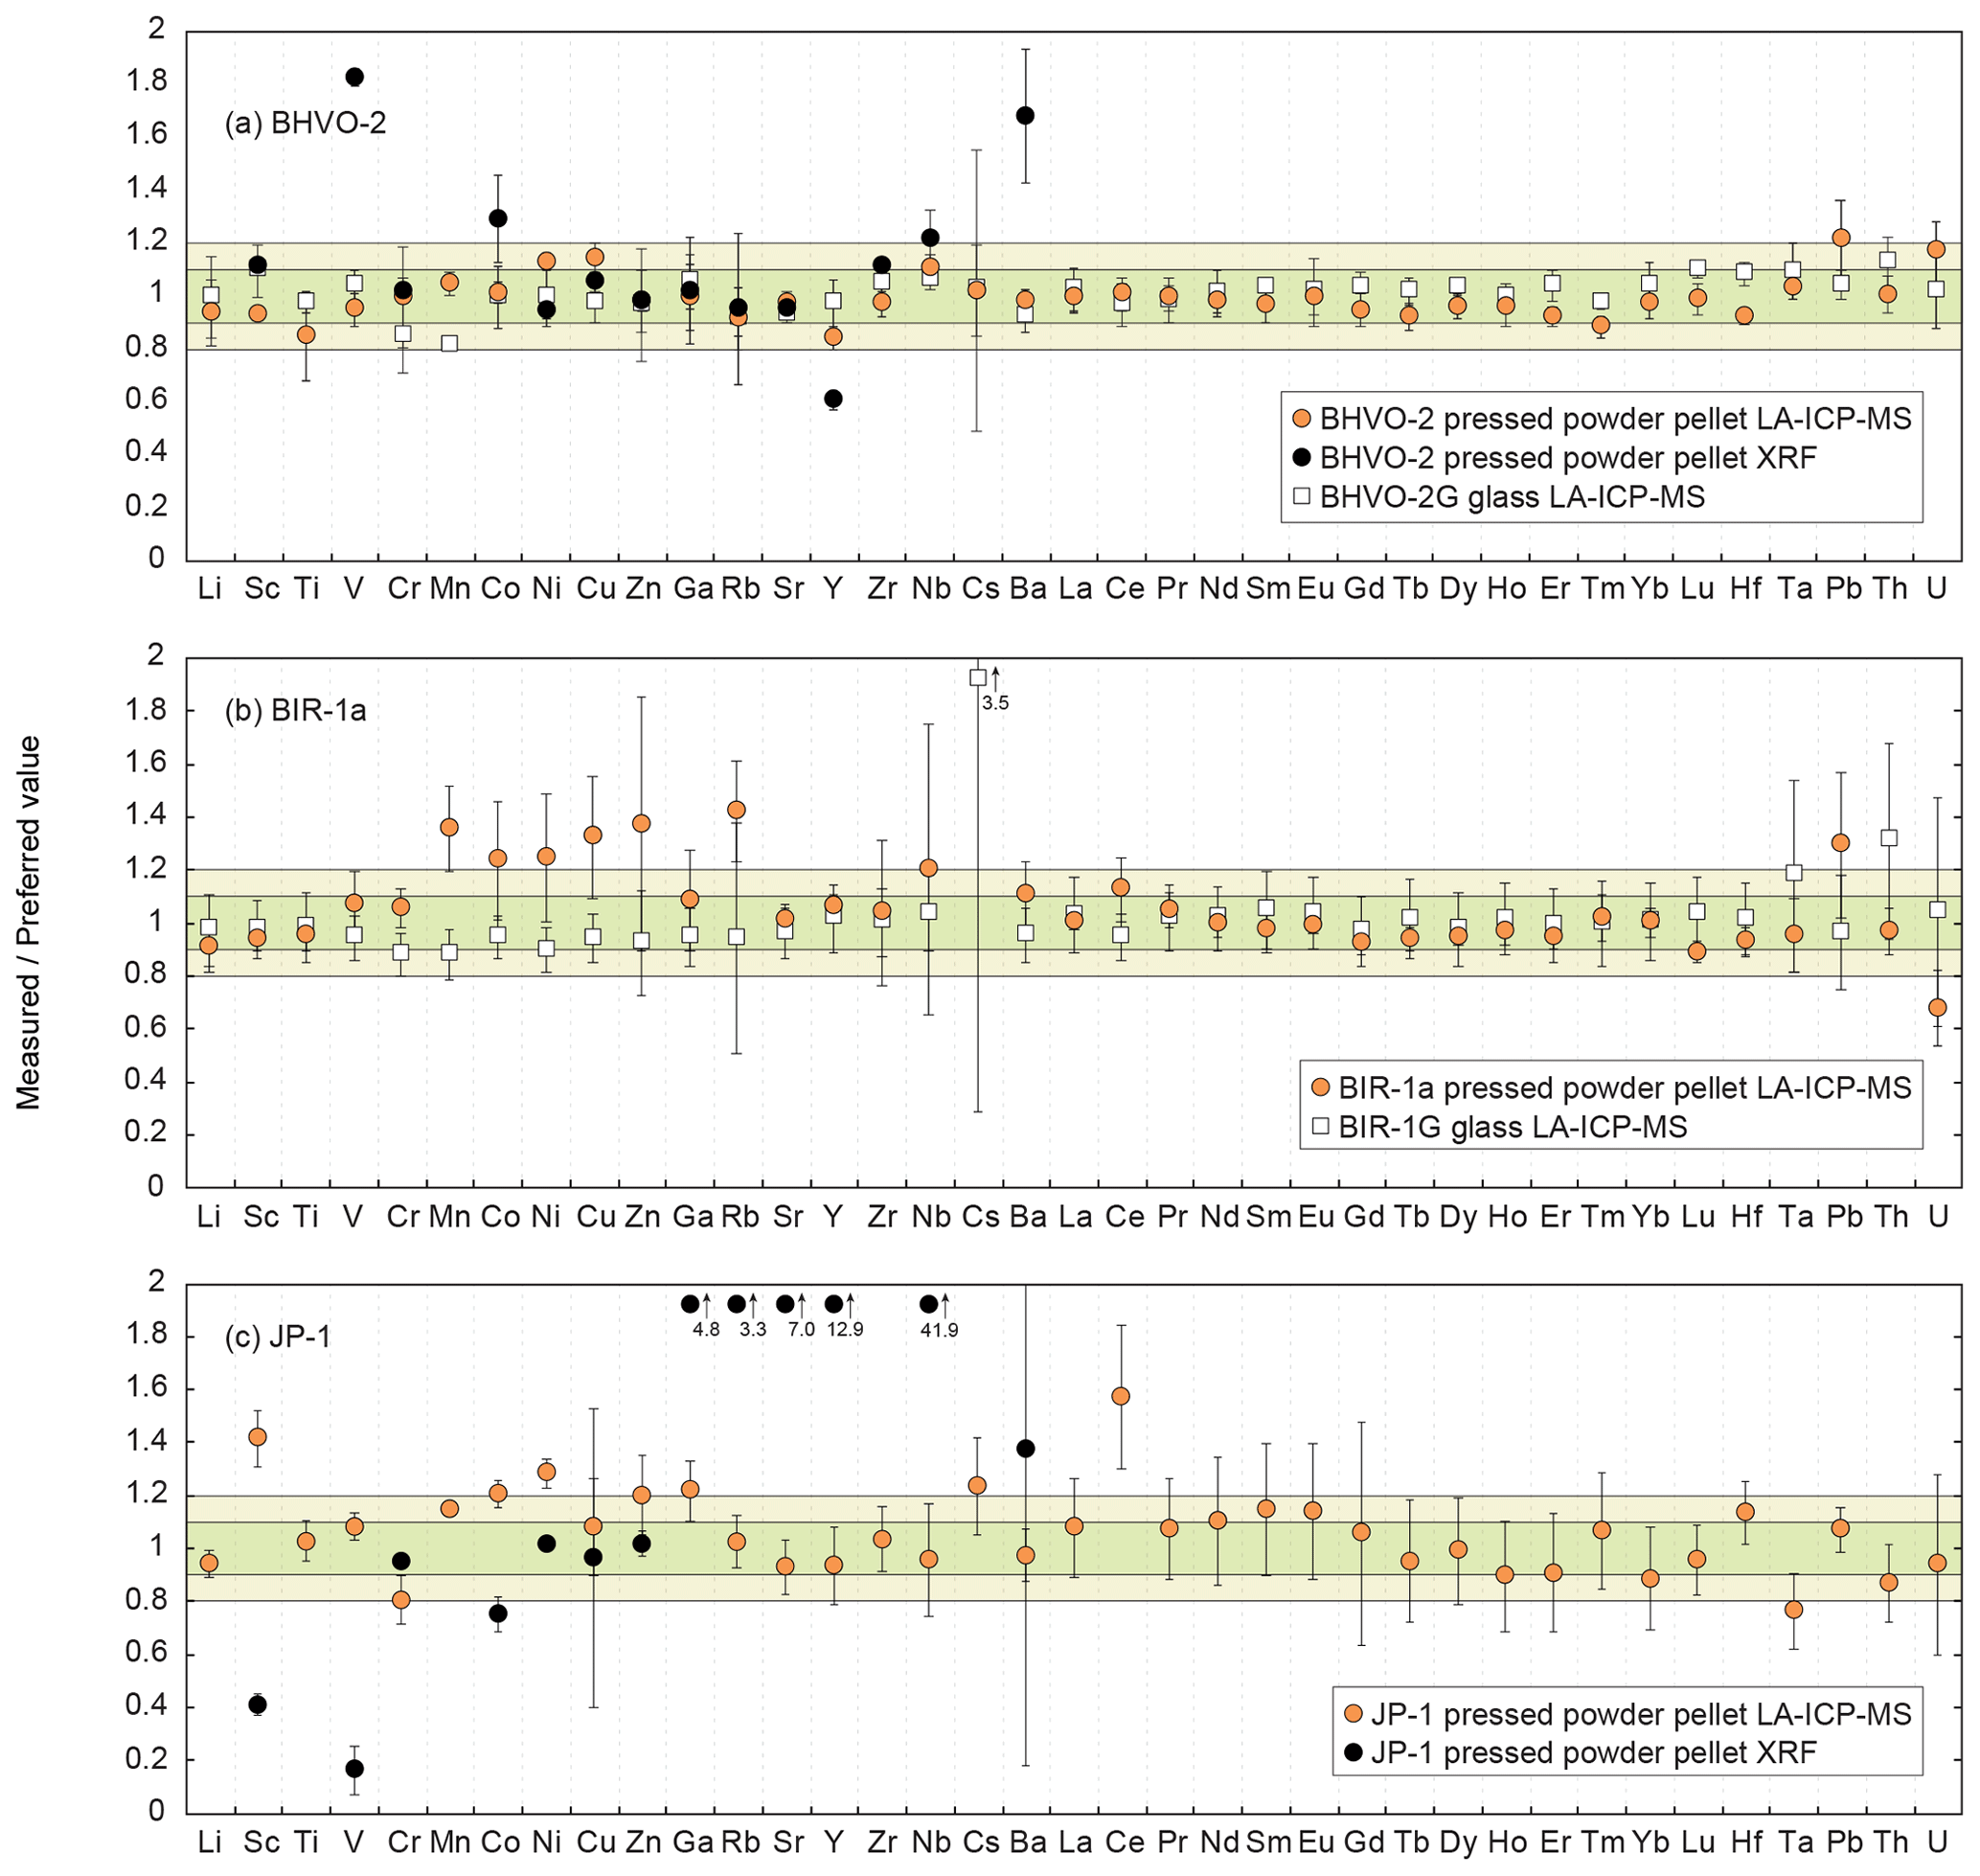
Figure 3Plots of the results obtained using the LA-ICP-MS dry method developed on-board the D/V Chikyu on pressed powder pellets and glass normalized to preferred values for the standard materials (a) BHVO-2 (n = 7) and BHVO-2G (n = 4), (b) BIR-1a (n = 5) and BIR-1G (n = 17), and (c) JP-1 (n = 10). Data obtained by XRF (D/V Chikyu) on pressed powder pellets are shown for BHVO-2 and JP-1. Error bars represent the standard deviation, reflecting the intermediate precision (or repeatability) of the averaged composition of the multiple n measurements. The horizontal green and light green fields indicate the 10 % and 20 % δPV, respectively. Preferred values are from Jochum et al. (2005) for BHVO-2G and BIR-1G, from Barrat et al. (2012) for BHVO-2, from GeoReM (http://georem.mpch-mainz.gwdg.de, 12 July 2018) for BIR-1a, and from Barrat et al. (2008) (Ti, V, Sr, Zr, Hf), Makishima and Nakamura (2006) (Tm), and Rospabé et al. (2018a) (all other elements) for JP-1.
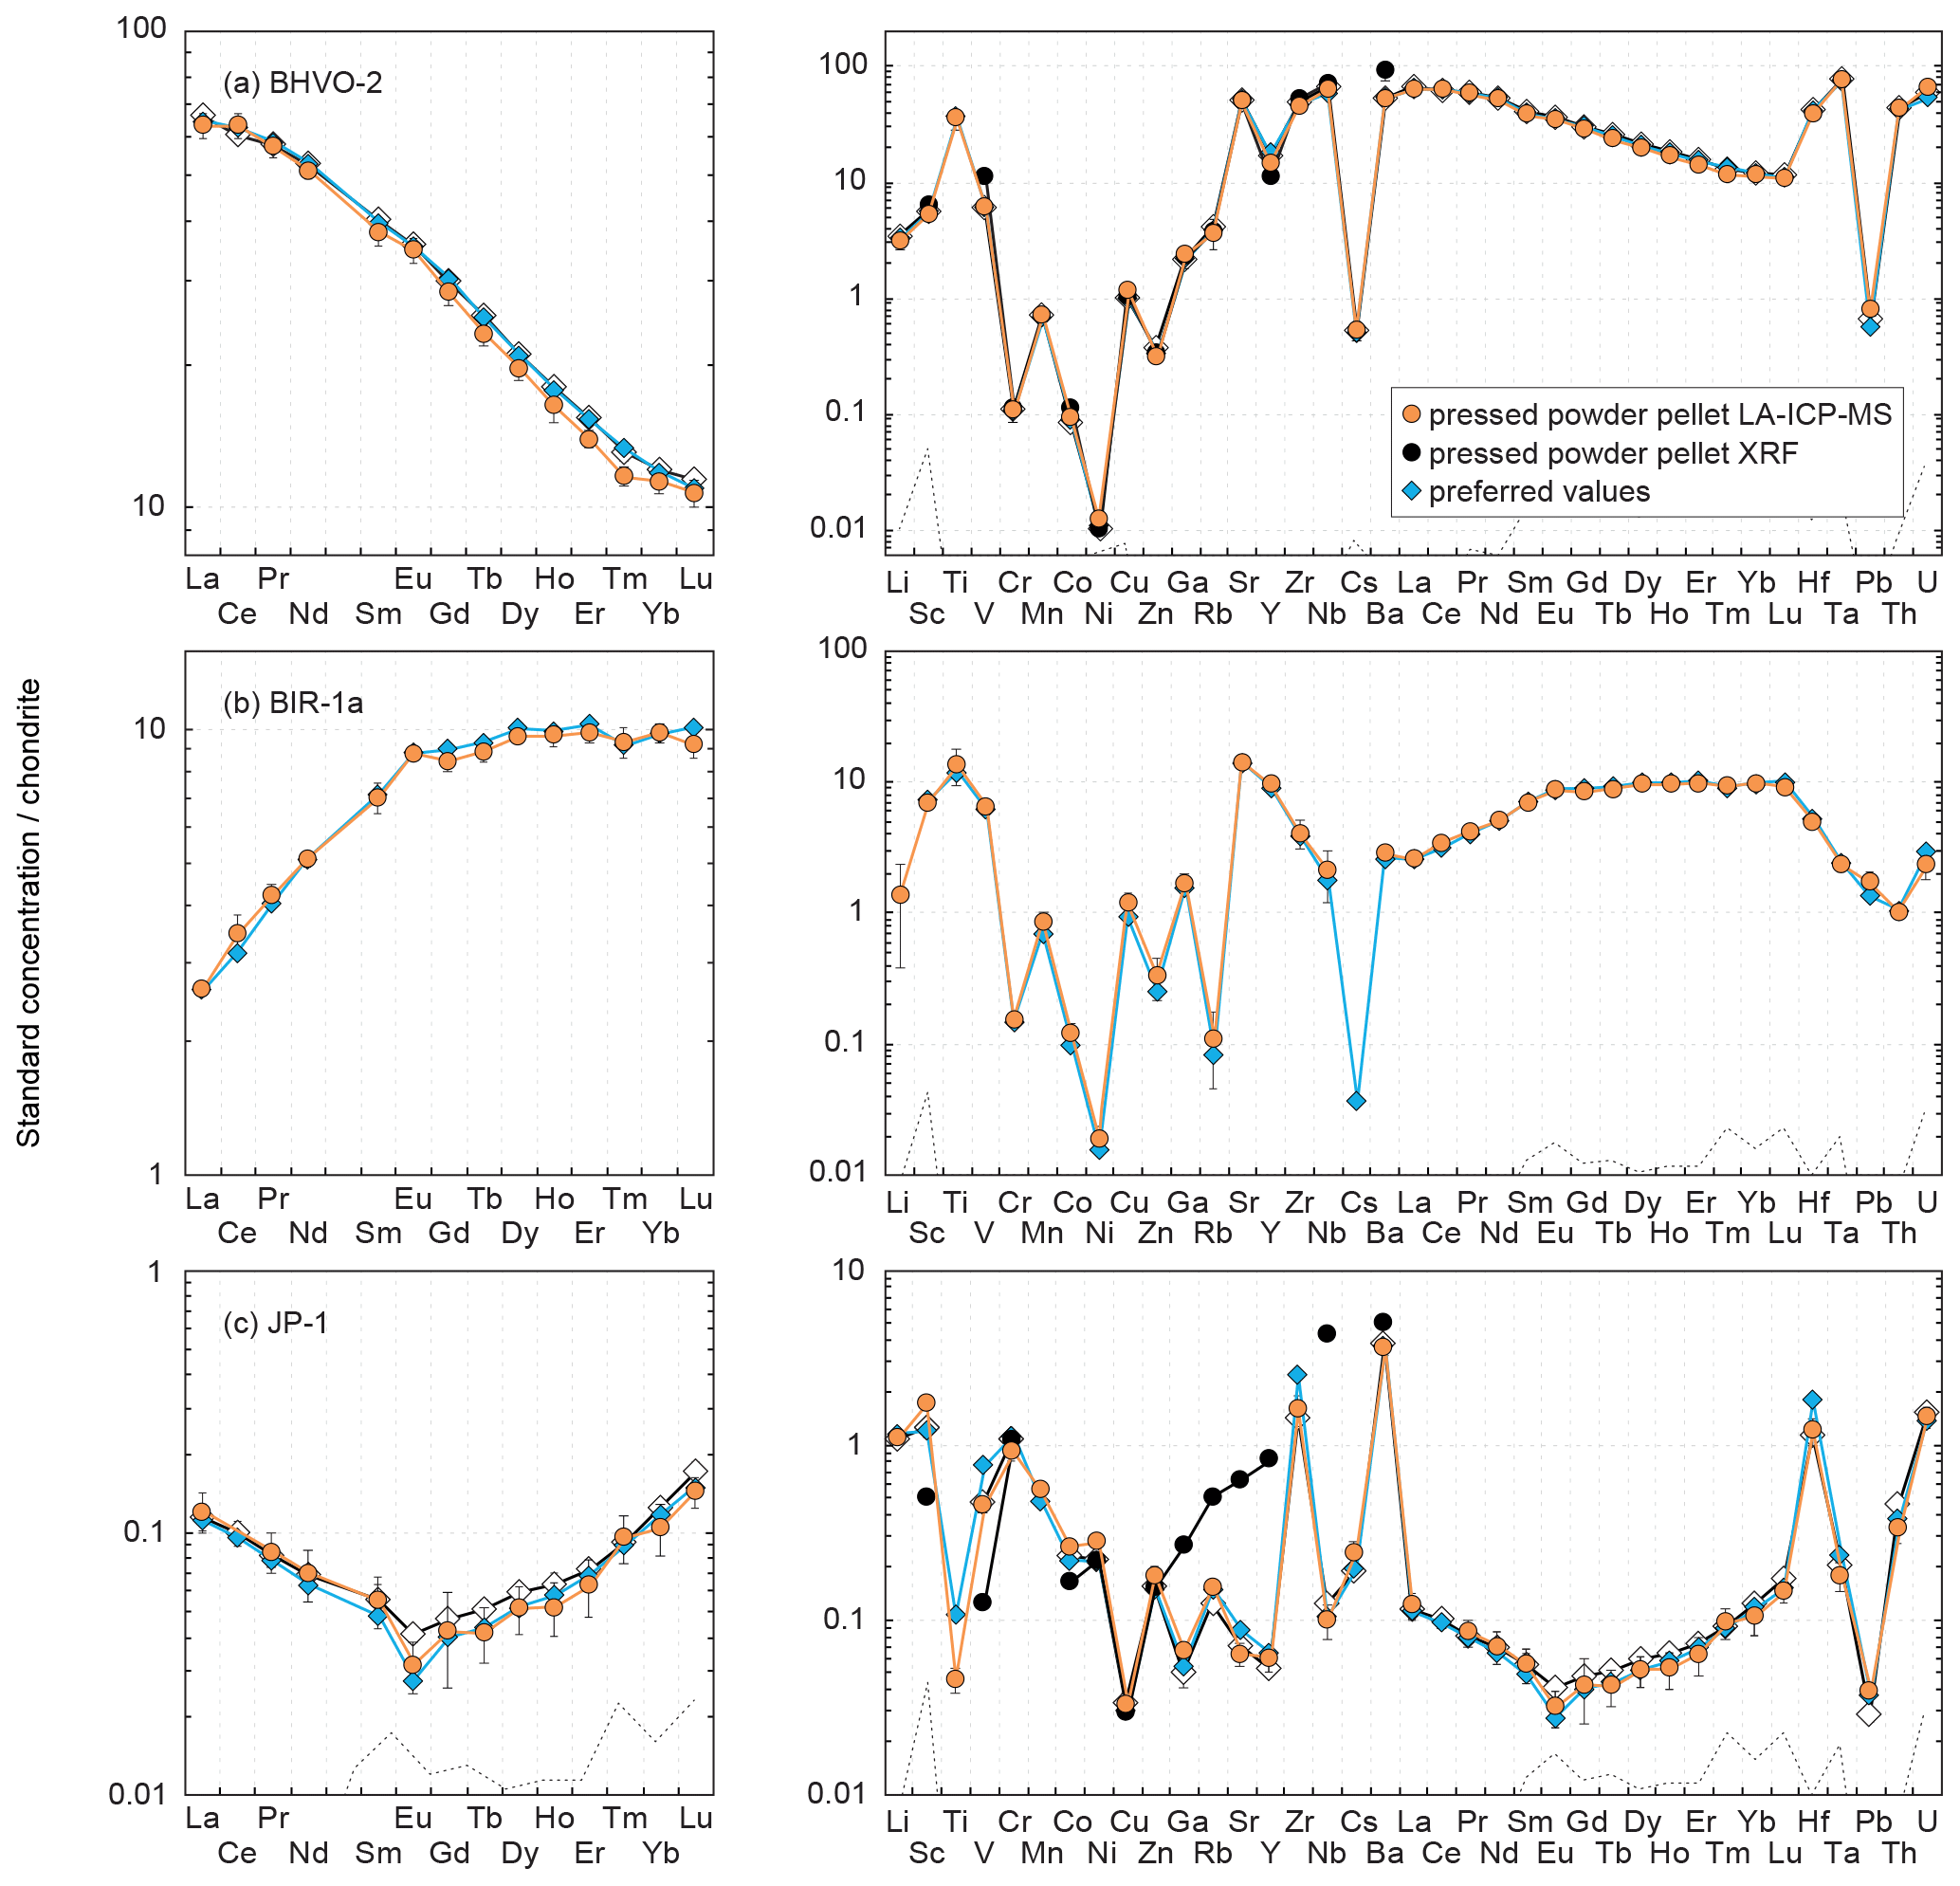
Figure 4Chondrite-normalized (normalization values from Barrat et al., 2012) REE and multielement patterns obtained for the reference materials (a) BHVO-2, (b) BIR-1a and (c) JP-1 by LA-ICP-MS and XRF analyses of pressed powder pellets performed on-board the D/V Chikyu, compared to the preferred values. Preferred values are from the same references given in the Fig. 3 caption. Patterns obtained by Garbe-Schönberg and Müller (2014) for BHVO-2 and Peters and Pettke (2017) for JP-1 by the analysis of pressed powder pellets (prepared without a binder for BHVO-2, with a binder for JP-1) by LA-ICP-MS are also shown for comparison (white diamonds). The black dotted line represents the detection limit with the used instrumentation (values are given in Table 2).
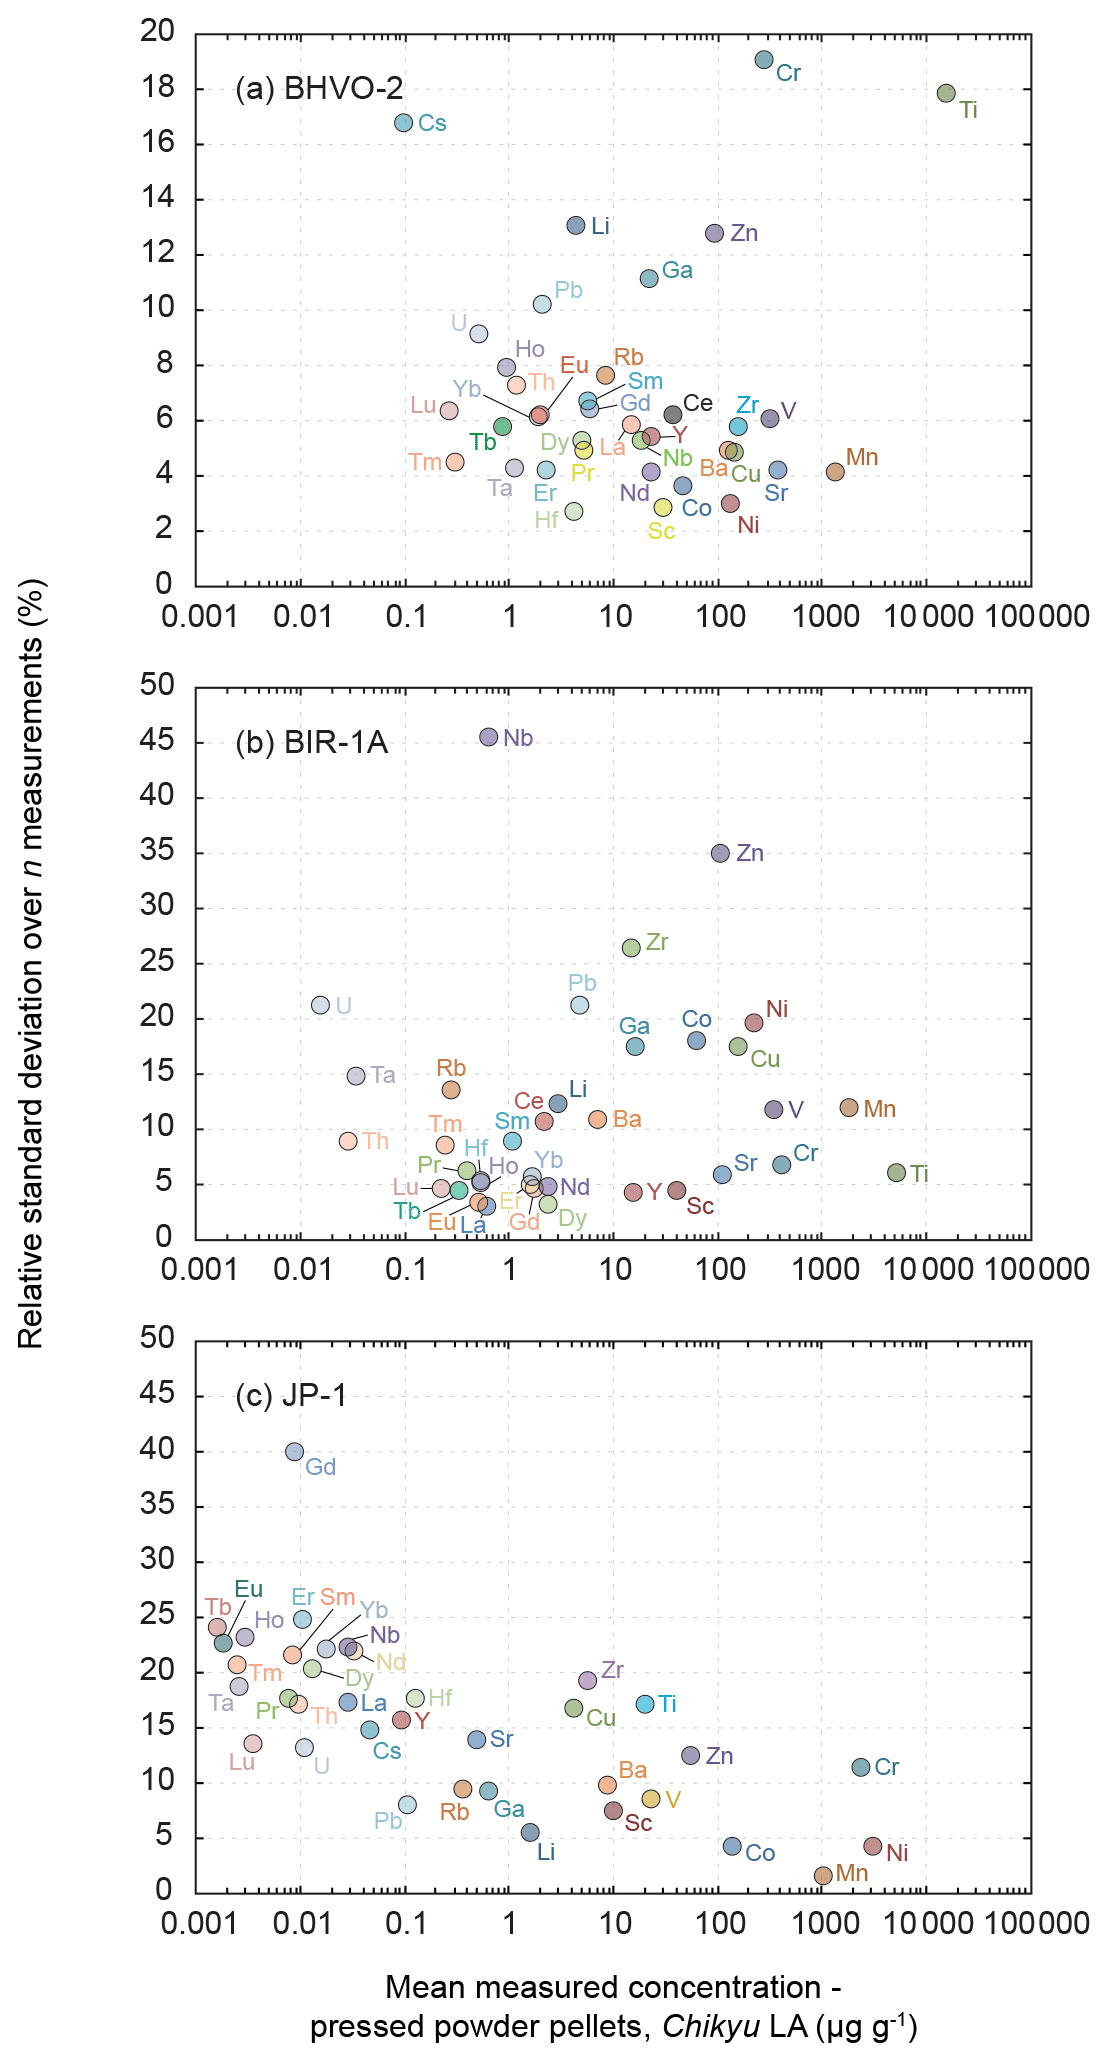
Figure 5Evolution of the relative standard deviation (RSD, in %) relative to the measured element concentrations in the reference materials (a) BHVO-2 (n = 7), (b) BIR-1a (n = 5) and (c) JP-1 (n = 10). The RSD represents the intermediate precision (or repeatability) of the averaged composition of the multiple n measurements. Note the change in the scale of the y axis from BHVO-2 to BIR-1a and JP-1.
3.1.1 Minor to trace element concentrations determined by XRF
The results obtained by XRF for the minor to trace elements (Sc, V, Cr, Co, Ni, Cu, Zn, Ga, Rb, Sr, Y, Zr, Nb, Ba) for the two reference materials BHVO-2 and JP-1 are described here. For the reference material BHVO-2, the determined concentrations for Cr, Ni, Cu, Zn and Sr are very close to the preferred values (difference δPV < 10 %, with δPV as the relative deviation of measured concentration values from the preferred values (PV) in %) with a repeatability better than 5 % as well as for Ga and Rb but with a poorer repeatability (< 30 %; Figs. 3a and 4a). The concentrations for Sc, Zr and Nb fall within δPV < 25 % with a repeatability better than 1.5 % for Sc and Zr and 10 % for Nb. The concentrations are overestimated for Co (δPV 30 %) and especially for Ba and V (δPV > +60 %) and underestimated for Y (δPV %; Fig. 3a). For the reference material JP-1, the concentrations obtained for Cr, Ni and Zn are in good agreement with the preferred values (δPV < 10 %), with a repeatability better than 5 %, as well as for Cu but with a poor repeatability (59 %; Fig. 3c). The Co content is slightly underestimated (δPV %). However, the low concentrations for Sc, V, Ga, Rb, Sr, Y, Zr, Nb and Ba were not accurately determined for JP-1 using the XRF, and the obtained values differ significantly from the preferred values (Figs. 3c and 4c).
3.1.2 Minor and trace to ultra-trace element concentrations determined by LA-ICP-MS
The parameters of the laser ablation system and of operating conditions (Table 1) were adjusted by analysing the two reference glasses BHVO-2G and BIR-1G. Most of the 37 elements selected to be analysed fall within the 10 % difference range from the preferred values (Fig. 3a, b). Exceptions in BIR-1G are the concentration for Th that is slightly overestimated over the δPV 20 % as well as that for Cs that was not determined precisely (the lowest concentration in BIR-1G over the 37 measured elements, 8 ng g−1 proposed by Jochum et al., 2005). The averaged repeatability for all the analysed elements is better than 7.8 % for BHVO-2G and 12.8 % for BIR-1G, which appeared sufficiently precise to apply the optimized parameters for the analysis of the two-time milled pressed powder pellets.
Results obtained by LA-ICP-MS analysis of pressed powder pellets prepared for the three reference materials BHVO-2, BIR-1a, and JP-1 are shown in Fig. 3 with the obtained concentrations normalized to preferred values and in Fig. 4 with their chondrite-normalized REE and multielement patterns plotted. The relative standard deviations relative to the measured element concentrations are shown in Fig. 5. The concentrations determined by LA-ICP-MS for these three reference materials are given in Table 2. The measured concentrations for minor and (ultra-)trace elements are generally close to preferred values, with most elements within δPV < 10 % for BHVO-2 and BIR-1a and within δPV < 20 % for JP-1 (Fig. 3). The shapes of their normalized REE and multielement patterns are adequate compared to the ones plotted with reference values (Fig. 4). The precision is variable depending on the standard analysed and the element considered and basically decreases with lower concentrations: the averaged repeatability for all the analysed elements is better than 7.1 %, 11.6 %, and 15.1 % for BHVO-2, BIR-1a, and JP-1, respectively. In detail for BHVO-2, the RSD is generally better than 6 % for elements with a concentration higher than 10 µg g−1 and comprised between 6 % and 10 % for concentrations ranging from 0.1 to 10 µg g−1, with a few exceptions (Fig. 5a). For BIR-1a, with a few exceptions (especially transition elements as discussed below), the RSD is better than 10 % for elements with concentrations higher than 10 µg g−1, better than 15 % for concentrations ranging from 0.1 to 10 µg g−1 (including the Rare Earth Elements, among others), and increases up to 20 %–25 % for elements with a concentration lower than 0.1 µg g−1 (Ta, Th, U; Fig. 5b). Concerning JP-1, the increase in the RSD with lower concentrations is very clear, better than 15 % for concentrations higher than 0.1 µg g−1 (most of the transition elements and large ion lithophile elements) and mostly ranging from 15 % to 25 % for lower concentrations (Rare Earth Elements and other (ultra-)trace elements; Fig. 5c).
In detail:
-
Transition elements (Sc, Ti, V, Cr, Mn, Co, Ni, Cu, Zn) and Ga
Except for Ti, the transition elements and Ga have been determined both by XRF and LA-ICP-MS analytical methods for BHVO-2 and JP-1 (only by laser ablation for BIR-1a). For BHVO-2, with only a few exceptions, the transition elements and Ga (20.6 ≤ PV ≤ 16364 µg g−1) have been determined accurately by laser ablation, differing by less than 10 % from preferred values (Fig. 3a). The repeatability over the different measurements is better than 5 % for Sc, Mn, Co, Ni and Cu, 10 % for V, 15 % for Zn and Ga, and 20 % for Ti and Cr (Fig. 5a). For BIR-1a, the Sc, Ti, V, Cr and Ga concentrations (15.0 ≤ PV ≤ 1345 µg g−1) have been determined accurately, falling within the δPV < 10 % variation range from the preferred values (Fig. 3b). The repeatability is better than 6.8 % for Sc, Ti and Cr, better than 11.7 % for V, and better than 17.5 % for Ga (Fig. 5b). Cobalt (PV = 52.0 µg g−1) and Ni (PV = 178 µg g−1) are slightly overestimated (δPV 25 %), but the accuracy is lower for the determination of the Mn, Cu and Zn concentrations that appear overestimated by 30 % to 40 % (Fig. 3b); the precision for these elements is notably worse, with a repeatability better than 12 % for Mn and 20 % for Co, Ni and Cu but reaching 35 % for Zn (Fig. 5b). Concerning the reference material JP-1, the accuracy of the determination of the transition elements is variable according to the element considered: the concentrations determined by LA-ICP-MS are relatively close to preferred values (δPV < 20 %) for Ti, V, Cr, Mn, Co, Cu and Zn (3.84 ≤ PV ≤ 2959 µg g−1; Fig. 3c), with a repeatability better than 1.7 % for Mn, 4.2 % for Co, 8.6 % for V, 12.5 % for Cr and Zn, and 17 % for Ti and Cu (Fig. 5c). Nickel (PV = 1443 µg g−1) and Ga (PV = 518 ng g−1) (δPV 25 %, with a repeatability better than 4.3 % and 9.4 %, respectively) and especially Sc (PV = 7 µg g−1; δPV 40 %) are slightly to significantly overestimated. For JP-1, the Cr, Ni, Cu and Zn concentrations have thus been determined with a better accuracy using the XRF (Fig. 3c).
-
Rare Earth Elements
The Rare Earth Elements (REEs) have been analysed using the LA-ICP-MS method only. The averaged repeatability of their measurement is 5.8 % for BHVO-2 (4.1 %–7.9 %), 5.6 % for BIR-1a (3.0 %–10.7 %), and 20.8 % for JP-1 (13.5 %–24.7 %, excepting 39.9 % for Gd; Fig. 5). Note that the Ce content is not included in the JP-1 REE pattern (Fig. 4c) as the concentration was regularly high for this reference material compared to the preferred value (Fig. 3c; Table 2). For the three reference materials, the REE concentrations are in good agreement with previously proposed values (Fig. 3): with a few exceptions they fall within the 10 % variation range from the preferred values (PV = 0.27–37.5 µg g−1 for BHVO-2, 0.24–2.55 µg g−1 for BIR-1a, and 1.62–57.6 ng g−1 for JP-1), and the shape of the chondrite-normalized REE patterns fits with previous analyses (Fig. 4). Interestingly, the measured REEs show a slight fractionation from heavy REEs (slightly underestimated relative to preferred values, −10 % < δPV < 0 %) to light REEs (slightly overestimated, 0 % < δPV < 10 %; Fig. 3). Such bias has already been reported and discussed for the analysis of pressed powder pellets by Peters and Pettke (2017, and references therein). They proposed that it could possibly reflect a matrix effect related to the non-matrix-matched calibration (i.e. in the present study, NIST SRM 612 glass used to calibrate pressed powder pellets of standards).
-
High-Field-Strength Elements (Zr, Nb, Hf, Ta) and other (ultra-)trace elements (Y, Pb, Th, U)
For BHVO-2, the measured concentrations are very close to preferred values, δPV < 10 % for the High-Field-Strength Elements (HFSE) and Th (1.10 ≤ PV ≤ 165 µg g−1) and δPV < 20 % for other trace elements (0.41 ≤ PV ≤ 27.6 µg g−1; Fig. 3a). Yttrium, Zr and Nb are more precisely determined using the laser ablation method than by XRF. The repeatability for these elements is better than 5.4 % for Y, 5.8 % for HFSE, 9.8 % for Th and U, and 10.2 % for Pb (Fig. 5a). For BIR-1a, except for Pb and U (repeatability better than 21.2 % for both; Fig. 5b) that are slightly overestimated and underestimated, respectively (PVPb = 3.70 µg g−1, PVU = 23 ng g−1), the determined concentrations for HFSE and other (ultra-)trace elements (30 ng g−1 ≤ PV ≤ 27.6 µg g−1) vary within 10 % from the preferred values (δPV 20 % for Nb only; Fig. 3b). The repeatability is better than 5 % for Y, 10 % for Hf and Th, and 15 % for Ta (Fig. 5b). However, the precision is worse concerning the averaged measurements for Zr (26.4 %) and especially Nb (45.5 %) in spite of the apparent good determination of their concentration (Figs. 3b and 4b). It potentially results from microfragments of trace minerals rich in HFSE in this powder standard related to grain size effects (or “nugget effects”, Peters and Pettke, 2017; see also Garbe-Schönberg and Müller, 2014) and/or to the analytical difficulty in determining the concentration of these elements (e.g. Ionov et al., 1992; Jochum et al., 1990; Weyer et al., 2002). For JP-1, with the exception of Y, which was also analysed but inaccurately determined by XRF, the measurement of the HFSEs and other (ultra-)trace elements have been determined using the LA-ICP-MS method only (Figs. 3c and 4c), their low concentrations being several orders below the detection limits of the XRF (3.45 ng g−1 (Ta) ≤ PV ≤ 113 ng g−1 (Hf), except Zr with PV = 5.39 µg g−1). The determined Zr and Nb differ by less than 4.5 % from the preferred values, and Hf and Ta are moderately overestimated and underestimated, respectively (δPV 15 % and −24 %, respectively; Fig. 3c). The measured Y, Pb and U fall within the δPV < 7.5 % variation range and δPV = 13.0 % for Th (10.6 ng g−1 ≤ PV ≤ 100 ng g−1). The repeatability is better than 10 % for Pb and 20 % for other elements (except Nb: 22.3 % and U: 36.1 %; Fig. 5c).
-
Lithium and large-ion lithophile elements (Rb, Sr, Cs, Ba)
The determined concentrations for Li in the three reference materials fall within δPV < 10 % regarding the preferred values (PVLi = 4.70 µg g−1 for BHVO-2, 3.20 µg g−1 for BIR-1a, and 1.68 µg g−1 for JP-1; Fig. 3). The repeatability for Li is better than 13.1 %, 12.3 % and 5.5 % for BHVO-2, BIR-1a and JP-1, respectively (Fig. 5). For BHVO-2, the measured contents in Large-Ion Lithophile Elements (LILE) are also very close to reference values (96 ng g−1 (Cs) ≤ PV ≤ 131 µg g−1 (Ba); Fig. 3a), with a repeatability better than 7.7 % except for Cs (16.8 %) (Fig. 5a). In BIR-1a, Rb and especially Cs have not been determined precisely or accurately, likely related to their low concentration (PVRb = 197 ng g−1, PVCs = 7 ng g−1). The determined Sr and Ba concentrations are close to preferred values (PVSr = 109 µg g−1, PVBa = 6.50 µg g−1; Fig. 3b), with a repeatability over several measurements better than 6 % and 11 %, respectively (Fig. 4b). For JP-1, the determined concentrations for Rb, Sr and Ba (0.35 µg g−1 ≤ PV ≤ 8.98 µg g−1) are likewise very close to the preferred values (Fig. 2c), with a repeatability better than 10 % for Rb and Ba and better than 14 % for Sr (Fig. 5c). Cs is slightly overestimated (PV = 37 ng g−1, δPV 23 %; Fig. 3c), with a repeatability better than 15 % (Fig. 5c). For BHVO-2 and JP-1, the LILE values have been determined with a similar or better accuracy by using the LA-ICP-MS method than by using the XRF (Figs. 3a, c and 4a, c).
3.2 Application to the OmanDP CM cores
The same procedure for preparation of pressed powder pellets and analysis by LA-ICP-MS has been applied for a selection of gabbro and dunite samples from the OmanDP CM holes during Leg 3. Replicates were analysed for four gabbro and three dunite samples from Hole CM1A in on-shore laboratories after Leg 3. Results are compared and discussed in Figs. 6 and 7 for gabbros and Figs. 9 and 10 for dunites. The chondrite-normalized REE and multielement patterns for both gabbros and dunites are shown in Fig. 8. The element concentrations discussed below for these core samples (both obtained by LA-ICP-MS during Leg 3 and replicate values) are given in the Supplement.
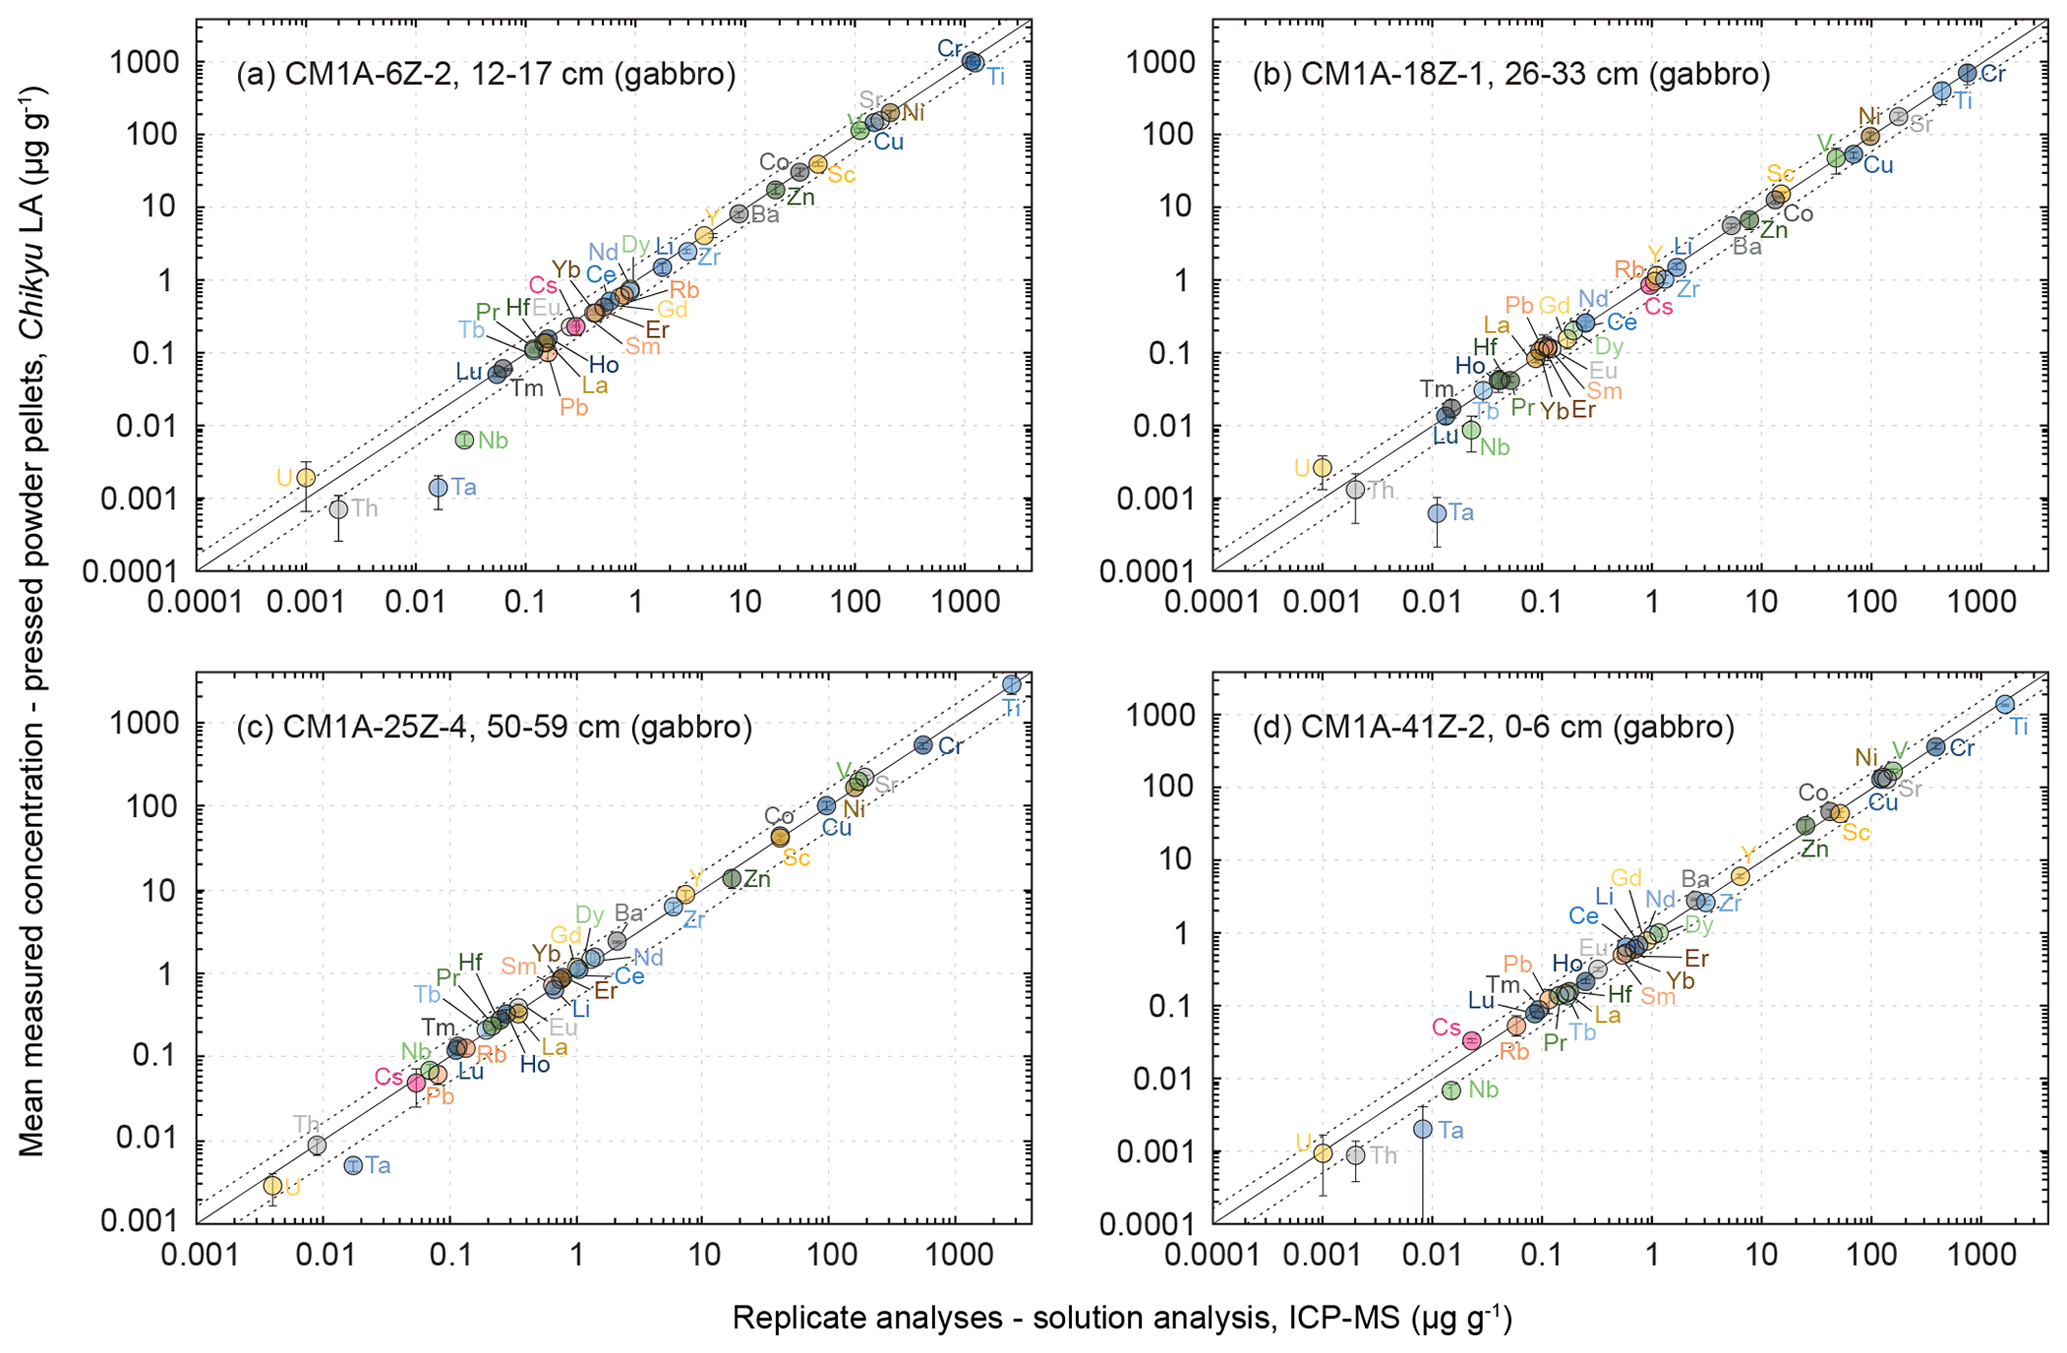
Figure 6Comparison of the mean measured concentrations obtained by LA-ICP-MS on pressed powder pellets with the analysed replicates for the same samples (solution analysis, University of Southampton, UK) for four gabbro samples from Hole CM1A. The selected samples are (a) CM1A-6Z-2, 12–17 cm (n = 5), (b) CM1A-18Z-1, 26–33 cm (n = 5), (c) CM1A-25Z-4, 50–59 cm (n = 6), and (d) CM1A-41Z-2, 0–6 cm (n = 6). The black solid line is the 1 : 1 line between the concentrations determined by LA-ICP-MS on-board the D/V Chikyu and for the replicates. The black dashed lines represent 50 % deviation from the 1 : 1 line.
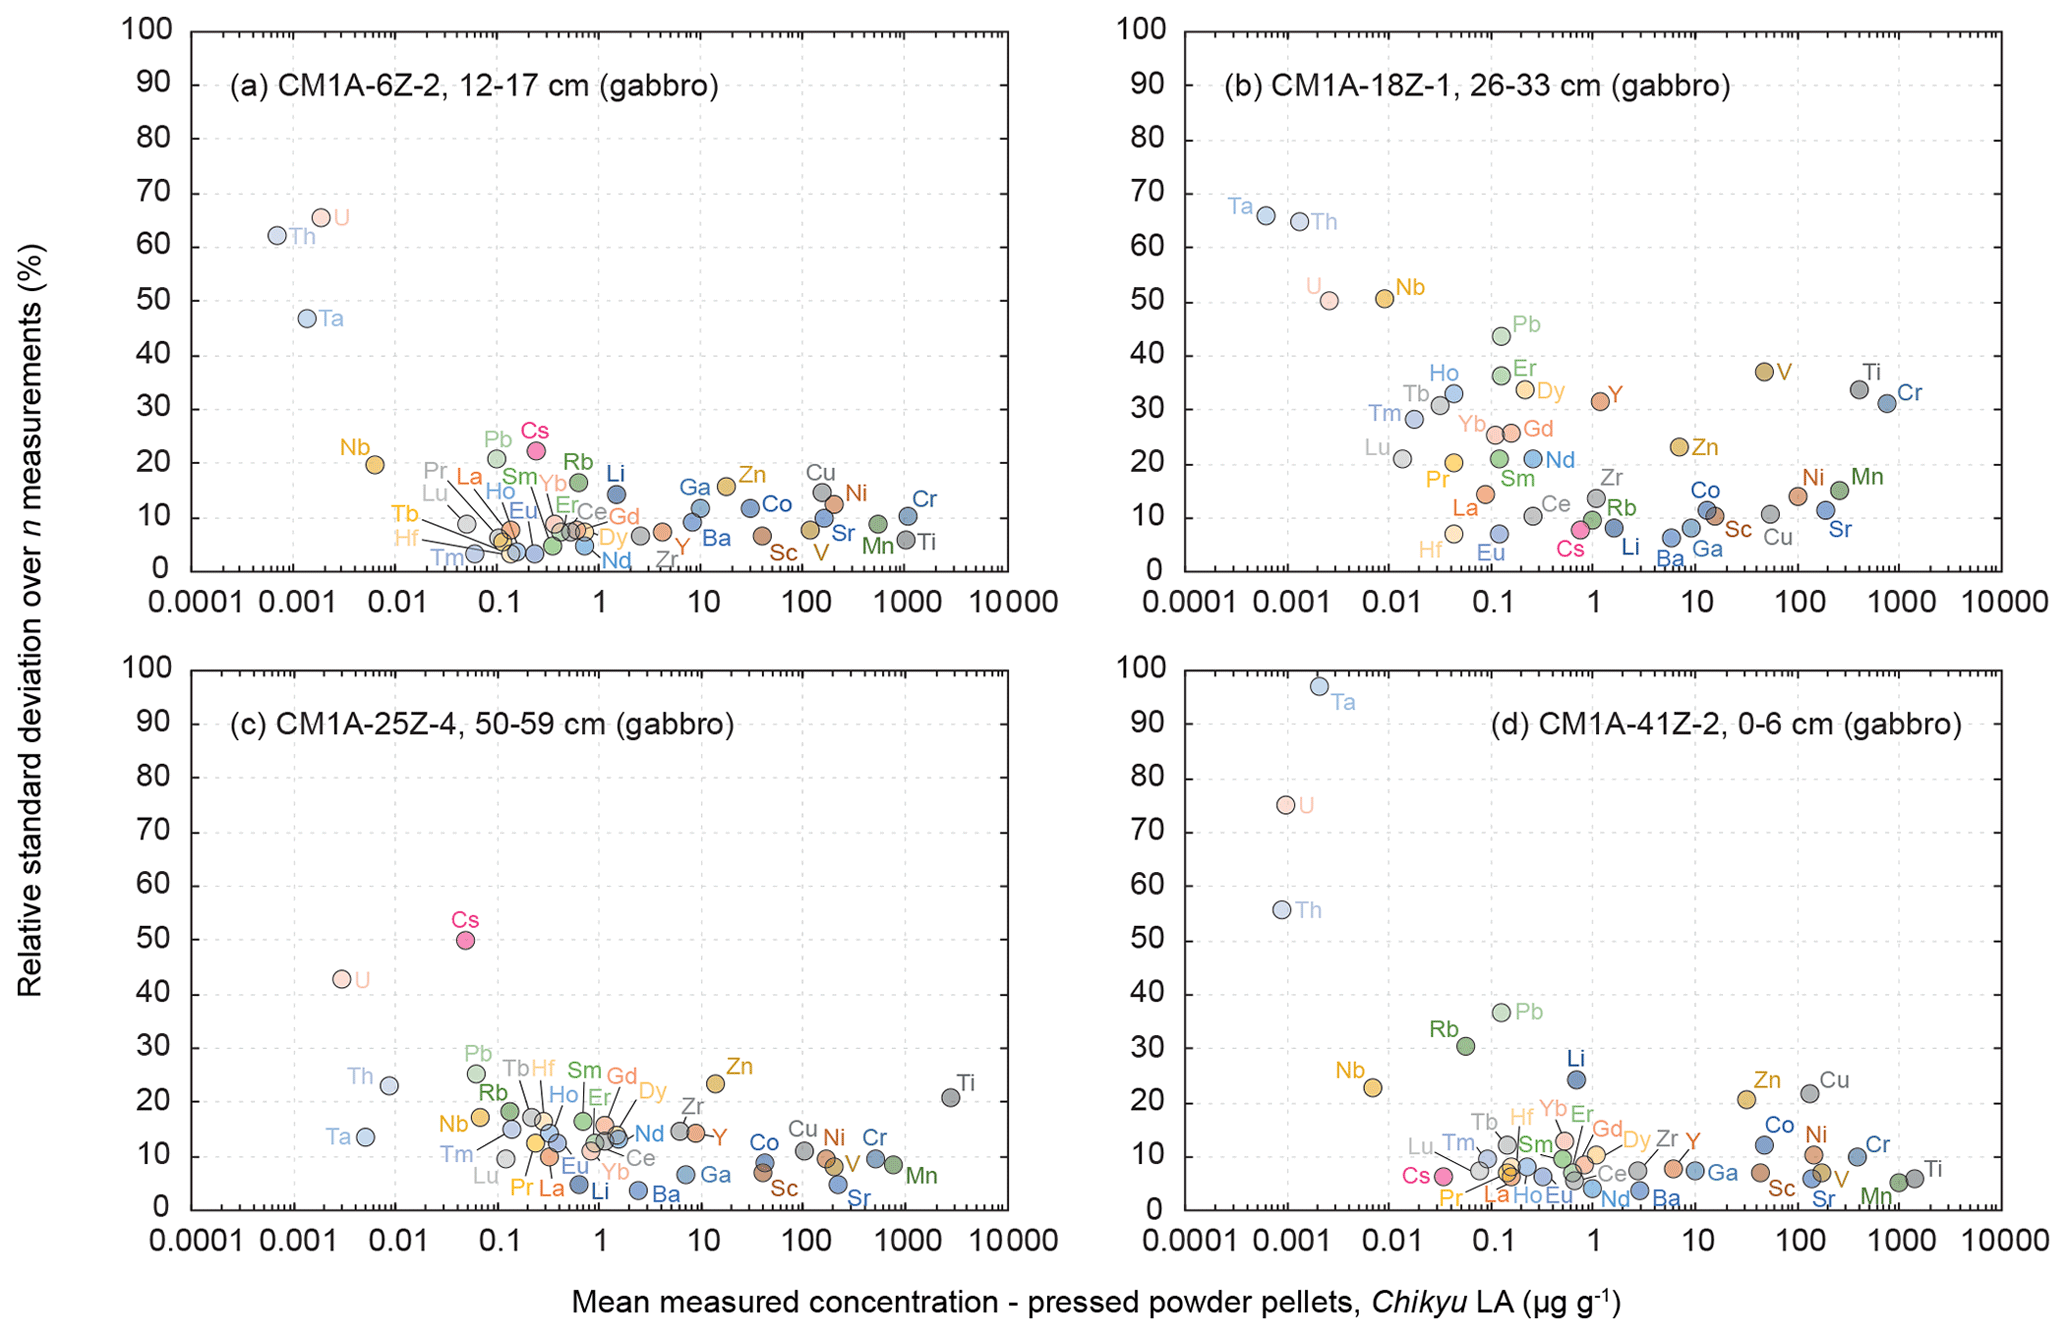
Figure 7Evolution of the relative standard deviation (RSD, in %) relative to the measured element concentrations for the four gabbro samples from the Hole CM1A (a) CM1A-6Z-2, 12–17 cm (n = 5), (b) CM1A-18Z-1, 26–33 cm (n = 5), (c) CM1A-25Z-4, 50–59 cm (n = 6), and (d) CM1A-41Z-2, 0–6 cm (n = 6).
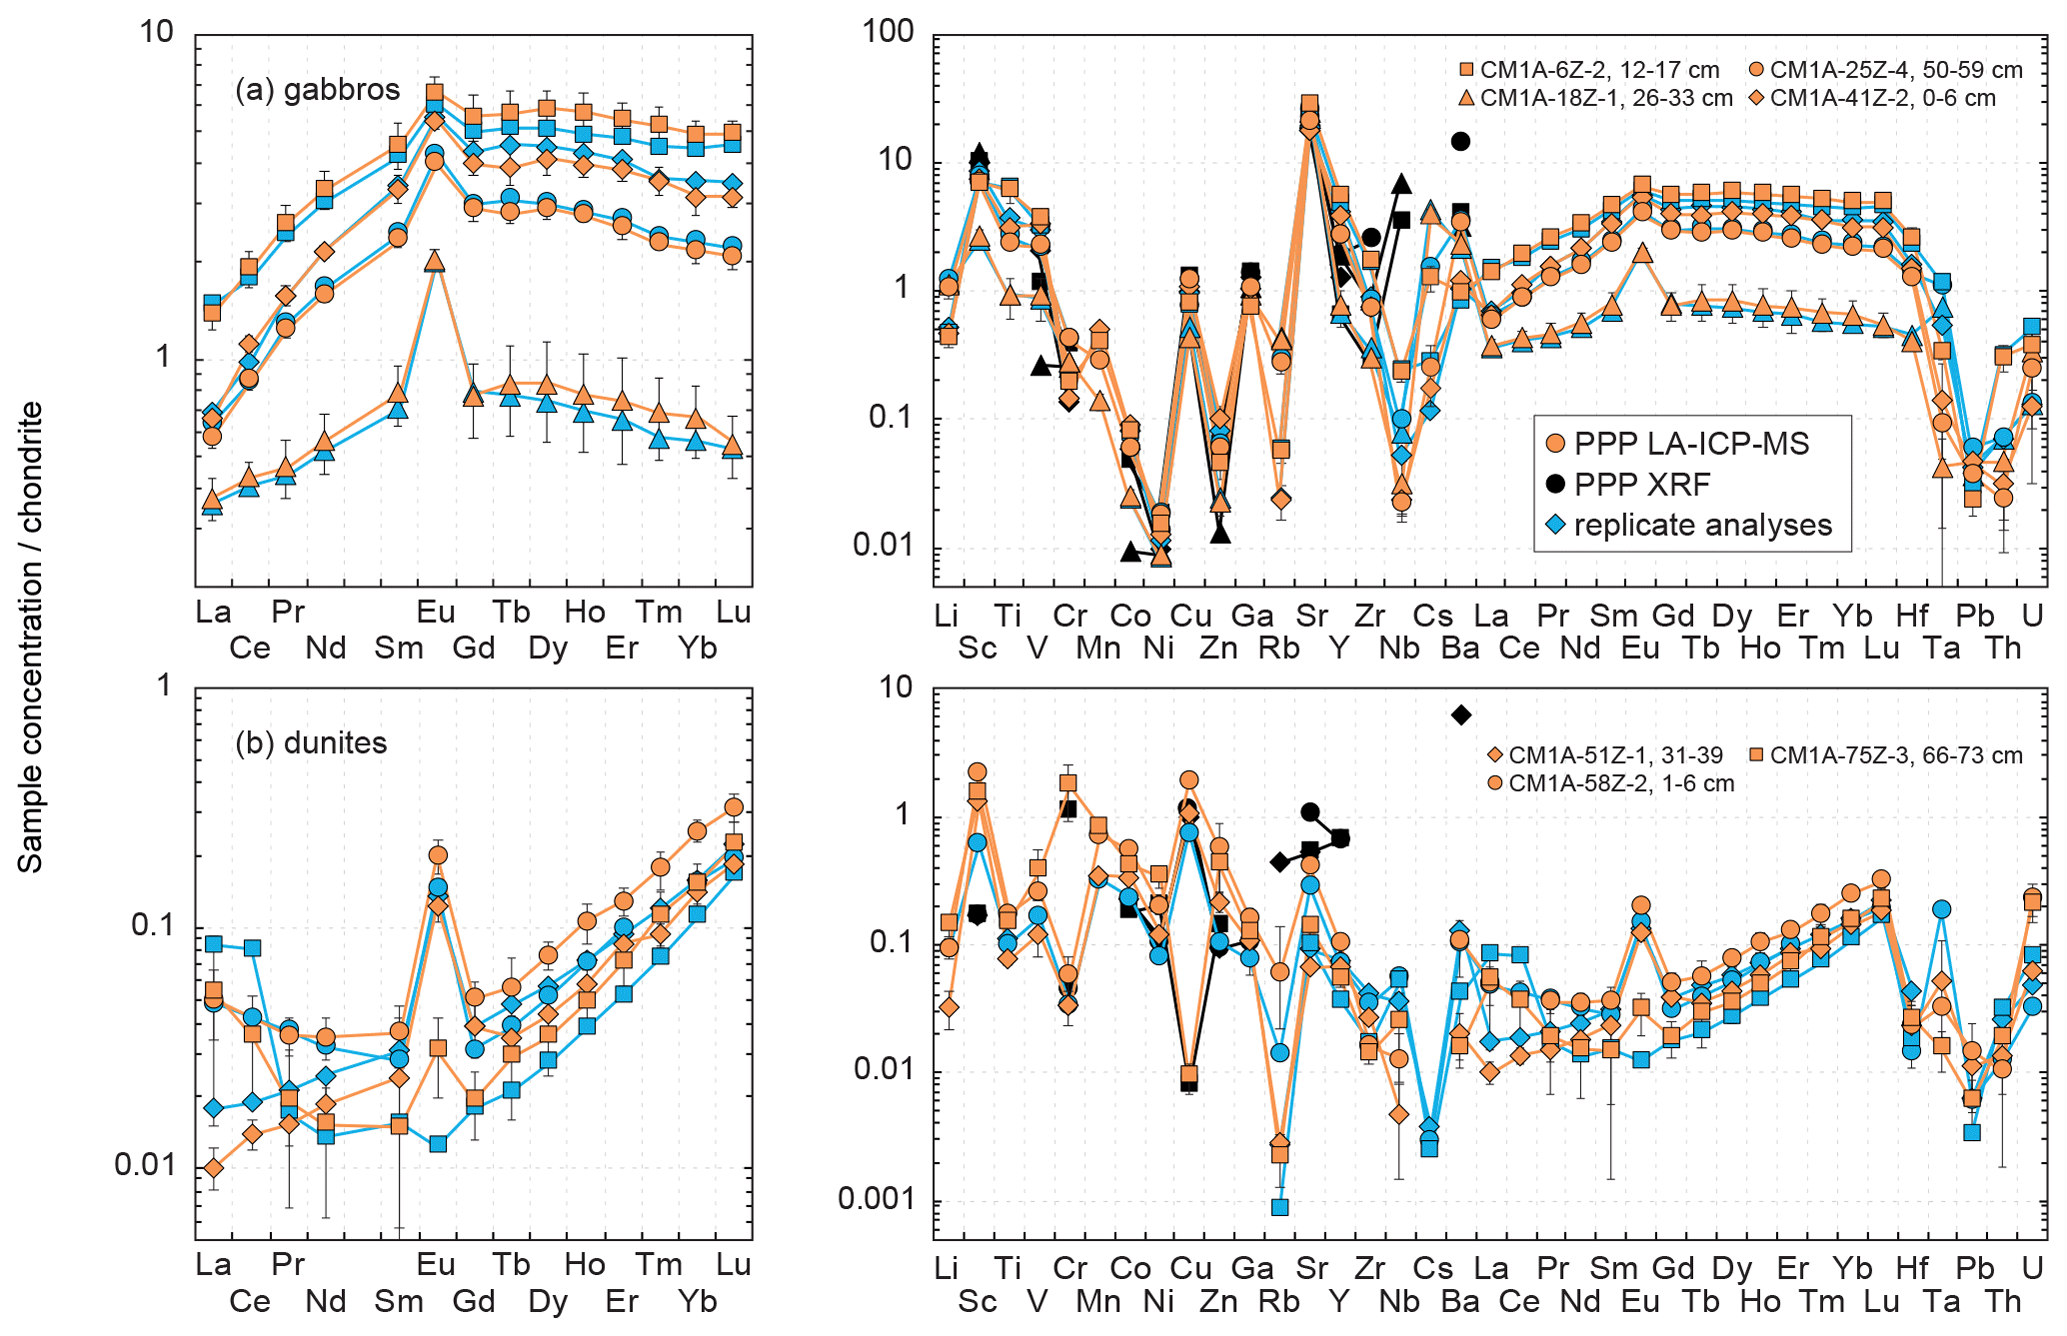
Figure 8Chondrite-normalized (normalization values from Barrat et al., 2012) REE and multielement patterns obtained for the (a) gabbro and (b) dunite samples from Hole CM1A by LA-ICP-MS and XRF analyses of pressed powder pellets on-board the D/V Chikyu, compared to replicates for the same samples.
3.2.1 Hole CM1A gabbro samples
The four gabbro samples analysed by laser ablation are CM1A-6Z-2, 12–17 cm (Fig. 6a), CM1A-18Z-1, 26–33 cm (Fig. 6b), CM1A-25Z-4, 50–59 cm (Fig. 6c), and CM1A-41Z-2, 0–6 cm (Fig. 6d). They were also analysed as replicates by solution analysis by ICP-MS at the University of Southampton (see Sect. 2.4). For all elements for which the laser ablation analyses fit with the replicate analyses (i.e. excluding the few elements not accurately determined as detailed below), the averaged δRV (relative deviation of measured concentration values from the replicate values (RV) in %) for the four samples together is +0.6 %. The difference δRV individually varies from −6.7 % (Fig. 6a) to +5.6 % (Fig. 6c), meaning that the difference between the concentrations determined by the laser ablation method developed on-board the D/V Chikyu and the replicates analysed after the Leg 3 campaign is on average lower than 7 % for each gabbro sample. Measurements by laser ablation and replicate solution analyses generally correlate well for element concentrations as low as about 50 ng g−1 (Fig. 6).
For three of the four analysed gabbros (Fig. 7a, c and d), the relative standard deviation over several measurements is, with a few exceptions, generally better than 10 to 15 % for concentrations higher than 1 to 2 µg g−1 and better than 20 % for concentrations ranging from 0.1 to 1 µg g−1. The precision decreases with lower concentrations, especially below 10 ng g−1. The measurements for the gabbro sample CM1A-18Z-1, 26–33 cm (Fig. 7b) have RSDs generally better than 20 % for concentrations higher than 1 µg g−1 and 40 % for concentrations ranging from 10 ng g−1 to 1 µg g−1. This sample also displays the lowest trace element contents over the four studied gabbros (Fig. 8a), which could explain the poorer precision.
In detail:
-
Transition elements (Sc, Ti, V, Cr, Co, Ni, Cu, Zn)
The concentrations determined using the LA-ICP-MS method for the transition elements differ on average by +0.2 % from the replicates' values, and δRV are between −4.0 % and +5.4 % for individual samples. The averaged repeatability of their measurements is better than 11.3 % for samples plotted in Fig. 6a, c, d and better than 19.4 % for the sample in Fig. 6b. With a few exceptions, the precision is better for Sc (RV = 14.5–51.0 µg g−1), Ti (RV = 420–2834 µg g−1), V (RV = 46.2–171 µg g−1) as well as for Mn and Ga (not analysed for replicates), with a repeatability generally better than 9 % than for Cr (RV = 390–1122 µg g−1), Co (RV = 12.9–41.9 µg g−1), Ni (RV = 95.9–208 µg g−1) and Cu (RV = 66.7–151 µg g−1), with a repeatability mostly better than 15 %, and especially Zn (RV = 7.48–24.8 µg g−1), with a repeatability better than 25 % (Fig. 7). The precision here is not directly related to concentrations, and precisions poorer than for other elements have also been observed for Cr, Ni and Zn for reference materials (Fig. 5). It can be related to a grain size effect between plagioclase and clinopyroxene of the gabbros that do not incorporate these elements into the same proportions, even if the n measurements (five or six) seem to be numerous enough to get an average concentration for each element fitting relatively well with the replicate values (Figs. 6 and 8). It was also shown that the sample milling (steel jaws of the crusher) or preparation of pellets (the press) could eventually slightly contaminate the powder in metal elements (Garbe-Schönberg and Müller, 2014; Peters and Pettke, 2017). Such contamination during the preparation of the pressed powder pellets is unlikely here, as in the present study, the pellets were pressed using Prolene film to isolate the powder from the load (Sect. 2.3.1), and the ablation signal was integrated in calculations only after a few seconds to discard potential surface contamination (Sect. 2.3.2).
-
Rare Earth Elements
As a whole, analyses for the four gabbro samples differ on average by +2.3 % from the replicates' values for the REEs (−5.0 < δRV < +9.8 %), and the REE patterns obtained by LA-ICP-MS fit relatively well with the ones obtained by replicate solution analyses (Fig. 8a). In detail, the intra-sample repeatability for the REEs analysed by LA-ICP-MS is better than 6.2 % (Fig. 6a; sum of RV REEs = 4.76 µg g−1), 8.3 % (Fig. 6d; sum of RV REEs = 6.64 µg g−1), and 13.4 % (Fig. 6c; sum of RV REEs = 8.61 µg g−1) but reaches 23.4 % for the sample plotted in Fig. 6b (sum of RV REEs = 1.49 µg g−1), with a poorer repeatability for the HREE (Gd-Lu: 29.3 %) than for the LREE (La-Eu: 15.7 %). The poorer precision correlates here with the lower REE contents in this sample (Figs. 7 and 8).
-
High-Field-Strength Elements (Zr, Nb, Hf, Ta) and other (ultra-)trace elements (Y, Pb, Th, U)
On average for all the samples, determined Zr (RV = 1.27–5.80 µg g−1) and Hf (RV = 49–250 ng g−1) concentrations are close to the replicates' values, with a mean δRV of −9.4 % (−16.3 < δRV < +5.7 %) and −3.8 % (−10.4 < δRV < +12.7 %), respectively. The intra-sample repeatability is better than 15 % for Zr and 10 % for Hf (excepting 16.7 % for the sample in Fig. 6c). For other HFSE, Nb and Ta are among the few elements for which the concentrations are assumed to have not been determined precisely using the LA-ICP-MS for the gabbro samples, as the obtained results do not fit with the replicates' values (RVNb = 15–70 ng g−1; RVTa = 8–17 ng g−1). The concentrations obtained for Nb are systematically underestimated by more than 50 % excepting the sample in Fig. 6c that shows a δRV = −2.8 % (with a repeatability better than 17.1 %), while Ta is on average underestimated by more than 80 % (Fig. 6). Concerning other trace to ultra-trace elements, Y (mean δRV = +5.2 %) and Pb (mean δRV = −6.6 %) are close to the replicates' values (RVPb = 82–161 ng g−1; RVY = 1.07–5.46 µg g−1), with an averaged repeatability better than 15.3 % and 31.6 %, respectively. Th, like Nb and Ta, is generally underestimated using the LA-ICP-MS method in comparison with the replicates' values, by about 40 % on average (RVTh = 2–9 ng g−1), while U is generally overestimated by about 50 % (RVU = 1–4 ng g−1). Exceptions are the concentrations for Th for the sample shown in Fig. 6c (δRV = −4.0 %, repeatability better than 23.2 %) and for U for the sample shown in Fig. 6d (δRV = −1.7 %, with a worse repeatability of 75.1 %). The apparently unreliable determination of Nb, Ta, Th and U in most gabbro samples could likely be attributed to the nugget effect related to grain sizes as evoked above. On the other hand, those elements have concentrations among the lowest in the studied gabbros (Fig. 7), and we thus attribute this unreliable determination to instrumental limitations with the used equipment.
-
Lithium and large-ion lithophile elements (Rb, Sr, Cs, Ba)
The concentrations obtained by LA-ICP-MS for Li in the gabbro samples are relatively close to the replicates' values (RVLi = 0.67–1.75 µg g−1), with δRV = −8.4 % on average (−15.1 < δRV < −4.0 %; Figs. 6 and 8), with a repeatability better than 13.0 % on average (Fig. 7). Measured Cs concentrations are slightly underestimated for samples in Fig. 6a, b and c (−16.1 < δRV < −7.0 %) but significantly overestimated for the sample in Fig. 6d (δRV 50.1 %, with RVCs = 22–813 ng g−1). The repeatability for Cs is also variable, comprised between 6.3 % and 22.4 % for samples in Fig. 6a, b and d, but reaching 50.2 % for the sample in Fig. 6c. In detail, the Cs content for the samples in Fig. 6a and b is 286 and 813 ng g−1, respectively, and 22 and 54 ng g−1 for the samples in Fig. 6c and d, respectively. These lower concentrations explain the higher deviation from replicate values and/or the poorer precision for these two latter samples. For other LILE (Rb, Sr, Ba), the obtained results are close to the replicates' values, with an averaged δRV of +2.5 % for these three elements (57 ng g−1 < RVRb < 1.02 µg g−1; RVSr = 137–189 µg g−1; RVBa = 2.09–8.54 µg g−1). The determination of Rb is slightly more accurate (−8.3 < δRV < −2.6 %; mean −5.1 %) than for Sr (−8.9 < δRV < +16.9 %, mean +4.3 %) and Ba (−5.5 < δRV < +14.8 %, mean +8.2 %). The repeatability over the different measurements is on average better than 18.7 % for Rb, 8.0 % for Sr, and 5.8 % for Ba (Fig. 7). The precision here is thus better, with higher concentrations (Sr and Ba), while the accuracy (lower deviation from the replicate values) is better for the less concentrated Rb.
According to the presented results, the lowest concentrations assessed with a high accuracy and good precision (e.g. repeatability better than 10 %) for the gabbro samples fall within the range 50 to 100 ng g−1 (Figs. 6 and 7). For a few exceptions we were able to accurately determine concentrations as low as nearly 1 to 10 ng g−1 but generally with a poorer repeatability (Fig. 7). For example, we measured concentrations of 13.5 ng g−1 for Lu, with a repeatability better than 21.2 % (CM1A-18Z-1, 26–33 cm; Fig. 6b), 8.6 ng g−1 for Th with a repeatability better than 23.2 % (CM1A-25Z-4, 50–59 cm; Fig. 6c), and 0.98 ng g−1 for U with a repeatability better than 75.1 % (CM1A-41Z-2, 0–6 cm; Fig. 6d).
3.2.2 Hole CM1A dunite samples
The three dunite samples analysed by laser ablation and as replicates are CM1A-51Z-1, 31–39 cm (Fig. 9a), CM1A-58Z-2, 1–6 cm (Fig. 9b), and CM1A-75Z-3, 66–73 cm (Fig. 9c). We will focus here only on the results obtained for the REE, HFSE and other trace to ultra-trace elements in order to evaluate the accuracy on the lowest concentrations (mainly below 100 ng g−1, right part of Fig. 9) reachable using the sample preparation procedure and laser ablation method developed on-board the D/V Chikyu.
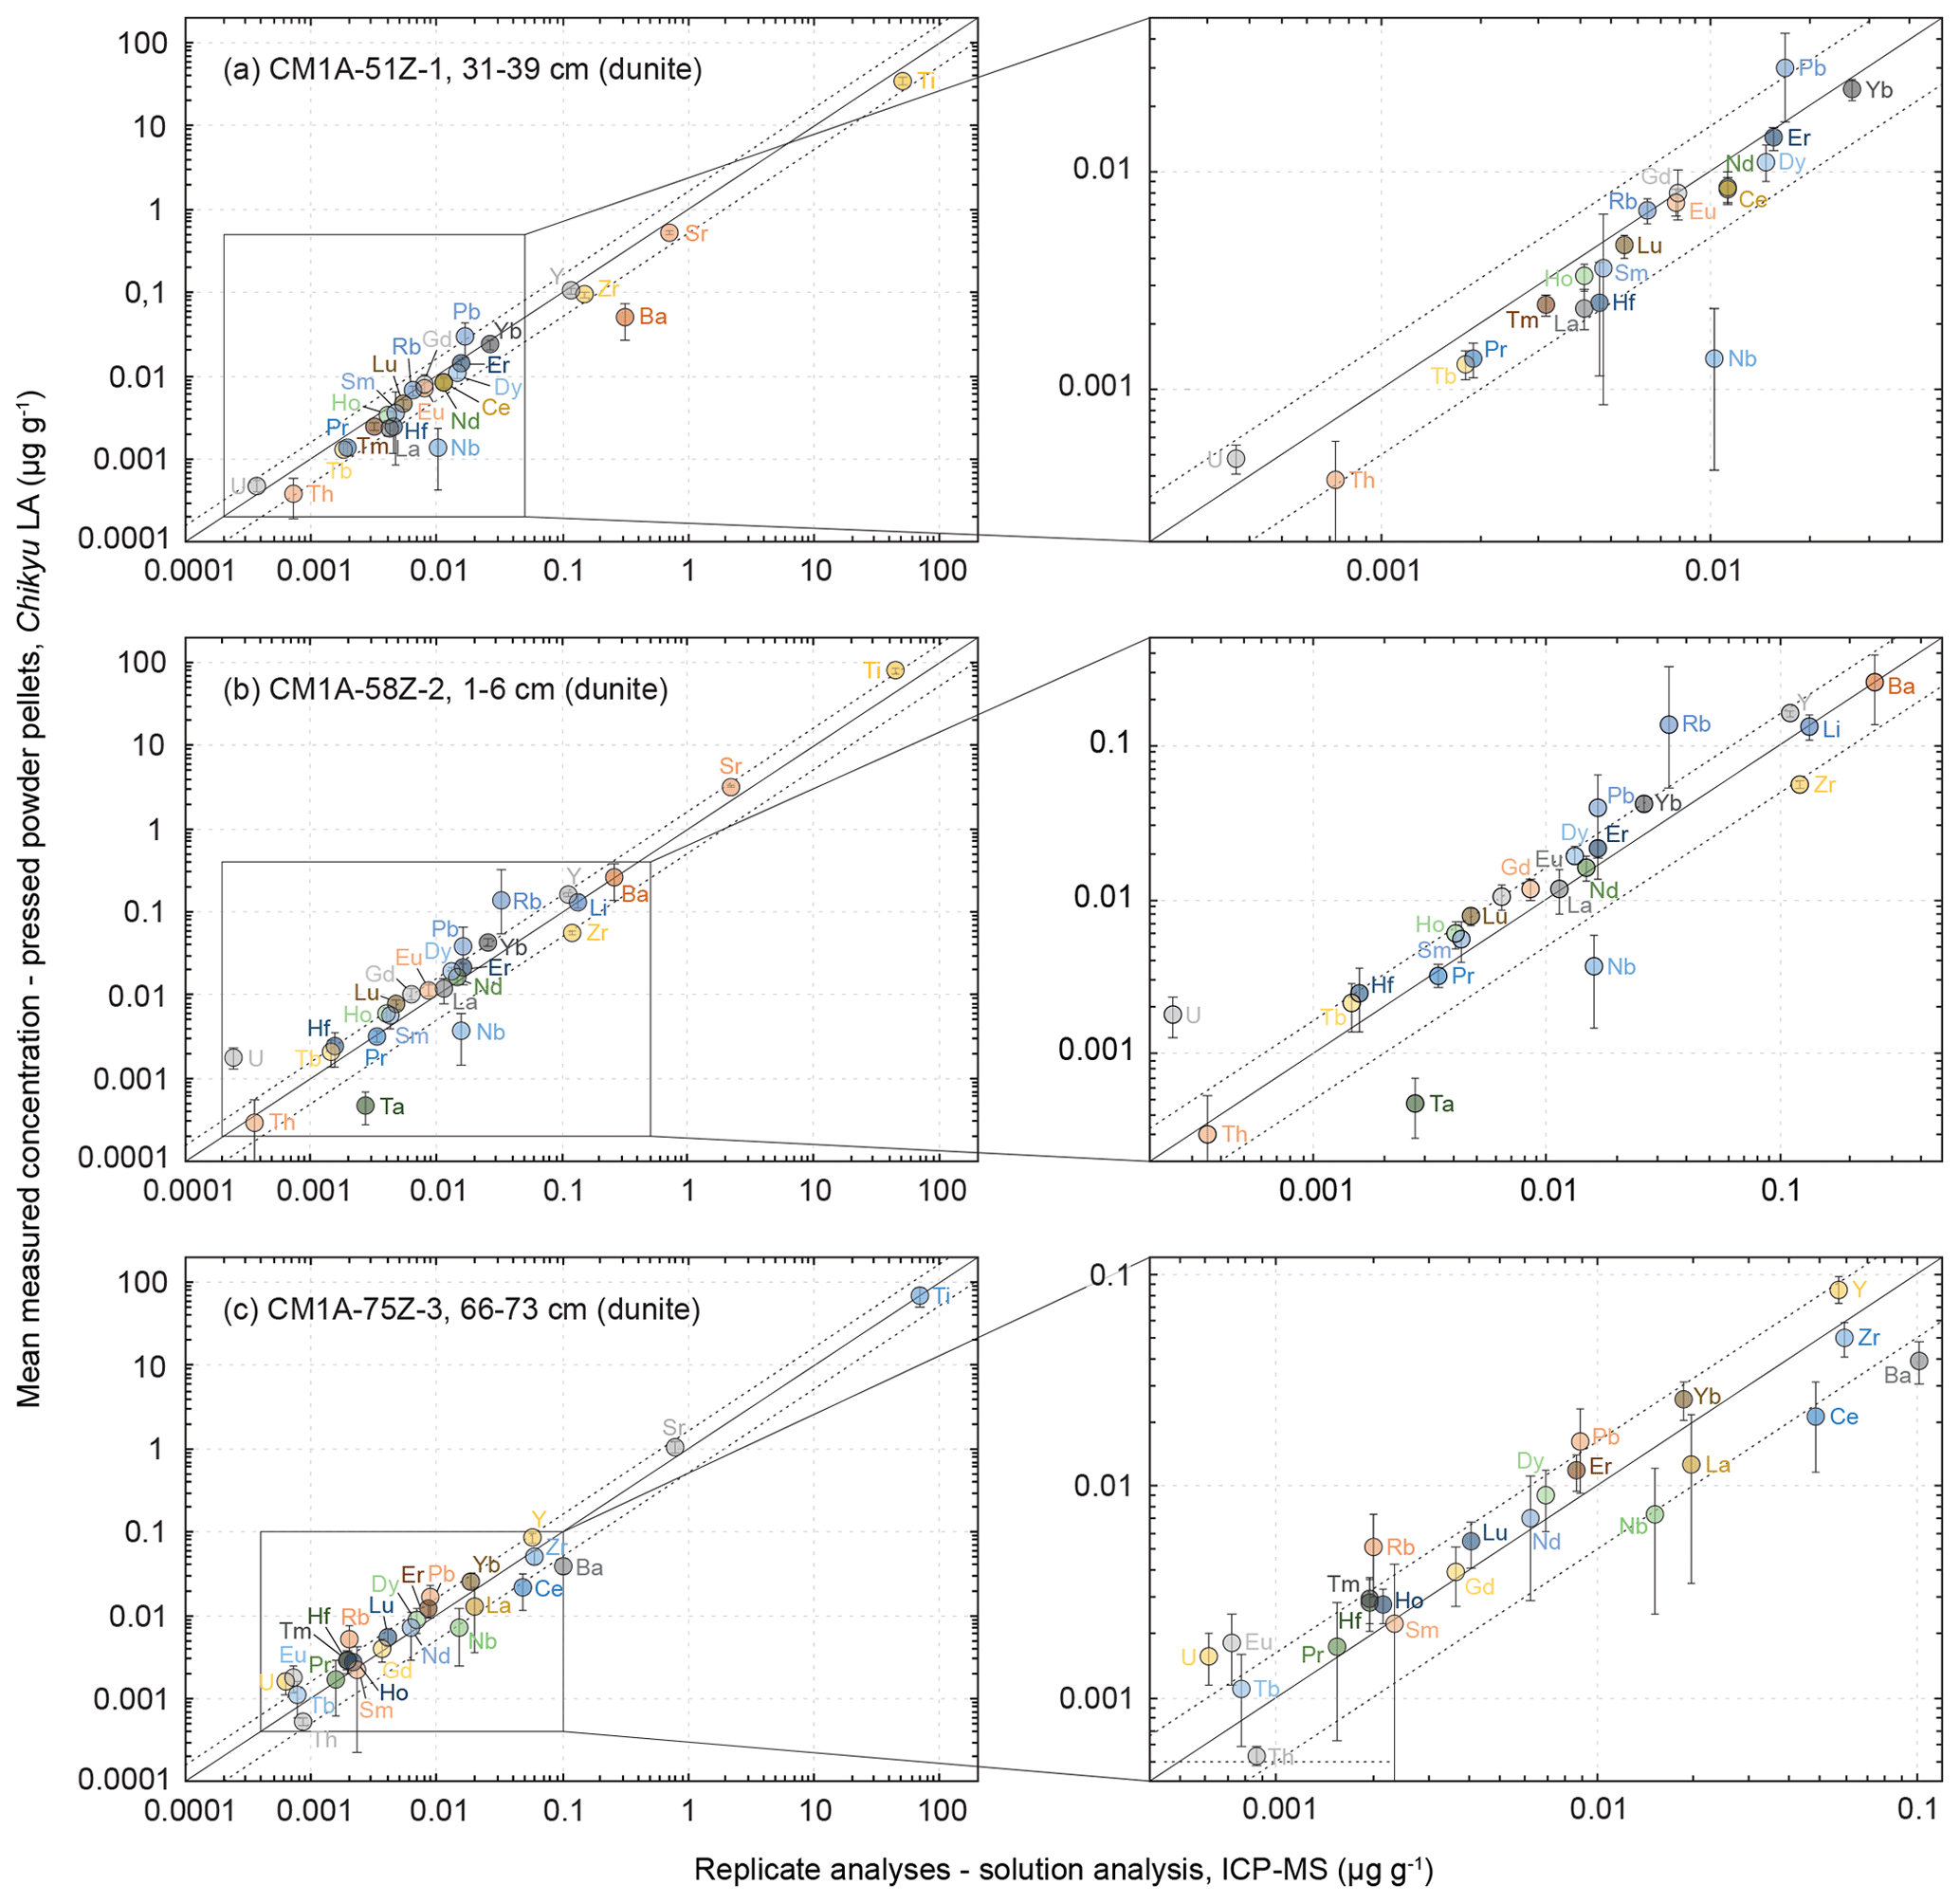
Figure 9Comparison of the mean measured concentrations obtained by LA-ICP-MS on pressed powder pellets with the analysed replicates for the same samples (solution analysis, IES-AS (Taiwan) for samples in (a) and (c) and GET (France) for the sample in (b)) for three dunite samples from Hole CM1A. The selected samples are (a) CM1A-51Z-1, 31–39 cm (n = 6), (b) CM1A-58Z-2, 1–6 cm (n = 6), and (c) CM1A-75Z-3, 66–73 cm (n = 5). The black solid line is the 1 : 1 line between the concentrations determined by LA-ICP-MS on-board the D/V Chikyu and for the replicates. The black dashed lines represent 50 % deviation from the 1 : 1 line.
The measured REE concentrations and the chondrite-normalized REE patterns differ between results obtained by the LA-ICP-MS method and the replicates (Figs. 8b and 9), but only moderately considering that the REE concentrations are mostly below 25 ng g−1 in these dunite samples (e.g. RVLa = 4–20 ng g−1; RVSm = 2–5 ng g−1; RVYb = 19–27 ng g−1). As a whole for the three dunite samples, REE concentrations determined by laser ablation differ on average by +11.0 % from the replicates' values. For individual samples, the concentrations appear slightly to moderately underestimated for the sample in Fig. 9a (δRV = −20.2 %) and overestimated for the samples in Fig. 9b and c (δRV 22.5 % and +24.4 %, respectively) in comparison with the replicates' values. In detail, the LREE (La–Eu) are on average generally slightly underestimated (δRV = −8.8 %), especially in La and Ce, while the HREE (Gd–Lu) are slightly overestimated δRV 14.3 %). It is the reverse trend of the one observed for the slightly overestimated LREE and underestimated HREE in the reference materials (Fig. 3 and Sect. 3.1.2). The repeatability is on average about 20 % for the samples in Fig. 9a and b and reaches 40 % for the sample in Fig. 9c. In detail, the precision decreases with the decreasing concentration in REEs, especially concerning samples in Fig. 10b and c. For sample CM1A-58Z-2, 1–6 cm (Fig. 10b), the RSD increases from about 10 % for REEs with a concentration near 20 ng g−1 to 35 % for concentrations near 2 ng g−1. For sample CM1A-75Z-3, 66–73 cm (Fig. 10c), the RSD roughly increases from 20 % (25 ng g−1) to 45 % (1 ng g−1). Concerning sample CM1A-51Z-1, 31–39 cm in Fig. 10a, the precision is better than 20 % for all REEs excepting Gd (RSD = 25.7 %). Similarly to the reference materials and gabbro samples for some elements, the stronger deviation from replicate values together with the poorer precision for the sample in Figs. 9c and 10c correlate with the lower measured REE contents.
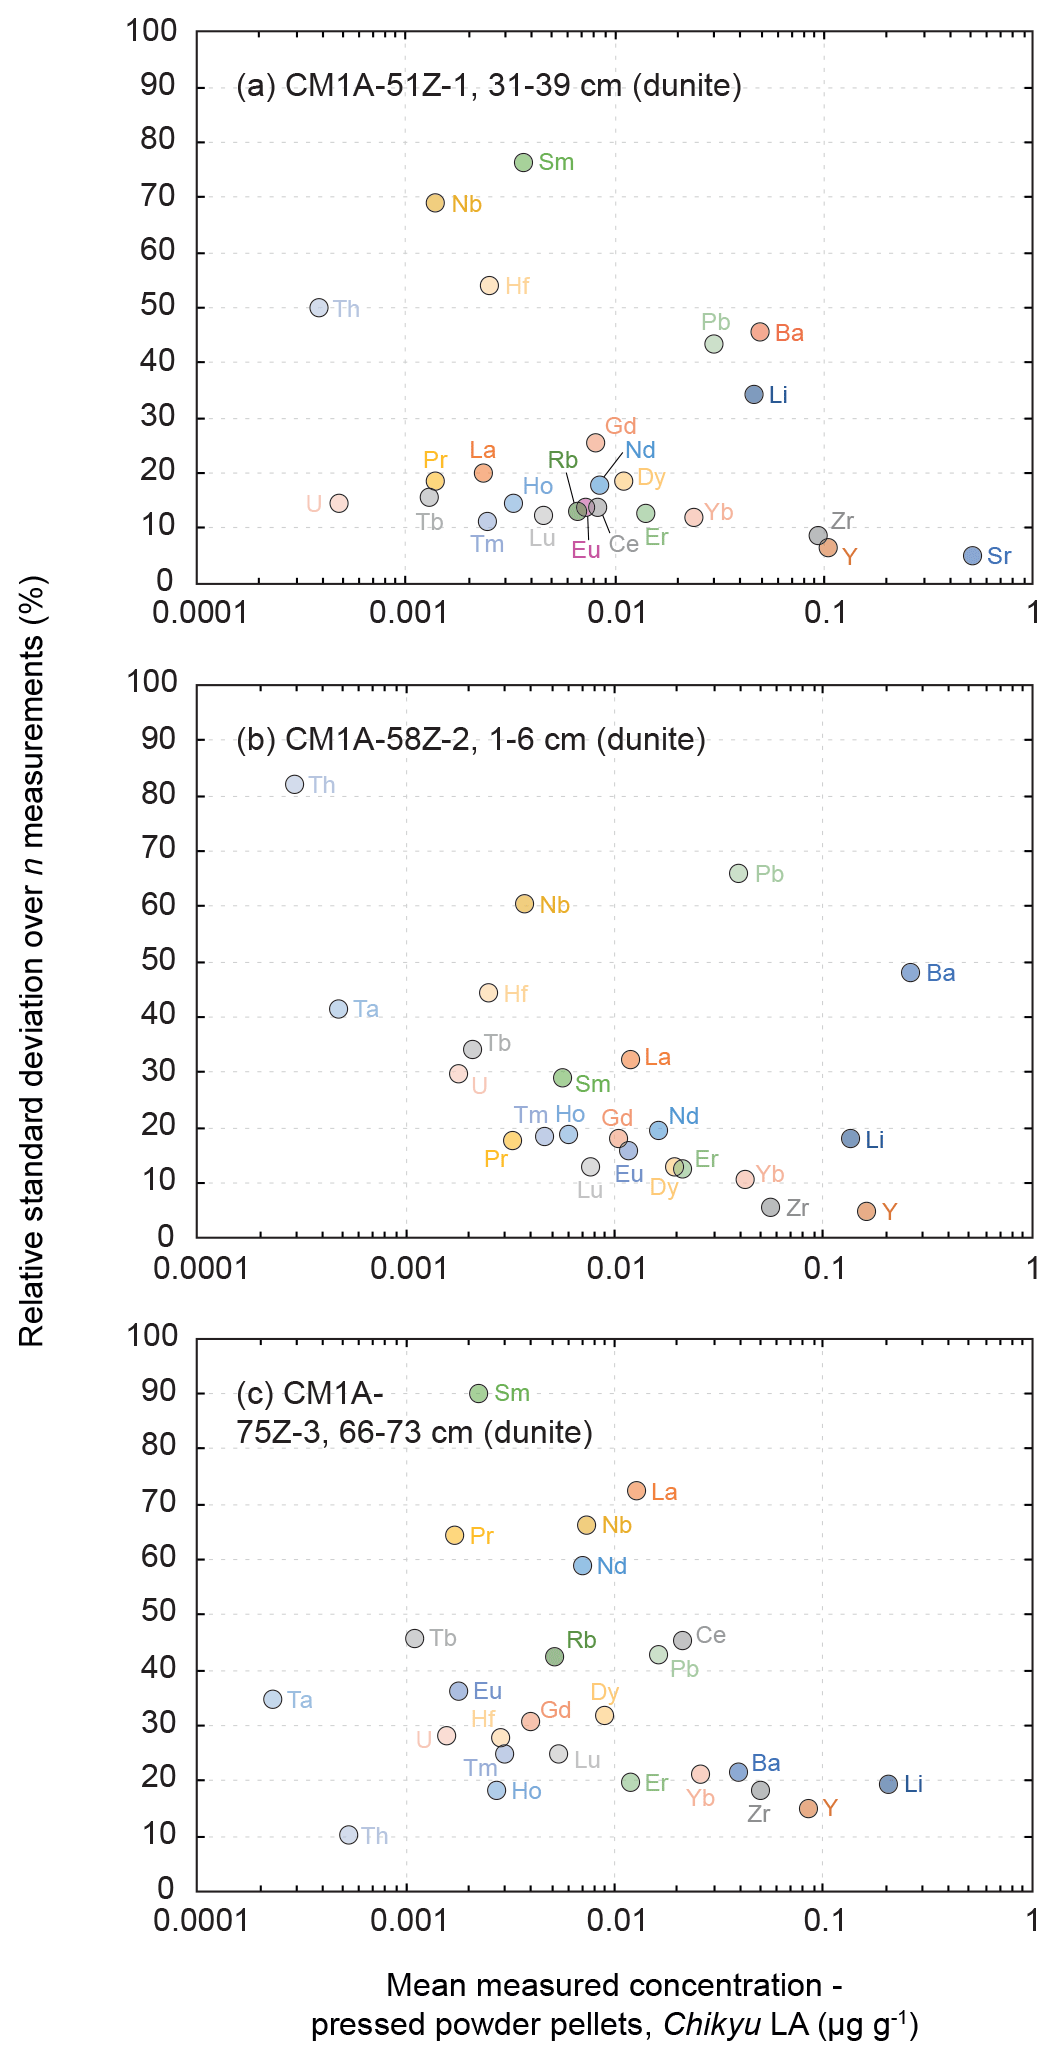
Figure 10Evolution of the relative standard deviation (RSD, in %) relative to the measured element concentrations for the three dunite samples from the Hole CM1A (a) CM1A-51Z-1, 31–39 cm (n = 6), (b) CM1A-58Z-2, 1–6 cm (n = 6), and (c) CM1A-75Z-3, 66–73 cm (n = 5).
Concerning the HFSE, only the concentrations for Hf (averaged δRV = +19.1 %, averaged repeatability better than 42.2 %) and Zr for the sample in Fig. 9c (δRV = −16.2 %, repeatability better than 18.2 %) were determined with a deviation of less than 20 % from the replicates' values (RVHf = 2 ng g−1 and RVZr = 60 ng g−1 in this sample). The Nb and Ta were significantly underestimated by more than 70 % and 80 %, respectively, using the laser ablation method, similarly to the results obtained for the gabbro samples. It is likely related to the analytical difficulty of precisely determining such elements (e.g. Ionov et al., 1992; Jochum et al., 1990; Weyer et al., 2002) and/or to their low concentrations in such depleted dunites. For example, the determined concentrations for Nb were comprised between 1.4 and 7.3 ng g−1 when analysed by laser ablation on-board the D/V Chikyu and between 10.3 and 15.9 ng g−1 for the replicates' values. Similarly, the determined concentrations for Ta were between 0.2 and 0.8 ng g−1 by laser ablation analyses and 2.7 ng g−1 for one replicate analysis only. The Th concentration is likewise moderately to significantly underestimated (averaged δRV = −34.3 % with RVTh = 0.4–0.9 ng g−1, except −16.5 % for the sample in Fig. 9b but with a poor repeatability of 82.3 %). By contrast, Pb and U are systematically strongly overestimated (RVPb = 9–17 ng g−1, RVU = 0.2–0.6 ng g−1; Fig. 9), once again reminiscent of what was observed for the gabbro sample.
To summarize, the analysis of the dunite samples using the LA-ICP-MS method developed on-board the D/V Chikyu allowed us to determine the REE concentrations with a relatively good accuracy with regard to their very low contents in such lithologies and to reach concentrations about an order of magnitude lower in dunites (sum of REEs = 0.10–0.16 µg g−1) than in gabbros (sum of REEs = 1.6–9.5 µg g−1). Regarding these results, the lowest REE contents assessed with relatively high accuracy and good precision (e.g. repeatability better than 20 %) for the dunite samples are as low as 1.5–2 ng g−1. Except for Hf, which seems to have been determined relatively accurately, the accurate determination of concentrations in other HFSE (especially Nb and Ta) and (ultra-)trace elements (Pb, Th, U) appears to be beyond the analytical limitations of the developed method. However, it is worth noting that the concentrations determined by LA-ICP-MS roughly follow the 1 : 1 line when plotted as a function of the replicates' values (Fig. 9). The analysed elements are as a whole globally slightly underestimated (Fig. 9a) or overestimated (Fig. 9b, c) for a given dunite sample, independently of the laboratory which analysed the replicates, IES-AS (Taiwan) for Fig. 9a and c and GET (France) Fig. 9b, and do not plot randomly. It thus cannot be ruled out that a part of the difference from the replicates may be due to a slight uncertainty related to their analysis in these two external laboratories after Leg 3.
3.3 Effects of the two-step milling
In order to briefly illustrate the necessity of a second-step milling to obtain an average powder grain size fine enough to obtain reliable results for the determination of whole-rock trace elements by LA-ICP-MS, the chondrite-normalized patterns obtained for pressed powder pellets milled one time only (to the left) and two times (in the centre) are shown in Fig. 11. The three examples are the reference materials BIR-1a and BHVO-2 and the gabbro sample CM1A-6Z-2, 12–17 cm. For BIR-1a and the gabbro sample, the different grain sizes after one-step and two-step millings are shown in Fig. 2.

Figure 11Comparison of the chondrite-normalized (normalization values from Barrat et al., 2012) REE patterns obtained for the reference materials (a) BIR-1a and (b) BHVO-2 and for (c) the gabbro CM1A-6Z-2, 12–17 cm after LA-ICP-MS analyses of one-time milled pressed powder pellets (left) and of two-time milled pressed powder pellets (centre). The determined concentrations show a greater variability after only one milling step, and the averaged compositions (right) differ significantly from the results obtained both after the second-step milling and for the replicates.
The chondrite-normalized REE patterns for individual analyses are much more variable when obtained for one-time milled pressed powder pellets. This is observed for all elements for BIR-1a (Fig. 11a) and BHVO-2 (Fig. 11b) and particularly for HREEs in the gabbro sample (Fig. 11c). The mean measured concentrations for BIR-1a are slightly overestimated in the lighter REEs (> 21 % for La and Ce) and significantly underestimated in HREEs, by 22 % on average from Gd to Lu, relative to preferred values and to the results obtained for the pellet prepared with powder two-time milled (to the right in Fig. 11a). Similar bias in the determination of the REE concentrations has been obtained in analysing a one-time milled pressed powder pellet prepared for the reference material BHVO-2 (+17 % for the LREELa-Eu and −14 % for the HREEGd-Lu), in addition to a slight positive Eu anomaly (Fig.11b). For the gabbro sample CM1A-6Z-2, 12–17 cm, all the REEs are significantly overestimated, by about 40 % on average (Fig. 11c). These examples illustrate well that trace element analysis by LA-ICP-MS of pressed powder pellets with too coarse a grain size produce unreliable results (see also Garbe-Schönberg and Müller, 2014). Such unreliable whole-rock compositions likely result from analyses dominated by individual mineral-phase compositions, as illustrated by the grain sizes presented in Fig. 2. For example, several analyses for the gabbro sample CM1A-6Z-2, 12–17 cm will successively be dominated by clinopyroxene (green grains in Fig. 2c) or plagioclase (whitish grains in Fig. 2c) rather than by a homogenized, fine mix of all the phases.
In this article we show that the method developed for sample preparation of fine-grained pressed powder pellets analysed by LA-ICP-MS allows the determination of (ultra-)trace element concentrations on-board the D/V Chikyu. It enables the accurate determination at sea of concentrations by 4 to 5 orders of magnitude lower than the ones reachable previously using on-board XRF. According to the results obtained for the reference materials and gabbro samples from the Oman Drilling Project Hole CM1A, reliable results with a high accuracy and a precision better than 10 % can be achieved for elements with concentrations in the range 50–100 ng g−1 and higher (e.g. transition elements, REE for BHVO-2, BIR-1A and part of the gabbros). Regarding the presented results for the reference material JP-1 (peridotite) and the dunites from CM cores, analysed to test the limitations of the method, reliable results with a precision better than 20 % to 25 % can be achieved for concentrations as low as 1–2 ng g−1, especially for the REEs. For a few exceptions, lower concentrations have been analysed (e.g. Th = 0.3 ng g−1 for the sample in Fig. 9b) but with a poorer repeatability related to the limits of detection. The presented method does not yet allow the accurate determination of ultra-trace element concentrations in depleted dunites from the oceanic crust–mantle transition nor mantle peridotites as low as those analysed by ICP-MS after acid digestion, and some elements such as HFSE are still difficult to determine precisely. Indeed, mantle peridotites and especially dunites are known to be highly depleted in trace elements with concentrations in middle Rare Earth Elements such as Sm or Eu or in other elements such as Ta, Th or U, regularly below 1 ng g−1 (for solely the Oman ophiolite, e.g. Gerbert-Gaillard, 2002; Godard et al., 2000, 2008; Hanghøj et al., 2010; Le Mée et al., 2004; Monnier et al., 2006; Rospabé, 2018; Rospabé et al., 2018b, 2019; Takazawa et al., 2003). In addition, the signal during solution ICP-MS measurements generally has a greater stability than laser ablation signals. Here we show both for the reference materials and OmanDP core samples that the accuracy and precision decrease with decreasing element concentrations (Figs. 5, 7 and 10), allowing us to consider the unreliable results, at first order, to be directly related to instrumental limitations. However, the obtained results are promising, and further adjustments of the operating conditions could improve this safe, “dry” (acid-free) method to routinely analyse trace to ultra-trace elements at sea during ocean drilling operations. It could be adapted to other research topics such as (paleo-)volcanism (e.g. Sato et al., 2020) and applied to other materials such as sedimentary cores for chemostratigraphic studies – for the analysis of metal- and/or REY-rich sediments as an example for recent studies in the North Pacific Ocean (Tanaka et al., 2020a, b; Yasukawa et al., 2018, 2020) – and be extended to the analysis of other chemical elements which were not investigated here.
In addition to a possible analytical limitation regarding accurate assessment of very low concentrations, a few other limitations have to be considered in the application of this new technical tool on-board the D/V Chikyu. In particular, this procedure needs more time to perform the second milling step for the preparation of fine-grained pressed powder pellets and for the laser ablation analyses in comparison with the one-time milled pellets routinely analysed by XRF for their concentrations in major, minor and some trace elements.
-
The diameter of the agate balls used for the second milling step was 20 mm. A smaller diameter could be used. For example, 10 mm-large balls have been acquired and used on-board the D/V Chikyu during Leg 4, following Leg 3 during which we developed the method described in the present article (Kelemen et al., 2020), but agate balls even smaller than 10 mm exist. The use of such smaller agate balls has two potential advantages. First, it could allow us to mill the samples more quickly, allowing time gains during the sample preparation procedure. Second, it could allow us to mill the powder to a finer grain size that could in turn make the pressed powder pellets more homogeneous and thus the signal more stable during measurements and the results more reliable. In addition, a wet milling using water for the second milling step might further reduce the grain size and improve the pellet homogeneity, as shown by Garbe-Schönberg and Müller (2014) and Peters and Pettke (2017). Accordingly, a possible “nugget effect” as evoked earlier (see also Peters and Pettke, 2017) could be minimized.
-
Following the different steps tested during Leg 3, it appears that a minimum of three analyses on each sample is the minimum required to account for the sample powder heterogeneity so that the averaged compositions are adequately close to reference or preferred values. In the examples we presented and especially for the dunite samples that are particularly depleted in (ultra-)trace elements, we decided to perform a minimum of five or six measurements per sample to improve the repeatability and more accurately determine the lowest concentrations. Further improving the two-step milling process could allow for a reduction in the number n of replicate measurements, especially if an analytical sequence is made of alternating analyses on reference glasses and pressed powder pellet samples to ensure the measurements are not affected by the different matrix.
-
The current procedure requires changing of sample pellets – and thus opening of the laser ablation sample cell – between each sample. An alternative design for the two-time milled pellets, with a smaller diameter, could allow loading of two or more samples at the same time in the laser ablation sample cell. In addition, modifications to the settings of the laser ablation system could allow us to set a laser spot larger than the maximum size (100 µm large in diameter) used in the present study and thus be complementary to the improvement of the preparation procedure of the pressed powder pellets.
-
In the course of the 30 d-long Leg 3, during which we developed the presented method, we did not perform a procedural blank related to (1) the crushing of the samples and to (2) the second milling step and pressed powder pellet preparation.
- a.
Indeed, it has been shown that the milling can slightly contaminate the powder (Peters and Pettke, 2017), especially with metals and trace elements when using a crusher with steel jaws. After the 14 and 7 mm crushing steps, samples were sieved at 250 µm, and smaller particles that passed through were discarded to avoid possible cross-contamination with the previously crushed sample and possible tiny steel sequins from the jaws. The contamination of the powder by the steel jaws during the next two crushing steps would result in tiny sequins irregularly distributed within the pressed powder pellets and subsequently would allow highly variable ablation signals for a given element compared to the homogenized signal during the replicate solution analyses of the same samples (same powders). The good correlation between element concentrations measured by laser ablation and replicate analyses for many elements allows us to estimate such potential contamination as unlikely or very limited – we processed five or six measurements per sample, while probably tens of measurements would be required to get a homogeneous integration of the whole sample plus the potential, irregularly distributed contamination to reproduce the replicate values if the powder was contaminated during the sample crushing step. In the present study, such contamination is thus considered unlikely, and the inaccurate measurements associated with poorer precision observed for the elements with the lowest concentrations are at first order attributed to instrumental limitations. In addition, the used Jaw Crusher Retsch BB50 was new, and this model is well adapted to gently crush small samples, but to check the possible blank contribution could be useful through time to ensure the crushing step does not contaminate the samples after many uses of the crusher.
- b.
Concerning the second milling step and pressed powder pellet preparation, we used Prolene film to isolate the surface powder from the load, as described in Sect. 2. In addition, the ablation signal was integrated in calculations after only a few seconds to discard potential surface contamination. The reliable results obtained for the three analysed reference materials show that the second step milling and pressed powder pellets preparation do not induce any contamination.
- a.
-
In the present study, 29Si was used as an internal standard and the calculations performed using the SiO2 content (reference values or certificate for standards, determined by XRF on-board during Leg 3 for the OmanDP samples). We chose this internal standard as SiO2 was expected to be highly concentrated in all the analysed reference materials and core samples. As an example, 42Ca, which is regularly used as an internal standard for laser ablation analyses, could not be applied to dunites that have a too low CaO content. However, the milling bowl and balls are made of agate, and it cannot be ruled out that the balls could be slowly abraded over time and possibly variably contaminate the powder with silicon. Such contamination can be excluded concerning the second milling step as we were able to precisely determine the chemical compositions for the three analysed standards (Sect. 3.1), but the first milling step using two different sizes of agate balls could eventually be more critical through time. In the present study, we were able for many elements to reproduce by laser ablation analyses, using 29Si as an internal standard, the replicate values obtained by solution analyses using other internal standards (In, Re and Be for gabbros, In or Tm for dunites). In the course of future ship-board operations, other internal standard elements could be adapted for the trace element analyses at sea, particularly for lithologies with a low silica content (e.g. carbonates).
-
The argon gas supply on-board the D/V Chikyu is currently limited to 4230 L (90 bottles each with a capacity of 47 L at a pressure of 14.7 MPa). In case new Ar bottles cannot be delivered during drilling operations (i.e. if the drilling site is too far from the coast), (1) the sample selection and the analytical schedule have to be well organized and the operating conditions optimized to cover the duration of the cruise according to the expected goals and/or (2) to plan an increase in the Ar gas supply capacity of the D/V Chikyu. Otherwise, He is frequently used as a carrier gas before being mixed with Ar downstream of the ablation cell. In the present study, we used an Ar gas line only, and a different procedure coupling the use of both He and Ar could be adapted to increase the instrument sensitivity.
An alternative to the analysis of whole-rock trace element concentrations is the in situ analysis in minerals. The Lab Street Deck of the D/V Chikyu is equipped with a sample preparation room where thin sections and epoxy mounts for separated minerals can be prepared. In this way during Leg 3, laser ablation analyses have been performed on epoxy mounts containing pyroxenes separated from the CM core mantle harzburgites, and replicate analyses performed at the IES-AS laboratory (Taiwan) were in good agreement with results obtained on-board. Similarly, the method presented here could thus be applied for the trace element analysis of thin sections prepared from heterogenous materials or of epoxy plots prepared for separated minerals.
We presented a “dry” safe method to assess whole-rock trace to ultra-trace element concentrations in mafic and ultramafic rocks from the oceanic lithosphere, developed to be used at sea. The reliability of the results obtained for the reference materials (BHVO-2, BIR-1a and JP-1) and for gabbro and dunite samples from the Oman ophiolite (OmanDP Hole CM1A) is shown for concentrations as low as 1–2 ng g−1, especially for Rare Earth Elements. This method can be well adapted for a low-resolution study of the chemical evolutions along cores recovered during scientific ocean drillings, especially in light of the major element compositions previously obtained by XRF and/or for the study of more specific intervals along the cores. Sixty years after the initiation of Project Mohole in 1961 that initially aimed to drill under the oceans in order to cross the Moho and reach the Earth's mantle, this striving target for Earth scientists has not yet been achieved. The perspective of the Mohole to Mantle (M2M) drilling project that could be conducted within the next few years in the Pacific Ocean using the D/V Chikyu (Michibayashi et al., 2019; Morishita et al., 2019; Teagle and Ildefonse, 2011; Umino et al., 2021) is a stimulating motivation for the development of new on-board techniques and instruments that could contribute to make this ultimate objective of the scientific ocean drilling a success. Alternatively, this method could be improved and/or adapted for other materials recovered in the course of future ocean drillings as well as for other chemical elements of interest in addition to the 37 elements investigated here (transition elements and Ga, Li and LILE, REE, HFSE, Y, Pb, Th, and U).
The whole-rock (ultra-)trace element concentrations obtained by LA-ICP-MS for the pressed powder prepared for the three reference materials BHVO-2, BIR-1a and JP-1 are given in Table 2. The measured elements discussed for the Oman Drilling Project CM gabbros and dunites, both obtained by LA-ICP-MS on-board the D/V Chikyu and replicate analyses after Leg 3, are given in the Supplement.
The supplement related to this article is available online at: https://doi.org/10.5194/sd-30-75-2022-supplement.
Yuya Akamatsu (Department of Earth and Planetary Systems Science, Hiroshima University, Japan), Anwaar Al-Hajri (Department of Applied Geoscience, German University of Technology in Oman, Oman), Said Almusharrafi (Geological Survey, Public Authority for Mining, Oman), Ibrahim AlSawafi (Geological Research and Heritage Department, Public Authority for Mining, Oman), Elena Amador-French (Division of Geological and Planetary Sciences, California Institute of Technology, USA), Valentin Basch (Scienze della Terra dell'Ambiante e della Vita, University of Genova, Italy), Mike Cheadle (Department of Geology and Geophysics, University of Wyoming, USA), Saebyul Choe (Department of Earth and Planetary Sciences, American Museum of Natural History, USA), Jude Coggon (School of Ocean and Earth Science, University of Southampton, United Kingdom), Nick Dygert (Department of Earth and Environmental Science, University of Tennessee – Knoxville, USA), Bethany Ehlmann (Division of Geological and Planetary Sciences, California Institute of Technology, USA), Aled Evans (School of Ocean and Earth Sciences, University of Southampton, United Kingdom), Gretchen Früh-Green (Department of Earth Sciences, ETH Zurich, Switzerland), Marta Grabowska (Geography, Earth and Environmental Sciences, University of Plymouth, United Kingdom), Nadine Grambling (Department of Earth and Environmental Science, University of Tennessee - Knoxville, USA), Rebecca Greenberger (Department of Geological and Planetary Sciences, California Institute of Technology, USA), Annika Greve (R&D Center for Ocean Drilling Science, JAMSTEC, Japan), Juan Miguel Guotana (Division of Natural System, Kanazawa University, Japan), Kohei Hatakeyama (Department of Earth and Planetary Systems Science, Hiroshima University, Japan), Greg Hirth (Earth, Environmental and Planetary Sciences, Brown University, USA), Max Jansen (School of Earth and Ocean Sciences, Cardiff University, United Kingdom), Kevin Johnson (Department of Geology and Geophysics, University of Hawaii, USA), Mary-Alix Kaczmarek (Géosciences Environnement Toulouse, University Paul Sabatier Toulouse III, France), Peter Kelemen (Department of Earth and Environmental Sciences, Columbia University, USA), Kosuke Kimura (Department of Earth and Planetary Systems Science, Hiroshima University, Japan), Frieder Klein (Department of Marine Chemistry and Geology, Woods Hole Oceanographic Institution, USA), Juergen Koepke (Institut für Mineralogie, Leibniz University Hannover, Germany), Juerg Matter (School of Ocean and Earth Science, University of Southampton, United Kingdom), Katsuyoshi Michibayashi (Institute of Geosciences, Shizuoka University, Japan / Graduate School of Environmental Studies, Nagoya University, Japan), Tomoaki Morishita (Earth Science Course, Kanazawa University, Japan), Atsushi Okamoto (Graduate School of Environmental Studies, Tohoku University, Japan), Keishi Okazaki (Kochi Institute for Core Sample Research, JAMSTEC, Japan), Ryosuke Oyanagi (Department of Solid Earth Geochemistry, JAMSTEC, Japan), Gyuseung Park (School of Earth and Environment System, Seoul National University, Republic of Korea), Betchaida Payot (National Institute of Geological Sciences, University of the Philippines, Philippines), Philippe Pezard (Géosciences Montpellier, CNRS, Université de Montpellier, France), Marie Python (Department of Natural History Science, Hokkaido University, Japan), Nehal Warsi (AZD Engineering, Oman).
MR, FK, AT and ET settled the laser ablation system installed on-board the D/V Chikyu. FK, MR, MGi, SC, KI, MGo and EC developed the sample preparation procedure. MR, FK and MJC analysed the replicates. NA and KM provided technical information about the laboratory facilities and equipment installed on-board the Chikyu and support for the method development. DAHT and ET were the co-chiefs of the ChikyuOman2018 Leg 3. MR wrote the initial draft of the manuscript and all the authors contributed improvements to the final paper.
The authors declare that they have no conflict of interest.
Publisher's note: Copernicus Publications remains neutral with regard to jurisdictional claims in published maps and institutional affiliations.
We greatly thank Abigail Barker and Daniel Peters for their very constructive reviews that helped to improve the quality of this manuscript, as well as Thomas Wiersberg for editorial handling. We also warmly thank the workers from Marine Works Japan on their great assistance during the ChikyuOman2018 Leg 3 core characterization campaign, in particular for their help in settling the instruments and developing the sample preparation and analytical procedure presented in the present article, as well as Jude Coggon for her great support on-board. We are also grateful to Lena Maeda (CDEX/JAMSTEC) to have checked with us some details concerning the characteristics of equipment installed on-board the D/V Chikyu.
This research used samples and/or data provided by the Oman Drilling Project. The Oman Drilling Project (OmanDP) has been possible through co-mingled funds from the International Continental Scientific Drilling Project (ICDP; Peter B. Kelemen, Juerg Matter, Damon A. H. Teagle Lead PIs), the Sloan Foundation – Deep Carbon Observatory (grant no. 2014-3-01, Kelemen PI), the National Science Foundation (grant no. NSF-EAR-1516300, Kelemen lead PI), NASA – Astrobiology Institute (grant no. NNA15BB02A, Templeton PI), the German Research Foundation (DFG: grant no. KO 1723/21-1, Koepke PI), the Japanese Society for the Promotion of Science (JSPS (grant no. 16H06347), Michibayashi PI; and KAKENHI (grant no. 16H02742), Takazawa PI), the European Research Council (Adv: grant no. 669972; Jamveit PI), the Swiss National Science Foundation (SNF: grant no. 20FI21_163073, Früh-Green PI), JAMSTEC, the TAMU-JR Science Operator, and contributions from the Sultanate of Oman Ministry of Regional Municipalities and Water Resources, the Oman Public Authority of Mining, Sultan Qaboos University, CNRS-Univ. Montpellier, Columbia University of New York, and the University of Southampton. Mathieu Rospabé's participation in on-site and shipboard operations was made possible through a financial support provided by the Centre National de la Recherche Scientifique-Institut National des Sciences de l'Univers (CNRS-INSU), IODP-France (regular fund).
This paper was edited by Thomas Wiersberg and reviewed by Daniel Peters and Abigail Barker.
Akizawa, N., Ishikawa, A., and Kogiso, T.: A simple determination of whole-rock major- And trace-element composition for peridotite by micro-XRF spectrometer and ICP-MS using fused-glass bead, Geochem. J., 54(2), 81–90, https://doi.org/10.2343/geochemj.2.0587, 2020.
Anonymous: Penrose Field Conference on ophiolites, Geotimes, 17, 24–25, 1972.
Arrowsmith, P.: Laser ablation of solids for elemental analysis by inductively coupled plasma mass spectrometry, Anal. Chem., 59, 1437–1444, https://doi.org/10.1021/ac00137a014, 1987.
Barrat, J.-A., Keller, F., Amossé, J., Taylor, R. N., Nesbitt, R. W., and Hirata, T.: Determination of Rare Earth Elements in Sixteen Silicate Reference Samples by Icp-Ms After Tm Addition and Ion Exchange Separation, Geostand. Newsl., 20, 133–139, https://doi.org/10.1111/j.1751-908X.1996.tb00177.x, 1996.
Barrat, J. A., Yamaguchi, A., Greenwood, R. C., Benoit, M., Cotten, J., Bohn, M., and Franchi, I. A.: Geochemistry of diogenites: Still more diversity in their parental melts, Meteor. Planet. Sci., 43, 1759-1775, https://doi.org/10.1111/j.1945-5100.2008.tb00641.x, 2008.
Barrat, J.-A., Zanda, B., Moynier, F., Bollinger, C., Liorzou, C., and Bayon, G.: Geochemistry of CI chondrites: Major and trace elements, and Cu and Zn Isotopes, Geochim. Cosmochim. Acta, 83, 79–92, https://doi.org/10.1016/j.gca.2011.12.011, 2012.
Bayon, G., Barrat, J.-A., Etoubleau, J., Benoit, M., Bollinger, C., and Révillon, S.: Determination of rare earth elements, Sc, Y, Zr, Ba, Hf and Th in geological samples by ICP-MS after Tm addition and alkaline fusion, Geostand. Geoanal. Res., 33, 51–62, https://doi.org/10.1111/j.1751-908X.2008.00880.x, 2009.
Bizzarro, M., Baker, J. A., and Ulfbeck, D.: A new digestion and chemical separation technique for rapid and highly reproducible determination of Lu/Hf and Hf isotope ratios in geological materials by mc-ICP-MS, Geostand. Newsl., 27, 133–145, https://doi.org/10.1111/j.1751-908X.2003.tb00641.x, 2003.
Boudier, F. and Nicolas, A.: Harzburgite and lherzolite subtypes in ophiolitic and oceanic environments, Earth Planet. Sci. Lett., 76, 84–92, https://doi.org/10.1016/0012-821X(85)90150-5, 1985.
Coleman, R. G.: Plate tectonic emplacement of upper mantle peridotites along continental edges, J. Geophys. Res., 76, 1212–1222, https://doi.org/10.1029/JB076i005p01212, 1971.
Coleman, R. G.: Ophiolites: ancient oceanic lithosphere?, Springer-Verlag, Berlin Heidelberg, Germany, https://doi.org/10.1007/978-3-642-66673-5, 1977.
Dilek, Y.: Ophiolite concept and its evolution, Spec. Pap.-Geol. Soc. Amer., 373, 1–16, https://doi.org/10.1130/0-8137-2373-6.1, 2003.
Eggins, S. M.: Laser ablation ICP-MS analysis of geological materials prepared as lithium borate glasses, Geostand. Newsl., 27, 147–162, https://doi.org/10.1111/j.1751-908X.2003.tb00642.x, 2003.
Garbe-Schönberg, D. and Müller, S.: Nano-particulate pressed powder tablets for LA-ICP-MS, J. Anal. At. Spectrom., 29, 990–1000, https://doi.org/10.1039/c4ja00007b, 2014.
Gerbert-Gaillard, L.: Caractérisation Géochimique des Péridotites de l'ophiolite d'Oman: Processus Magmatiques aux Limites Lithosphère/Asthénosphère, PhD thesis Université Montpellier II, France, 2002 (in French).
Glennie, K. W., Boeuf, M. G. A., Hughes Clarke, M. W., Moody-Stuart, M., Pilaar, W. F. H., and Reinhardt, B. M.: Geology of the Oman Mountains, Verhandling Koninkelijk Nederlands Geologisch Mijnboukundig Genootschap, 31, 423 pp., 1974.
Godard, M., Jousselin, D., and Bodinier, J.-L.: Relationships between geochemistry and structure beneath a palaeo-spreading centre: A study of the mantle section in the Oman ophiolite, Earth Planet. Sci. Lett., 180, 133–148, https://doi.org/10.1016/S0012-821X(00)00149-7, 2000.
Godard, M., Lagabrielle, Y., Alard, O., and Harvey, J.: Geochemistry of the highly depleted peridotites drilled at ODP Sites 1272 and 1274 (Fifteen-Twenty Fracture Zone, Mid-Atlantic Ridge): Implications for mantle dynamics beneath a slow spreading ridge, Earth Planet. Sci. Lett., 267, 410–425, https://doi.org/10.1016/j.epsl.2007.11.058, 2008.
Gray, A. L.: Solid sample introduction by laser ablation for inductively coupled plasma source mass spectrometry, Analyst, 110, 551–556, https://doi.org/10.1039/AN9851000551, 1985.
Hanghøj, K., Kelemen, P. B., Hassler, D., and Godard, M.: Composition and genesis of depleted mantle peridotites from the Wadi Tayin massif, Oman ophiolite; Major and trace element geochemistry, and Os isotope and PGE systematics, J. Petrol., 51, 201–227, https://doi.org/10.1093/petrology/egp077, 2010.
Hopson, C. A., Coleman, R. G., Gregory, R. T., Pallister, J. S., and Bailey, E. H.: Geologic section through the Samail ophiolite and associated rocks along a Muscat-Ibra transect, southeastern Oman Mountains, J. Geophys. Res.-Sol. Ea., 86, 2527–2544, https://doi.org/10.1029/JB086iB04p02527, 1981.
Imai, N.: Quantitative analysis of original and powdered rocks and mineral inclusions by laser ablation inductively coupled plasma mass spectrometry, Anal. Chim. Acta, 235, 381–391, https://doi.org/10.1016/S0003-2670(00)82097-8, 1990.
Imai, N., Terashima, S., Itoh, S., and Ando, A.: 1994 compilation values for GSJ reference samples, “Igneous rock series”, Geochem. J., 29, 91–95, https://doi.org/10.2343/geochemj.29.91, 1995.
Imai, N., Terashima, S., Itoh, S., and Ando, A.: 1998 compilation of analytical data for five GSJ geochemical reference samples: The “instrumental analysis series”, Geostand. Newsl., 23, 223–250, https://doi.org/10.1111/j.1751-908X.1999.tb00576.x, 1999.
Ionov, D. A., Savoyant, L., and Dupuy, C.: Application of the ICP-MS technique to trace element analysis of peridotites and their minerals, Geostand. Newsl., 16, 311–315, https://doi.org/10.1111/j.1751-908X.1992.tb00494.x, 1992.
Jochum, K. P., Seufert, H. M., and Thirlwall, M. F.: High-sensitivity Nb analysis by spark-source mass spectrometry (SSMS) and calibration of XRF Nb and Zr, Chem. Geol., 81, 1–16, https://doi.org/10.1016/0009-2541(90)90035-6, 1990.
Jochum, K. P., Willbold, M., Raczek, I., Stoll, B., and Herwig, K.: Chemical characterisation of the USGS reference glasses GSA-1G, GSC-1G, GSD-1G, GSE-1G, BCR-2G, BHVO-2G and BIR-1G using EPMA, ID-TIMS, ID-ICP-MS and LA-ICP-MS, Geostand. Geoanal. Res., 29, 285–302, https://doi.org/10.1111/j.1751-908x.2005.tb00901.x, 2005.
Jochum, K. P., Weis, U., Stoll, B., Kuzmin, D., Yang, Q., Raczek, I., Jacob, D. E., Stracke, A., Birbaum, K., Frick, D. A., Günther, D., and Enzweiler, J.: Determination of reference values for NIST SRM 610-617 glasses following ISO guidelines, Geostand. Geoanal. Res., 35, 397–429, https://doi.org/10.1111/j.1751-908X.2011.00120.x, 2011.
Kelemen, P., Al Rajhi, A., Godard, M., Ildefonse, B., Köpke, J., MacLeod, C., Manning, C., Michibayashi, K., Nasir, S., Shock, E., Takazawa, E., and Teagle, D.: Scientific Drilling and Related Research in the Samail Ophiolite, Sultanate of Oman, Sci. Dril., 15, 64–71, https://doi.org/10.2204/iodp.sd.15.10.2013, 2013.
Kelemen, P. B., Matter, J. M., Teagle, D. A. H., Coggon, J. A., and the Oman Drilling Project Science Team (Eds.): Methods and explanatory notes, in: Proceedings of the Oman Drilling Project: College Station, TX (International Ocean Discovery Program), https://doi.org/10.14379/OmanDP.proc.2020, 2020.
Kelemen, P. B., Matter, J. M., Teagle, D. A. H., Coggon, J. A., and the Oman Drilling Project Science Team (Eds.): Site CM1: layered gabbros, crustal ultramafic rocks, and mantle harzburgite, in: Proceedings of the Oman Drilling Project: College Station, TX (International Ocean Discovery Program), https://doi.org/10.14379/OmanDP.proc.2020, 2021a.
Kelemen, P. B., Matter, J. M., Teagle, D. A. H., Coggon, J. A., and the Oman Drilling Project Science Team (Eds.): Site CM2: crust-mantle transition zone and into upper mantle, in: Proceedings of the Oman Drilling Project: College Station, TX (International Ocean Discovery Program), https://doi.org/10.14379/OmanDP.proc.2020, 2021b.
Kelemen, P. B., Matter, J. M., Teagle, D. A. H., Coggon, J. A., and the Oman Drilling Project Science Team (Eds.): Oman Drilling Project Phase 1 and 2 Summary, in: Proceedings of the Oman Drilling Project: College Station, TX (International Ocean Discovery Program), https://doi.org/10.14379/OmanDP.proc.2020, in press, 2021c.
Kon, Y. and Hirata, T.: Determination of 10 major and 34 trace elements in 34 GSJ geochemical reference samples using femtosecond laser ablation ICP-MS, Geochem. J., 49, 351–375, https://doi.org/10.2343/geochemj.2.0362, 2015.
Kon, Y., Murakami, H., Takagi, T., and Watanabe, Y.: The development of whole rock analysis of major and trace elements in XRF glass beads by fsLA-ICPMS in GSJ geochemical reference samples, Geochem. J., 45, 387–416, https://doi.org/10.2343/geochemj.1.0133, 2011.
Le Mée, L., Girardeau, J., and Monnier, C.: Mantle segmentation along the Oman ophiolite fossil mid-ocean ridge, Nature, 432, 167–172, https://doi.org/10.1038/nature03075, 2004.
Lippard, S. J., Shelton, A. W., and Gass, I. G.: The ophiolite of the Northern Oman, Geol. Soc. London, Mem., 11, 1–16, https://doi.org/10.1144/GSL.MEM.1986.011.01.01, 1986.
Longerich, H. P., Jackson, S. E., and Gunther, D.: Laser ablation inductively coupled plasma mass spectrometric transient signal data acquisition and analyte concentration calculation, J. Anal. At. Spectrom., 11, 899–904, https://doi.org/10.1039/JA9961100899, 1996.
Makishima, A. and Nakamura, E.: Suppression of matrix effects in ICP-MS by high power operation of ICP: Application to precise determination of Rb, Sr, Y, Cs, Ba, REE, Pb, Th and U at ng g-1 levels in milligram silicate samples, Geostand. Newsl., 21, 307–319, https://doi.org/10.1111/j.1751-908X.1997.tb00678.x, 1997.
Makishima, A. and Nakamura, E.: Determination of major/minor and trace elements in silicate samples by ICP-QMS and ICP-SFMS applying isotope dilution-internal standardisation (ID-IS) and multi-stage internal standardisation, Geostand. Geoanal. Res., 30, 245–271, https://doi.org/10.1111/j.1751-908X.2006.tb01066.x, 2006.
Michibayashi, K., Tominaga, M., Ildefonse, B., and Teagle, D.: What Lies Beneath: The Formation and Evolution of Oceanic Lithosphere, Oceanography, 32, 138–149, https://doi.org/10.5670/oceanog.2019.136, 2019.
Monnier, C., Girardeau, J., Le Mée, L., and Polvé, M.: Along-ridge petrological segmentation of the mantle in the Oman ophiolite, Geochem. Geophy. Geosy., 7, Q11008, https://doi.org/10.1029/2006GC001320, 2006.
Morishita, T., Umino, S., Kimura, J.-I., Yamashita, M., Ono, S., Michibayashi, K., Tominaga, M., Klein, F., and Garcia, M. O.: Workshop report on hard-rock drilling into mid-Cretaceous Pacific oceanic crust on the Hawaiian North Arch, Sci. Dril., 26, 47–58, https://doi.org/10.5194/sd-26-47-2019, 2019.
Mukherjee, P. K., Khanna, P. P., and Saini, N. K.: Rapid determination of trace and ultra trace level elements in diverse silicate rocks in pressed powder pellet targets by LA-ICP-MS using a matrix-independent protocol, Geostand. Geoanal. Res., 38, 363–379, https://doi.org/10.1111/j.1751-908X.2013.00260.x, 2014.
Nakamura, K. and Chang, Q.: Precise determination of ultra-low (sub-ng g-1) level rare earth elements in ultramafic rocks by quadrupole ICP-MS, Geostand. Geoanal. Res., 31, 185–197, https://doi.org/10.1111/j.1751-908X.2007.00859.x, 2007.
Peters, D. and Pettke, T.: Evaluation of Major to Ultra Trace Element Bulk Rock Chemical Analysis of Nanoparticulate Pressed Powder Pellets by LA-ICP-MS, Geostand. Geoanal. Res., 41, 5–28, https://doi.org/10.1111/ggr.12125, 2017.
Qi, L., Zhou, M.-F., Malpas, J., and Sun, M.: Determination of Rare Earth Elements and Y in Ultramafic Rocks by ICP-MS After Preconcentration Using Fe(OH)3 and Mg(OH)2 Coprecipitation, Geostand. Geoanal. Res., 29, 131–141, https://doi.org/10.1111/j.1751-908X.2005.tb00660.x, 2005.
Rospabé, M.: Etude pétrologique, géochimique et structurale de la zone de transition dunitique dans l'ophiolite d'Oman: Identification des processus pétrogénétiques à l'interface manteau/croûte, PhD thesis Université Paul Sabatier, Toulouse III, France, 2018 (in French).
Rospabé, M., Benoit, M., and Candaudap, F.: Determination of Trace Element Mass Fractions in Ultramafic Rocks by HR-ICP-MS: A Combined Approach Using a Direct Digestion/Dilution Method and Preconcentration by Coprecipitation, Geostand. Geoanal. Res., 42, 115–129, https://doi.org/10.1111/ggr.12181, 2018a.
Rospabé, M., Benoit, M., Ceuleneer, G., Hodel, F., and Kaczmarek, M.-A.: Extreme geochemical variability through the dunitic transition zone of the Oman ophiolite: Implications for melt/fluid-rock reactions at Moho level beneath oceanic spreading centers, Geochim. Cosmochim. Acta, 234, 1–23, https://doi.org/10.1016/j.gca.2018.05.012, 2018b.
Rospabé, M., Benoit, M., Ceuleneer, G., Kaczmarek, M.-A., and Hodel, F.: Melt hybridization and metasomatism triggered by syn-magmatic faults within the Oman ophiolite: A clue to understand the genesis of the dunitic mantle-crust transition zone, Earth Planet. Sci. Lett., 516, 108–121, https://doi.org/10.1016/j.epsl.2019.04.004, 2019.
Sato, T., Miyazaki, T., Tamura, Y., Gill, J. B., Jutzeler, M., Senda, R., and Kimura, J. I.: The earliest stage of Izu rear-arc volcanism revealed by drilling at Site U1437, International Ocean Discovery Program Expedition 350, Isl. Arc, 29, e12340, https://doi.org/10.1111/iar.12340, 2020.
Senda, R., Kimura, J. I., and Chang, Q.: Evaluation of a rapid, effective sample digestion method for trace element analysis of granitoid samples containing acid-resistant minerals: Alkali fusion after acid digestion, Geochem. J., 48, 99–103, https://doi.org/10.2343/geochemj.2.0280, 2014.
Sharma, M. and Wasserburg, G. J.: The neodymium isotopic compositions and rare earth patterns in highly depleted ultramafic rocks, Geochim. Cosmochim. Acta, 60, 4537–4550, https://doi.org/10.1016/S0016-7037(96)00280-3, 1996.
Sharma, M., Wasserburg, G. J., Papanastassiou, D. A., Quick, J. E., Sharkov, E. V., and Laz'ko, E. E.: High143Nd/144Nd in extremely depleted mantle rocks, Earth Planet. Sci. Lett., 135, 101–114, https://doi.org/10.1016/0012-821X(95)00150-B, 1995.
Takazawa, E., Okayasu, T., and Satoh, K.: Geochemistry and origin of the basal lherzolites from the northern Oman ophiolite (northern Fizh block), Geochem., Geophy. Geosy., 4, 1021, https://doi.org/10.1029/2001GC000232, 2003.
Tamura, A., Akizawa, N., Otsuka, R., Kanayama, K., Python, M., Morishita, T., and Arai, S.: Measurement of whole-rock trace-element composition by flux-free fused glass and LA-ICP-MS: Evaluation of simple and rapid routine work, Geochem. J., 49, 243–258, https://doi.org/10.2343/geochemj.2.0353, 2015.
Tanaka, E., Nakamura, K., Yasukawa, K., Mimura, K., Fujinaga, K., Ohta, J., Iijima, K., Nozaki, T., Machida, S., and Kato, Y.: Chemostratigraphic correlations of deep-sea sediments in the western north pacific ocean: A new constraint on the distribution of mud highly enriched in rare-earth elements, Minerals, 10, 1–19, https://doi.org/10.3390/min10060575, 2020a.
Tanaka, E., Nakamura, K., Yasukawa, K., Mimura, K., Fujinaga, K., Iijima, K., Nozaki, T., and Kato, Y.: Chemostratigraphy of deep-sea sediments in the western North Pacific Ocean: Implications for genesis of mud highly enriched in rare-earth elements and yttrium, Ore Geol. Rev., 119, 103392, https://doi.org/10.1016/j.oregeorev.2020.103392, 2020b.
Teagle, D. and Ildefonse, B.: Journey to the mantle of the Earth, Nature, 471, 437–439, https://doi.org/10.1038/471437a, 2011.
Umino, S., Moore, G. F., Boston, B., Coggon, R., Crispini, L., D'Hondt, S., Garcia, M. O., Hanyu, T., Klein, F., Seama, N., Teagle, D. A. H., Tominaga, M., Yamashita, M., Harris, M., Ildefonse, B., Katayama, I., Kusano, Y., Suzuki, Y., Trembath-Reichert, E., Yamada, Y., Abe, N., Xiao, N., and Inagaki, F.: Workshop report: Exploring deep oceanic crust off Hawai`i, Sci. Dril., 29, 69–82, https://doi.org/10.5194/sd-29-69-2021, 2021.
Van Heuzen, A. A.: Analysis of solids by laser ablation–inductively coupled plasma–mass spectrometry (LA-ICP-MS) – I. matching with a glass matrix, Spectrochim. Acta Part B At. Spectrosc., 46, 1803–1817, https://doi.org/10.1016/0584-8547(91)80207-J, 1991.
Weyer, S., Münker, C., Rehkämper, M., and Mezger, K.: Determination of ultra-low Nb, Ta, Zr and Hf concentrations and the chondritic Zr/Hf and Nb/Ta ratios by isotope dilution analyses with multiple collector ICP-MS, Chem. Geol., 187, 295–313, https://doi.org/10.1016/S0009-2541(02)00129-8, 2002.
Yasukawa, K., Ohta, J., Mimura, K., Tanaka, E., Takaya, Y., Usui, Y., Fujinaga, K., Machida, S., Nozaki, T., Iijima, K., Nakamura, K., and Kato, Y.: A new and prospective resource for scandium: Evidence from the geochemistry of deep-sea sediment in the western North Pacific Ocean, Ore Geol. Rev., 102, 260–267, https://doi.org/10.1016/j.oregeorev.2018.09.001, 2018.
Yasukawa, K., Kino, S., Azami, K., Tanaka, E., Mimura, K., Ohta, J., Fujinaga, K., Nakamura, K., and Kato, Y.: Geochemical features of Fe-Mn micronodules in deep-sea sediments of the western North Pacific Ocean: Potential for co-product metal extraction from REY-rich mud, Ore Geol. Rev., 127, 103805, https://doi.org/10.1016/j.oregeorev.2020.103805, 2020.
Yokoyama, T., Makishima, A., and Nakamura, E.: Evaluation of the coprecipitation of incompatible trace elements with fluoride during silicate rock dissolution by acid digestion, Chem. Geol., 157, 175–187, https://doi.org/10.1016/S0009-2541(98)00206-X, 1999.
Zhu, Y., Hioki, A., and Chiba, K.: Quantitative analysis of the elements in powder samples by LA-ICP-MS with PMMA powder as the binder and Cs as the internal standard, J. Anal. At. Spectrom., 28, 301–306, https://doi.org/10.1039/c2ja30279a, 2013.